Cities with the Highest Percentage of Immigrants from Italy in Connecticut
RELATED REPORTS & OPTIONS
Italy
Connecticut
Compare Cities
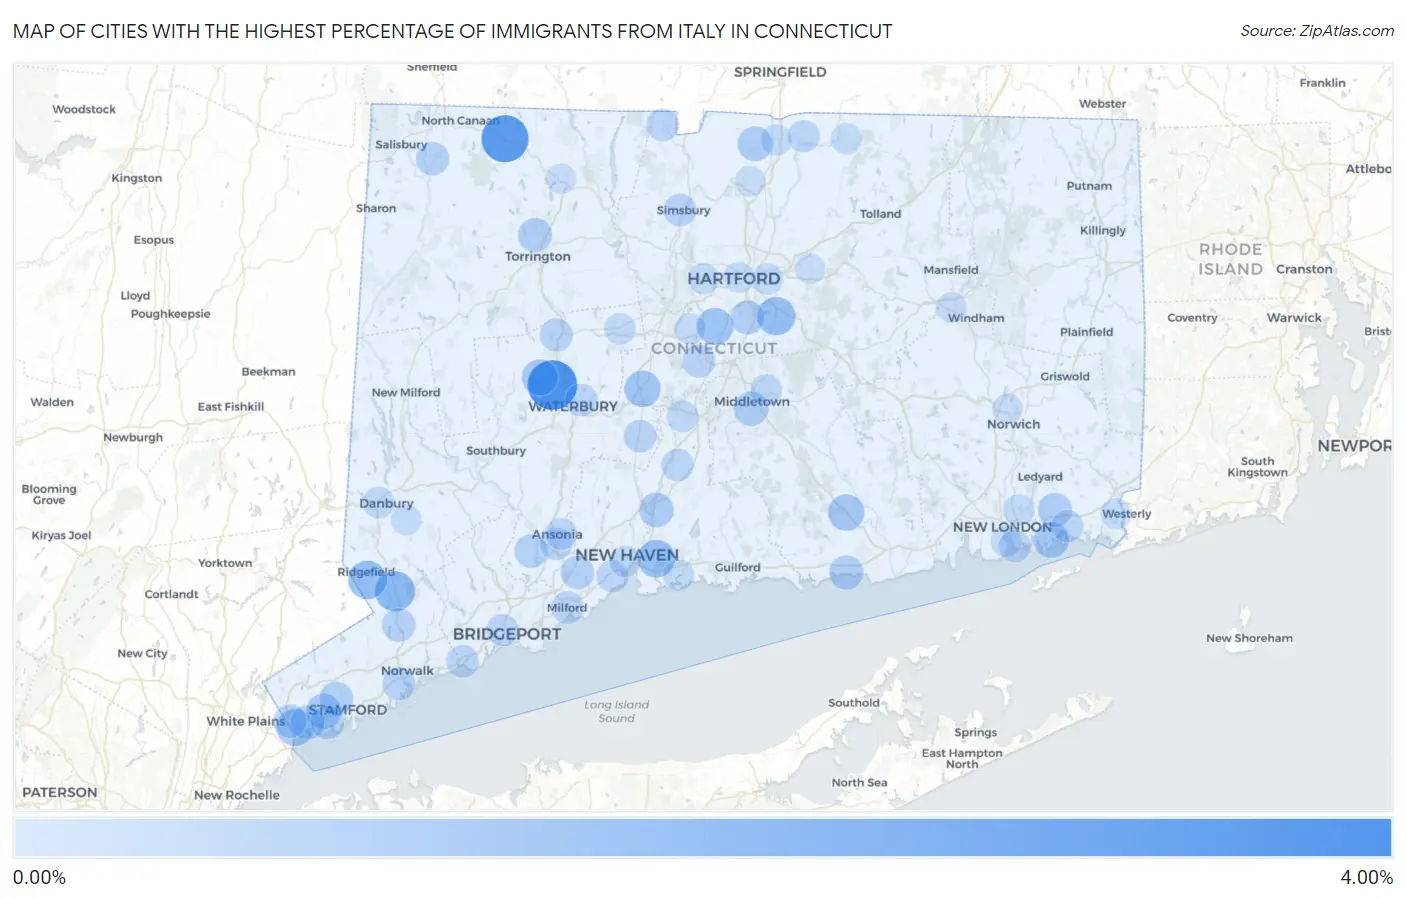
Map of Cities with the Highest Percentage of Immigrants from Italy in Connecticut
0.00%
4.00%
Cities with the Highest Percentage of Immigrants from Italy in Connecticut
| City | Italy | vs State | vs National | |
| 1. | Oakville | 3.87% | 0.42%(+3.45)#1 | 0.095%(+3.77)#37 |
| 2. | Norfolk | 3.37% | 0.42%(+2.95)#2 | 0.095%(+3.28)#45 |
| 3. | Ridgebury | 2.70% | 0.42%(+2.28)#3 | 0.095%(+2.60)#66 |
| 4. | Saugatuck | 2.67% | 0.42%(+2.25)#4 | 0.095%(+2.57)#67 |
| 5. | Northford | 2.28% | 0.42%(+1.86)#5 | 0.095%(+2.18)#95 |
| 6. | Greens Farms | 2.26% | 0.42%(+1.84)#6 | 0.095%(+2.17)#97 |
| 7. | Tashua | 2.12% | 0.42%(+1.70)#7 | 0.095%(+2.02)#111 |
| 8. | Georgetown | 1.93% | 0.42%(+1.51)#8 | 0.095%(+1.84)#130 |
| 9. | Taylor Corners | 1.77% | 0.42%(+1.35)#9 | 0.095%(+1.67)#154 |
| 10. | Ridgefield | 1.62% | 0.42%(+1.20)#10 | 0.095%(+1.53)#172 |
| 11. | Glastonbury Center | 1.57% | 0.42%(+1.15)#11 | 0.095%(+1.48)#182 |
| 12. | East Haven | 1.47% | 0.42%(+1.05)#12 | 0.095%(+1.37)#196 |
| 13. | Trumbull Center | 1.46% | 0.42%(+1.04)#13 | 0.095%(+1.37)#198 |
| 14. | Rock Ridge | 1.44% | 0.42%(+1.02)#14 | 0.095%(+1.34)#200 |
| 15. | Plattsville | 1.37% | 0.42%(+0.951)#15 | 0.095%(+1.28)#215 |
| 16. | Pemberwick | 1.31% | 0.42%(+0.888)#16 | 0.095%(+1.21)#234 |
| 17. | Candlewood Isle | 1.28% | 0.42%(+0.866)#17 | 0.095%(+1.19)#239 |
| 18. | Newington | 1.28% | 0.42%(+0.858)#18 | 0.095%(+1.18)#241 |
| 19. | Daniels Farm | 1.24% | 0.42%(+0.817)#19 | 0.095%(+1.14)#249 |
| 20. | Plantsville | 1.20% | 0.42%(+0.780)#20 | 0.095%(+1.11)#261 |
| 21. | Deep River Center | 1.19% | 0.42%(+0.766)#21 | 0.095%(+1.09)#266 |
| 22. | Watertown | 1.17% | 0.42%(+0.749)#22 | 0.095%(+1.07)#272 |
| 23. | Noank | 1.05% | 0.42%(+0.635)#23 | 0.095%(+0.959)#308 |
| 24. | Cos Cob | 0.99% | 0.42%(+0.575)#24 | 0.095%(+0.900)#339 |
| 25. | Mill Plain | 0.98% | 0.42%(+0.558)#25 | 0.095%(+0.883)#350 |
| 26. | Stratford Downtown | 0.97% | 0.42%(+0.556)#26 | 0.095%(+0.880)#351 |
| 27. | Staples | 0.96% | 0.42%(+0.539)#27 | 0.095%(+0.864)#364 |
| 28. | Sandy Hook | 0.95% | 0.42%(+0.528)#28 | 0.095%(+0.853)#370 |
| 29. | Lordship | 0.94% | 0.42%(+0.516)#29 | 0.095%(+0.841)#375 |
| 30. | Suffield Depot | 0.90% | 0.42%(+0.482)#30 | 0.095%(+0.807)#396 |
| 31. | East | 0.88% | 0.42%(+0.464)#31 | 0.095%(+0.789)#403 |
| 32. | North Haven | 0.88% | 0.42%(+0.458)#32 | 0.095%(+0.782)#410 |
| 33. | New Canaan | 0.85% | 0.42%(+0.426)#33 | 0.095%(+0.751)#424 |
| 34. | Middletown | 0.84% | 0.42%(+0.424)#34 | 0.095%(+0.749)#427 |
| 35. | Torrington | 0.78% | 0.42%(+0.358)#35 | 0.095%(+0.683)#471 |
| 36. | Westbrook Center | 0.78% | 0.42%(+0.358)#36 | 0.095%(+0.682)#472 |
| 37. | Old Mystic | 0.77% | 0.42%(+0.349)#37 | 0.095%(+0.674)#481 |
| 38. | Wethersfield | 0.74% | 0.42%(+0.324)#38 | 0.095%(+0.648)#505 |
| 39. | Greenwich | 0.74% | 0.42%(+0.321)#39 | 0.095%(+0.646)#512 |
| 40. | Stamford | 0.74% | 0.42%(+0.318)#40 | 0.095%(+0.643)#519 |
| 41. | Route 7 Gateway | 0.69% | 0.42%(+0.274)#41 | 0.095%(+0.599)#564 |
| 42. | Riverside | 0.67% | 0.42%(+0.252)#42 | 0.095%(+0.576)#585 |
| 43. | Wilton Center | 0.67% | 0.42%(+0.251)#43 | 0.095%(+0.575)#587 |
| 44. | Glenville | 0.64% | 0.42%(+0.223)#44 | 0.095%(+0.548)#618 |
| 45. | Falls Village | 0.63% | 0.42%(+0.215)#45 | 0.095%(+0.540)#626 |
| 46. | Shelton | 0.63% | 0.42%(+0.209)#46 | 0.095%(+0.534)#633 |
| 47. | Orange | 0.62% | 0.42%(+0.199)#47 | 0.095%(+0.524)#646 |
| 48. | Thomaston | 0.57% | 0.42%(+0.156)#48 | 0.095%(+0.480)#688 |
| 49. | Woodmont Borough | 0.56% | 0.42%(+0.137)#49 | 0.095%(+0.461)#713 |
| 50. | Inglenook | 0.55% | 0.42%(+0.135)#50 | 0.095%(+0.460)#717 |
| 51. | Norwalk | 0.55% | 0.42%(+0.129)#51 | 0.095%(+0.454)#733 |
| 52. | Kensington | 0.54% | 0.42%(+0.124)#52 | 0.095%(+0.448)#738 |
| 53. | Newtown Borough | 0.51% | 0.42%(+0.091)#53 | 0.095%(+0.416)#791 |
| 54. | Compo | 0.49% | 0.42%(+0.076)#54 | 0.095%(+0.400)#816 |
| 55. | Cheshire Village | 0.49% | 0.42%(+0.074)#55 | 0.095%(+0.399)#818 |
| 56. | Simsbury Center | 0.49% | 0.42%(+0.072)#56 | 0.095%(+0.396)#823 |
| 57. | Stepney | 0.49% | 0.42%(+0.071)#57 | 0.095%(+0.395)#826 |
| 58. | Milford City Balance | 0.48% | 0.42%(+0.060)#58 | 0.095%(+0.385)#847 |
| 59. | Waterbury | 0.46% | 0.42%(+0.044)#59 | 0.095%(+0.368)#873 |
| 60. | Southport | 0.46% | 0.42%(+0.043)#60 | 0.095%(+0.368)#876 |
| 61. | North Granby | 0.45% | 0.42%(+0.031)#61 | 0.095%(+0.355)#898 |
| 62. | Derby | 0.44% | 0.42%(+0.025)#62 | 0.095%(+0.350)#912 |
| 63. | Wallingford Center | 0.42% | 0.42%(+0.002)#63 | 0.095%(+0.327)#955 |
| 64. | Coleytown | 0.41% | 0.42%(-0.006)#64 | 0.095%(+0.318)#966 |
| 65. | Sacred Heart University | 0.39% | 0.42%(-0.025)#65 | 0.095%(+0.299)#1,001 |
| 66. | West Haven | 0.39% | 0.42%(-0.025)#66 | 0.095%(+0.299)#1,002 |
| 67. | Mystic | 0.38% | 0.42%(-0.034)#67 | 0.095%(+0.290)#1,028 |
| 68. | Groton | 0.38% | 0.42%(-0.035)#68 | 0.095%(+0.290)#1,030 |
| 69. | Bridgeport | 0.36% | 0.42%(-0.055)#69 | 0.095%(+0.270)#1,077 |
| 70. | Hazardville | 0.36% | 0.42%(-0.060)#70 | 0.095%(+0.265)#1,090 |
| 71. | Portland | 0.34% | 0.42%(-0.076)#71 | 0.095%(+0.248)#1,139 |
| 72. | Ansonia | 0.33% | 0.42%(-0.092)#72 | 0.095%(+0.233)#1,193 |
| 73. | Stonington Borough | 0.32% | 0.42%(-0.101)#73 | 0.095%(+0.224)#1,224 |
| 74. | Meriden | 0.31% | 0.42%(-0.106)#74 | 0.095%(+0.219)#1,243 |
| 75. | Naugatuck Borough | 0.31% | 0.42%(-0.106)#75 | 0.095%(+0.218)#1,247 |
| 76. | Danbury | 0.30% | 0.42%(-0.117)#76 | 0.095%(+0.207)#1,290 |
| 77. | Bristol | 0.26% | 0.42%(-0.157)#77 | 0.095%(+0.168)#1,445 |
| 78. | East Hartford | 0.26% | 0.42%(-0.160)#78 | 0.095%(+0.165)#1,463 |
| 79. | Noroton Heights | 0.23% | 0.42%(-0.186)#79 | 0.095%(+0.138)#1,567 |
| 80. | Somers | 0.22% | 0.42%(-0.195)#80 | 0.095%(+0.130)#1,608 |
| 81. | West Hartford | 0.22% | 0.42%(-0.199)#81 | 0.095%(+0.125)#1,629 |
| 82. | Conning Towers Nautilus Park | 0.22% | 0.42%(-0.203)#82 | 0.095%(+0.122)#1,649 |
| 83. | New London | 0.21% | 0.42%(-0.205)#83 | 0.095%(+0.119)#1,662 |
| 84. | Thompsonville | 0.21% | 0.42%(-0.209)#84 | 0.095%(+0.115)#1,686 |
| 85. | Branford Center | 0.21% | 0.42%(-0.210)#85 | 0.095%(+0.115)#1,690 |
| 86. | Hartford | 0.20% | 0.42%(-0.214)#86 | 0.095%(+0.110)#1,718 |
| 87. | New Haven | 0.20% | 0.42%(-0.220)#87 | 0.095%(+0.105)#1,753 |
| 88. | New Britain | 0.19% | 0.42%(-0.228)#88 | 0.095%(+0.097)#1,808 |
| 89. | Pawcatuck | 0.18% | 0.42%(-0.240)#89 | 0.095%(+0.085)#1,883 |
| 90. | Bethel | 0.16% | 0.42%(-0.255)#90 | 0.095%(+0.070)#1,973 |
| 91. | Windsor Locks | 0.14% | 0.42%(-0.276)#91 | 0.095%(+0.049)#2,095 |
| 92. | Noroton | 0.14% | 0.42%(-0.277)#92 | 0.095%(+0.048)#2,098 |
| 93. | Tokeneke | 0.12% | 0.42%(-0.303)#93 | 0.095%(+0.022)#2,325 |
| 94. | Winsted | 0.073% | 0.42%(-0.347)#94 | 0.095%(-0.022)#2,719 |
| 95. | Manchester | 0.070% | 0.42%(-0.349)#95 | 0.095%(-0.024)#2,752 |
| 96. | Willimantic | 0.062% | 0.42%(-0.357)#96 | 0.095%(-0.033)#2,852 |
| 97. | Norwich | 0.057% | 0.42%(-0.362)#97 | 0.095%(-0.037)#2,909 |
1
2Common Questions
What are the Top 10 Cities with the Highest Percentage of Immigrants from Italy in Connecticut?
Top 10 Cities with the Highest Percentage of Immigrants from Italy in Connecticut are:
#1
3.87%
#2
3.37%
#3
1.93%
#4
1.62%
#5
1.57%
#6
1.47%
#7
1.31%
#8
1.28%
#9
1.20%
#10
1.19%
What city has the Highest Percentage of Immigrants from Italy in Connecticut?
Oakville has the Highest Percentage of Immigrants from Italy in Connecticut with 3.87%.
What is the Percentage of Immigrants from Italy in the State of Connecticut?
Percentage of Immigrants from Italy in Connecticut is 0.42%.
What is the Percentage of Immigrants from Italy in the United States?
Percentage of Immigrants from Italy in the United States is 0.095%.