Cities with the Highest Percentage of Immigrants from South America in Oklahoma
RELATED REPORTS & OPTIONS
South America
Oklahoma
Compare Cities
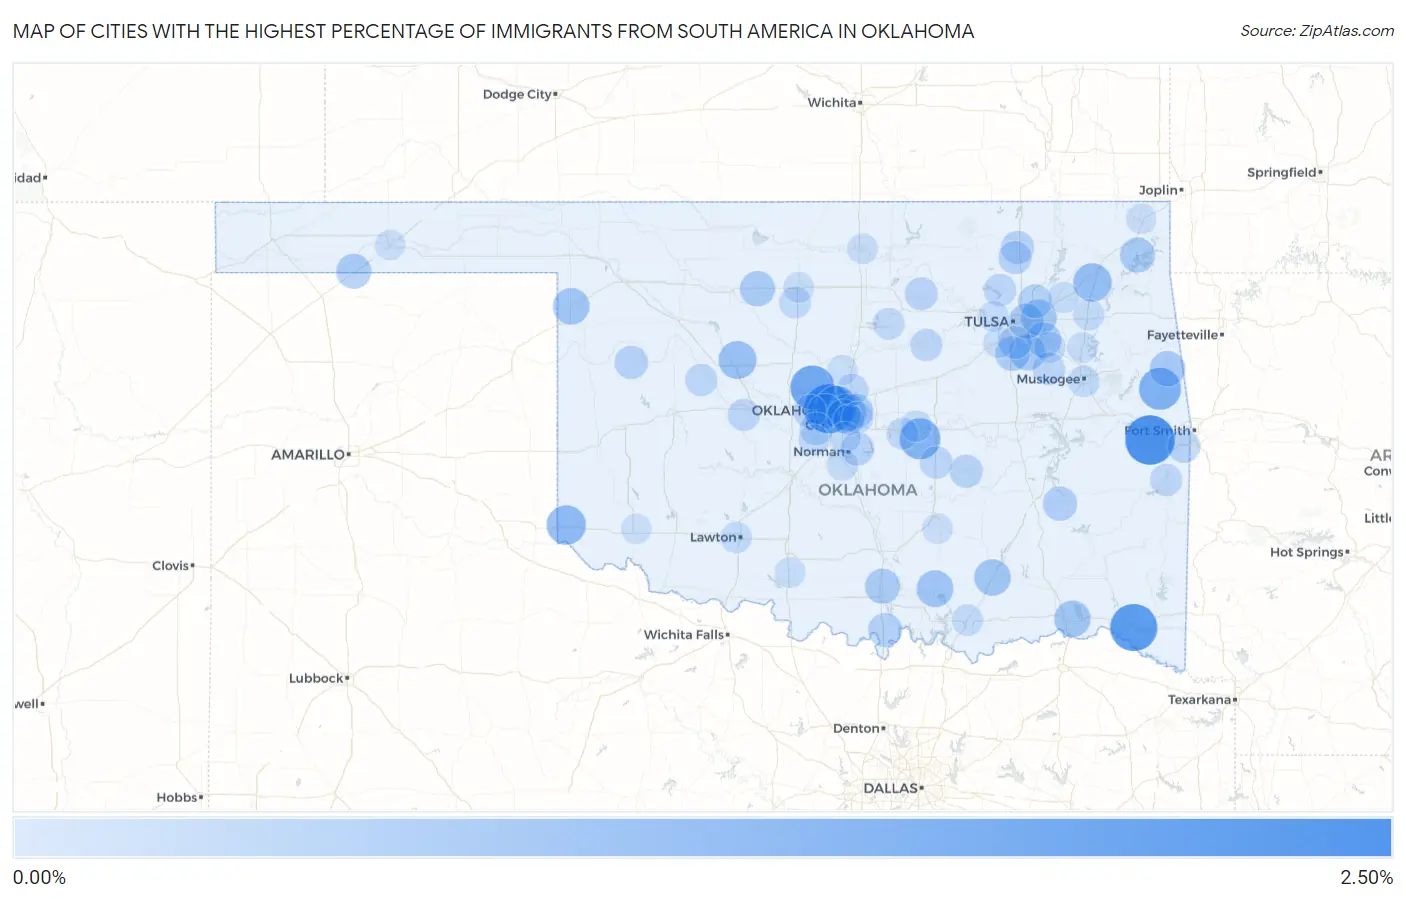
Map of Cities with the Highest Percentage of Immigrants from South America in Oklahoma
0.00%
2.50%
Cities with the Highest Percentage of Immigrants from South America in Oklahoma
| City | South America | vs State | vs National | |
| 1. | Cowlington | 2.22% | 0.24%(+1.98)#-1 | 1.10%(+1.12)#0 |
| 2. | Warr Acres | 2.16% | 0.24%(+1.92)#23 | 1.10%(+1.06)#1,345 |
| 3. | Garvin | 1.95% | 0.24%(+1.71)#112 | 1.10%(+0.850)#5,872 |
| 4. | Piedmont | 1.59% | 0.24%(+1.34)#144 | 1.10%(+0.488)#6,863 |
| 5. | Greasy | 1.33% | 0.24%(+1.09)#145 | 1.10%(+0.235)#6,864 |
| 6. | Nichols Hills | 1.22% | 0.24%(+0.978)#355 | 1.10%(+0.121)#14,130 |
| 7. | Earlsboro | 1.21% | 0.24%(+0.971)#356 | 1.10%(+0.114)#14,131 |
| 8. | Hollis | 1.03% | 0.24%(+0.790)#357 | 1.10%(-0.067)#14,132 |
| 9. | Whitehorn Cove | 0.97% | 0.24%(+0.731)#358 | 1.10%(-0.126)#14,133 |
| 10. | Adair | 0.93% | 0.24%(+0.691)#359 | 1.10%(-0.166)#14,134 |
| 11. | Watonga | 0.87% | 0.24%(+0.626)#360 | 1.10%(-0.231)#14,135 |
| 12. | Forest Park | 0.79% | 0.24%(+0.553)#361 | 1.10%(-0.304)#14,136 |
| 13. | Tishomingo | 0.74% | 0.24%(+0.498)#362 | 1.10%(-0.359)#14,137 |
| 14. | Shattuck | 0.71% | 0.24%(+0.472)#363 | 1.10%(-0.385)#14,138 |
| 15. | Tushka | 0.71% | 0.24%(+0.465)#364 | 1.10%(-0.392)#14,139 |
| 16. | Hugo | 0.70% | 0.24%(+0.454)#365 | 1.10%(-0.403)#14,140 |
| 17. | Catoosa | 0.65% | 0.24%(+0.410)#366 | 1.10%(-0.447)#14,141 |
| 18. | Bixby | 0.62% | 0.24%(+0.382)#367 | 1.10%(-0.475)#14,142 |
| 19. | Stilwell | 0.59% | 0.24%(+0.348)#368 | 1.10%(-0.509)#14,143 |
| 20. | Broken Arrow | 0.58% | 0.24%(+0.336)#369 | 1.10%(-0.521)#14,144 |
| 21. | Ringwood | 0.56% | 0.24%(+0.323)#370 | 1.10%(-0.534)#14,145 |
| 22. | Tulsa | 0.56% | 0.24%(+0.319)#371 | 1.10%(-0.538)#14,146 |
| 23. | Ardmore | 0.54% | 0.24%(+0.303)#372 | 1.10%(-0.554)#14,147 |
| 24. | Bethany | 0.54% | 0.24%(+0.302)#373 | 1.10%(-0.555)#14,148 |
| 25. | Bernice | 0.54% | 0.24%(+0.299)#374 | 1.10%(-0.558)#14,149 |
| 26. | Texhoma | 0.54% | 0.24%(+0.297)#375 | 1.10%(-0.560)#14,150 |
| 27. | Glenpool | 0.50% | 0.24%(+0.263)#376 | 1.10%(-0.594)#14,151 |
| 28. | Haileyville | 0.46% | 0.24%(+0.216)#377 | 1.10%(-0.641)#14,152 |
| 29. | Spencer | 0.45% | 0.24%(+0.212)#378 | 1.10%(-0.645)#14,153 |
| 30. | Oklahoma City | 0.44% | 0.24%(+0.197)#379 | 1.10%(-0.660)#14,154 |
| 31. | Marietta | 0.43% | 0.24%(+0.184)#380 | 1.10%(-0.673)#14,155 |
| 32. | Owasso | 0.41% | 0.24%(+0.170)#381 | 1.10%(-0.687)#14,156 |
| 33. | Leedey | 0.36% | 0.24%(+0.120)#382 | 1.10%(-0.737)#14,157 |
| 34. | Norman | 0.35% | 0.24%(+0.110)#383 | 1.10%(-0.747)#14,158 |
| 35. | Holdenville | 0.34% | 0.24%(+0.098)#384 | 1.10%(-0.759)#14,159 |
| 36. | Yukon | 0.34% | 0.24%(+0.098)#385 | 1.10%(-0.759)#14,160 |
| 37. | Jenks | 0.33% | 0.24%(+0.091)#386 | 1.10%(-0.766)#14,161 |
| 38. | Bartlesville | 0.33% | 0.24%(+0.088)#387 | 1.10%(-0.769)#14,162 |
| 39. | Ochelata | 0.33% | 0.24%(+0.086)#388 | 1.10%(-0.771)#14,163 |
| 40. | Pocola | 0.33% | 0.24%(+0.085)#389 | 1.10%(-0.772)#14,164 |
| 41. | Mustang | 0.32% | 0.24%(+0.080)#390 | 1.10%(-0.777)#14,165 |
| 42. | Pawnee | 0.31% | 0.24%(+0.070)#391 | 1.10%(-0.787)#14,166 |
| 43. | Haskell | 0.27% | 0.24%(+0.033)#392 | 1.10%(-0.824)#14,167 |
| 44. | Skiatook | 0.27% | 0.24%(+0.031)#393 | 1.10%(-0.827)#14,168 |
| 45. | Bowlegs | 0.27% | 0.24%(+0.028)#394 | 1.10%(-0.829)#14,169 |
| 46. | Thomas | 0.23% | 0.24%(-0.010)#395 | 1.10%(-0.867)#14,170 |
| 47. | Hinton | 0.23% | 0.24%(-0.013)#396 | 1.10%(-0.870)#14,171 |
| 48. | Poteau | 0.23% | 0.24%(-0.015)#397 | 1.10%(-0.872)#14,172 |
| 49. | Cushing | 0.22% | 0.24%(-0.025)#398 | 1.10%(-0.882)#14,173 |
| 50. | Edmond | 0.21% | 0.24%(-0.033)#399 | 1.10%(-0.890)#14,174 |
| 51. | Shawnee | 0.18% | 0.24%(-0.056)#400 | 1.10%(-0.914)#14,175 |
| 52. | Waukomis | 0.18% | 0.24%(-0.057)#401 | 1.10%(-0.914)#14,176 |
| 53. | Stillwater | 0.18% | 0.24%(-0.064)#402 | 1.10%(-0.921)#14,177 |
| 54. | Midwest City | 0.17% | 0.24%(-0.067)#403 | 1.10%(-0.925)#14,178 |
| 55. | Muskogee | 0.16% | 0.24%(-0.082)#404 | 1.10%(-0.939)#14,179 |
| 56. | Moore | 0.15% | 0.24%(-0.091)#405 | 1.10%(-0.948)#14,180 |
| 57. | Goldsby | 0.15% | 0.24%(-0.095)#406 | 1.10%(-0.953)#14,181 |
| 58. | Chouteau | 0.14% | 0.24%(-0.096)#407 | 1.10%(-0.953)#14,182 |
| 59. | Durant | 0.14% | 0.24%(-0.097)#408 | 1.10%(-0.954)#14,183 |
| 60. | Lawton | 0.14% | 0.24%(-0.106)#409 | 1.10%(-0.963)#14,184 |
| 61. | Johnson | 0.13% | 0.24%(-0.108)#410 | 1.10%(-0.965)#14,185 |
| 62. | Claremore | 0.11% | 0.24%(-0.130)#411 | 1.10%(-0.987)#14,186 |
| 63. | Coweta | 0.11% | 0.24%(-0.130)#412 | 1.10%(-0.987)#14,187 |
| 64. | Tuttle | 0.093% | 0.24%(-0.148)#413 | 1.10%(-1.01)#14,188 |
| 65. | Sapulpa | 0.086% | 0.24%(-0.155)#414 | 1.10%(-1.01)#14,189 |
| 66. | Del City | 0.078% | 0.24%(-0.163)#415 | 1.10%(-1.02)#14,190 |
| 67. | Wagoner | 0.077% | 0.24%(-0.164)#416 | 1.10%(-1.02)#14,191 |
| 68. | Sand Springs | 0.075% | 0.24%(-0.166)#417 | 1.10%(-1.02)#14,192 |
| 69. | Enid | 0.073% | 0.24%(-0.169)#418 | 1.10%(-1.03)#14,193 |
| 70. | Tonkawa | 0.066% | 0.24%(-0.175)#419 | 1.10%(-1.03)#14,194 |
| 71. | Comanche | 0.061% | 0.24%(-0.180)#420 | 1.10%(-1.04)#14,195 |
| 72. | Ada | 0.048% | 0.24%(-0.193)#421 | 1.10%(-1.05)#14,196 |
| 73. | Guymon | 0.047% | 0.24%(-0.194)#422 | 1.10%(-1.05)#14,197 |
| 74. | Miami | 0.031% | 0.24%(-0.210)#423 | 1.10%(-1.07)#14,198 |
| 75. | Guthrie | 0.028% | 0.24%(-0.214)#424 | 1.10%(-1.07)#14,199 |
| 76. | Altus | 0.021% | 0.24%(-0.220)#425 | 1.10%(-1.08)#14,200 |
Common Questions
What are the Top 10 Cities with the Highest Percentage of Immigrants from South America in Oklahoma?
Top 10 Cities with the Highest Percentage of Immigrants from South America in Oklahoma are:
#1
2.22%
#2
2.16%
#3
1.95%
#4
1.59%
#5
1.33%
#6
1.22%
#7
1.21%
#8
1.03%
#9
0.93%
#10
0.87%
What city has the Highest Percentage of Immigrants from South America in Oklahoma?
Cowlington has the Highest Percentage of Immigrants from South America in Oklahoma with 2.22%.
What is the Percentage of Immigrants from South America in the State of Oklahoma?
Percentage of Immigrants from South America in Oklahoma is 0.24%.
What is the Percentage of Immigrants from South America in the United States?
Percentage of Immigrants from South America in the United States is 1.10%.