Cities with the Highest Percentage of Immigrants from South America in Indiana
RELATED REPORTS & OPTIONS
South America
Indiana
Compare Cities
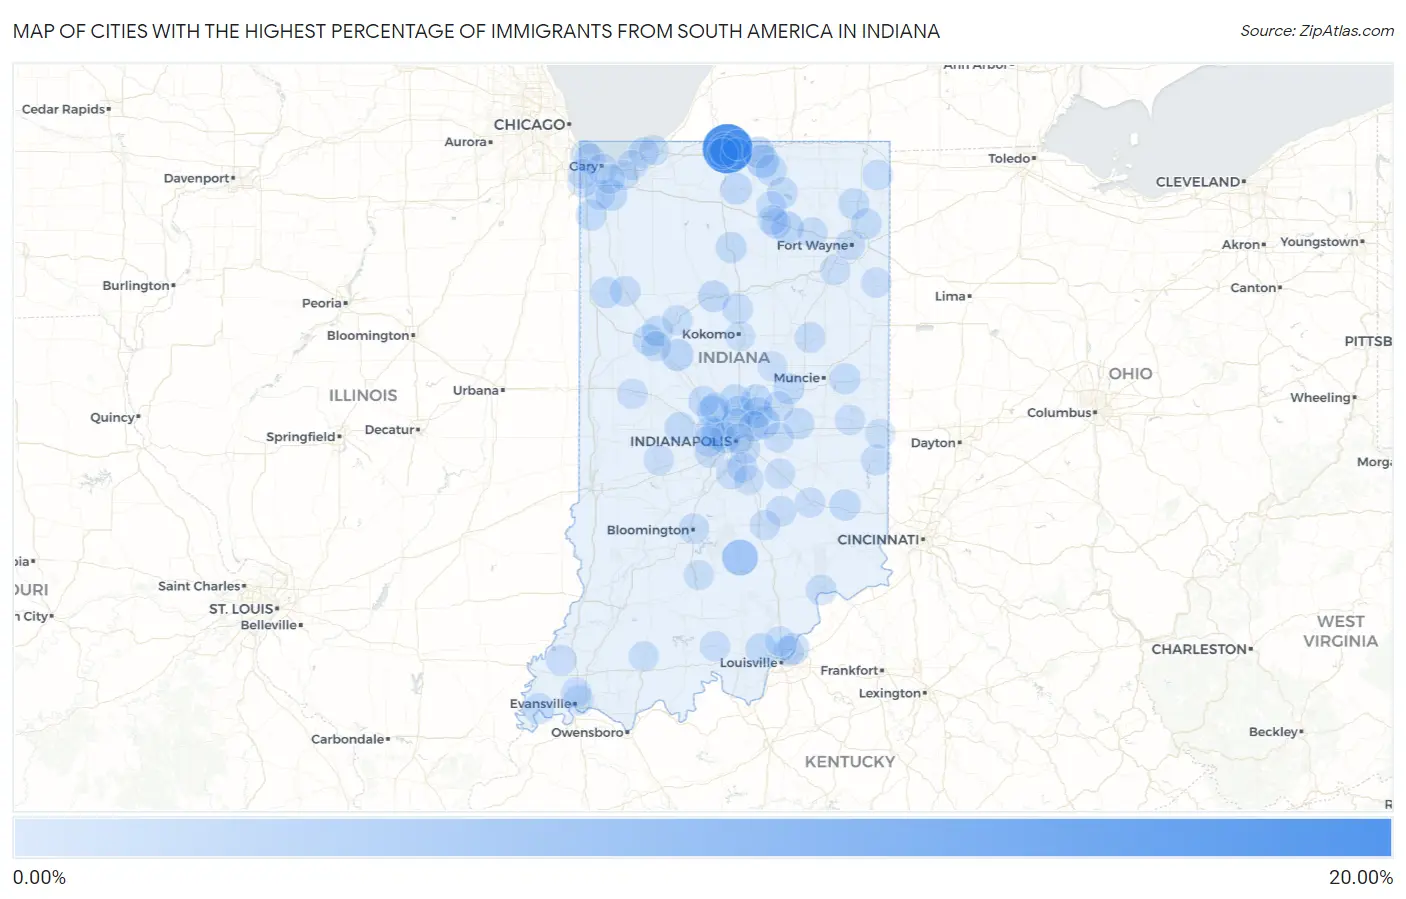
Map of Cities with the Highest Percentage of Immigrants from South America in Indiana
0.00%
20.00%
Cities with the Highest Percentage of Immigrants from South America in Indiana
| City | South America | vs State | vs National | |
| 1. | Indian Village | 16.54% | 0.25%(+16.3)#-1 | 1.10%(+15.4)#0 |
| 2. | Freetown | 4.84% | 0.25%(+4.58)#0 | 1.10%(+3.74)#1 |
| 3. | Dunlap | 2.43% | 0.25%(+2.17)#65 | 1.10%(+1.33)#4,794 |
| 4. | Roseland | 2.39% | 0.25%(+2.14)#192 | 1.10%(+1.29)#10,191 |
| 5. | Mccordsville | 1.93% | 0.25%(+1.68)#270 | 1.10%(+0.836)#12,554 |
| 6. | Notre Dame | 1.77% | 0.25%(+1.52)#271 | 1.10%(+0.677)#12,555 |
| 7. | Mulberry | 1.72% | 0.25%(+1.46)#298 | 1.10%(+0.618)#13,585 |
| 8. | Pierceton | 1.71% | 0.25%(+1.46)#299 | 1.10%(+0.613)#13,586 |
| 9. | Bremen | 1.48% | 0.25%(+1.22)#300 | 1.10%(+0.380)#13,587 |
| 10. | Clermont | 1.42% | 0.25%(+1.16)#301 | 1.10%(+0.318)#13,588 |
| 11. | Logansport | 1.29% | 0.25%(+1.04)#302 | 1.10%(+0.195)#13,589 |
| 12. | Gilmer Park | 1.29% | 0.25%(+1.03)#303 | 1.10%(+0.187)#13,590 |
| 13. | Winfield | 1.27% | 0.25%(+1.02)#304 | 1.10%(+0.176)#13,591 |
| 14. | Elkhart | 1.26% | 0.25%(+1.00)#305 | 1.10%(+0.159)#13,592 |
| 15. | West Lafayette | 1.23% | 0.25%(+0.976)#306 | 1.10%(+0.132)#13,593 |
| 16. | Liberty Center | 1.20% | 0.25%(+0.950)#307 | 1.10%(+0.107)#13,594 |
| 17. | Utica | 1.18% | 0.25%(+0.926)#308 | 1.10%(+0.082)#13,595 |
| 18. | Galena | 1.18% | 0.25%(+0.925)#309 | 1.10%(+0.081)#13,596 |
| 19. | Westfield | 1.11% | 0.25%(+0.860)#310 | 1.10%(+0.016)#13,597 |
| 20. | Carmel | 1.04% | 0.25%(+0.781)#311 | 1.10%(-0.063)#13,598 |
| 21. | Noblesville | 1.02% | 0.25%(+0.767)#312 | 1.10%(-0.076)#13,599 |
| 22. | Whitestown | 1.01% | 0.25%(+0.760)#313 | 1.10%(-0.084)#13,600 |
| 23. | Goodland | 1.01% | 0.25%(+0.754)#314 | 1.10%(-0.089)#13,601 |
| 24. | Rochester | 0.99% | 0.25%(+0.740)#315 | 1.10%(-0.104)#13,602 |
| 25. | Oldenburg | 0.97% | 0.25%(+0.714)#316 | 1.10%(-0.130)#13,603 |
| 26. | Garrett | 0.96% | 0.25%(+0.709)#317 | 1.10%(-0.135)#13,604 |
| 27. | Mount Vernon | 0.96% | 0.25%(+0.702)#318 | 1.10%(-0.141)#13,605 |
| 28. | Goshen | 0.96% | 0.25%(+0.702)#319 | 1.10%(-0.142)#13,606 |
| 29. | Leo Cedarville | 0.93% | 0.25%(+0.677)#320 | 1.10%(-0.167)#13,607 |
| 30. | Parker City | 0.93% | 0.25%(+0.672)#321 | 1.10%(-0.172)#13,608 |
| 31. | North Salem | 0.92% | 0.25%(+0.668)#322 | 1.10%(-0.176)#13,609 |
| 32. | Wilkinson | 0.92% | 0.25%(+0.663)#323 | 1.10%(-0.181)#13,610 |
| 33. | Syracuse | 0.91% | 0.25%(+0.654)#324 | 1.10%(-0.189)#13,611 |
| 34. | Mishawaka | 0.91% | 0.25%(+0.653)#325 | 1.10%(-0.191)#13,612 |
| 35. | Woodlawn Heights | 0.88% | 0.25%(+0.630)#326 | 1.10%(-0.213)#13,613 |
| 36. | Speedway | 0.88% | 0.25%(+0.625)#327 | 1.10%(-0.219)#13,614 |
| 37. | South Bend | 0.80% | 0.25%(+0.543)#328 | 1.10%(-0.301)#13,615 |
| 38. | Fishers | 0.77% | 0.25%(+0.519)#329 | 1.10%(-0.325)#13,616 |
| 39. | Battle Ground | 0.77% | 0.25%(+0.517)#330 | 1.10%(-0.326)#13,932 |
| 40. | Lebanon | 0.76% | 0.25%(+0.504)#331 | 1.10%(-0.340)#13,933 |
| 41. | Lowell | 0.73% | 0.25%(+0.473)#332 | 1.10%(-0.371)#13,934 |
| 42. | Upland | 0.68% | 0.25%(+0.427)#333 | 1.10%(-0.417)#13,935 |
| 43. | Liberty | 0.67% | 0.25%(+0.417)#334 | 1.10%(-0.427)#13,936 |
| 44. | Grissom Afb | 0.65% | 0.25%(+0.394)#335 | 1.10%(-0.449)#13,937 |
| 45. | Meridian Hills | 0.63% | 0.25%(+0.376)#336 | 1.10%(-0.468)#13,938 |
| 46. | Beverly Shores | 0.52% | 0.25%(+0.264)#337 | 1.10%(-0.579)#13,939 |
| 47. | Avon | 0.50% | 0.25%(+0.246)#338 | 1.10%(-0.598)#13,940 |
| 48. | Bargersville | 0.49% | 0.25%(+0.239)#339 | 1.10%(-0.605)#13,941 |
| 49. | Hope | 0.47% | 0.25%(+0.219)#340 | 1.10%(-0.625)#13,942 |
| 50. | Remington | 0.47% | 0.25%(+0.216)#341 | 1.10%(-0.627)#13,943 |
| 51. | Bloomington | 0.47% | 0.25%(+0.216)#342 | 1.10%(-0.627)#13,944 |
| 52. | Madison | 0.46% | 0.25%(+0.209)#343 | 1.10%(-0.635)#13,945 |
| 53. | Columbia City | 0.44% | 0.25%(+0.189)#344 | 1.10%(-0.655)#13,946 |
| 54. | Beech Grove | 0.43% | 0.25%(+0.174)#345 | 1.10%(-0.670)#13,947 |
| 55. | Hamilton | 0.41% | 0.25%(+0.159)#346 | 1.10%(-0.685)#13,948 |
| 56. | Lawrence | 0.40% | 0.25%(+0.148)#347 | 1.10%(-0.696)#13,949 |
| 57. | Indianapolis | 0.39% | 0.25%(+0.135)#348 | 1.10%(-0.709)#13,950 |
| 58. | Waynetown | 0.39% | 0.25%(+0.131)#349 | 1.10%(-0.713)#13,951 |
| 59. | Brownsburg | 0.38% | 0.25%(+0.130)#350 | 1.10%(-0.714)#13,952 |
| 60. | Marengo | 0.38% | 0.25%(+0.122)#351 | 1.10%(-0.722)#13,953 |
| 61. | Greencastle | 0.38% | 0.25%(+0.120)#352 | 1.10%(-0.723)#13,954 |
| 62. | Plainfield | 0.36% | 0.25%(+0.105)#353 | 1.10%(-0.739)#13,955 |
| 63. | Owensville | 0.35% | 0.25%(+0.098)#354 | 1.10%(-0.746)#13,956 |
| 64. | Shelbyville | 0.35% | 0.25%(+0.091)#355 | 1.10%(-0.753)#13,957 |
| 65. | Winona Lake | 0.33% | 0.25%(+0.080)#356 | 1.10%(-0.763)#13,958 |
| 66. | Decatur | 0.32% | 0.25%(+0.064)#357 | 1.10%(-0.779)#13,959 |
| 67. | Columbus | 0.31% | 0.25%(+0.058)#358 | 1.10%(-0.786)#13,960 |
| 68. | Evansville | 0.30% | 0.25%(+0.045)#359 | 1.10%(-0.799)#13,961 |
| 69. | Highland | 0.27% | 0.25%(+0.014)#360 | 1.10%(-0.830)#13,962 |
| 70. | Pendleton | 0.24% | 0.25%(-0.012)#361 | 1.10%(-0.855)#13,963 |
| 71. | Greenwood | 0.24% | 0.25%(-0.019)#362 | 1.10%(-0.862)#13,964 |
| 72. | Delphi | 0.23% | 0.25%(-0.020)#363 | 1.10%(-0.864)#13,965 |
| 73. | Lafayette | 0.23% | 0.25%(-0.022)#364 | 1.10%(-0.865)#13,966 |
| 74. | Jeffersonville | 0.22% | 0.25%(-0.036)#365 | 1.10%(-0.879)#13,967 |
| 75. | Huntingburg | 0.22% | 0.25%(-0.039)#366 | 1.10%(-0.882)#13,968 |
| 76. | Leesburg | 0.21% | 0.25%(-0.042)#367 | 1.10%(-0.886)#13,969 |
| 77. | Hagerstown | 0.21% | 0.25%(-0.048)#368 | 1.10%(-0.891)#13,970 |
| 78. | East Chicago | 0.20% | 0.25%(-0.050)#369 | 1.10%(-0.893)#13,971 |
| 79. | Warsaw | 0.19% | 0.25%(-0.060)#370 | 1.10%(-0.904)#13,972 |
| 80. | Zanesville | 0.19% | 0.25%(-0.066)#371 | 1.10%(-0.910)#13,973 |
| 81. | Bedford | 0.18% | 0.25%(-0.073)#372 | 1.10%(-0.917)#13,974 |
| 82. | Fort Wayne | 0.16% | 0.25%(-0.092)#373 | 1.10%(-0.936)#13,975 |
| 83. | Greenfield | 0.16% | 0.25%(-0.094)#374 | 1.10%(-0.938)#13,976 |
| 84. | Greensburg | 0.16% | 0.25%(-0.097)#375 | 1.10%(-0.941)#13,977 |
| 85. | Chesterton | 0.16% | 0.25%(-0.100)#376 | 1.10%(-0.943)#13,978 |
| 86. | South Haven | 0.15% | 0.25%(-0.103)#377 | 1.10%(-0.946)#13,979 |
| 87. | Granger | 0.15% | 0.25%(-0.108)#378 | 1.10%(-0.952)#13,980 |
| 88. | Crown Point | 0.14% | 0.25%(-0.115)#379 | 1.10%(-0.959)#13,981 |
| 89. | Michigan City | 0.13% | 0.25%(-0.123)#380 | 1.10%(-0.967)#13,982 |
| 90. | Sellersburg | 0.12% | 0.25%(-0.134)#381 | 1.10%(-0.978)#13,983 |
| 91. | Kokomo | 0.11% | 0.25%(-0.140)#382 | 1.10%(-0.984)#13,984 |
| 92. | Richmond | 0.11% | 0.25%(-0.142)#383 | 1.10%(-0.986)#13,985 |
| 93. | Whiting | 0.11% | 0.25%(-0.145)#384 | 1.10%(-0.989)#13,986 |
| 94. | Gary | 0.11% | 0.25%(-0.148)#385 | 1.10%(-0.991)#13,987 |
| 95. | Dyer | 0.10% | 0.25%(-0.151)#386 | 1.10%(-0.995)#13,988 |
| 96. | Franklin | 0.100% | 0.25%(-0.155)#387 | 1.10%(-0.999)#13,989 |
| 97. | Elwood | 0.096% | 0.25%(-0.159)#388 | 1.10%(-1.00)#13,990 |
| 98. | Munster | 0.093% | 0.25%(-0.162)#389 | 1.10%(-1.01)#13,991 |
| 99. | Hobart | 0.088% | 0.25%(-0.167)#390 | 1.10%(-1.01)#13,992 |
| 100. | Zionsville | 0.088% | 0.25%(-0.167)#391 | 1.10%(-1.01)#13,993 |
Common Questions
What are the Top 10 Cities with the Highest Percentage of Immigrants from South America in Indiana?
Top 10 Cities with the Highest Percentage of Immigrants from South America in Indiana are:
#1
16.54%
#2
4.84%
#3
2.43%
#4
2.39%
#5
1.93%
#6
1.77%
#7
1.72%
#8
1.71%
#9
1.48%
#10
1.42%
What city has the Highest Percentage of Immigrants from South America in Indiana?
Indian Village has the Highest Percentage of Immigrants from South America in Indiana with 16.54%.
What is the Percentage of Immigrants from South America in the State of Indiana?
Percentage of Immigrants from South America in Indiana is 0.25%.
What is the Percentage of Immigrants from South America in the United States?
Percentage of Immigrants from South America in the United States is 1.10%.