Cities with the Highest Percentage of Immigrants from South America in Tennessee
RELATED REPORTS & OPTIONS
South America
Tennessee
Compare Cities
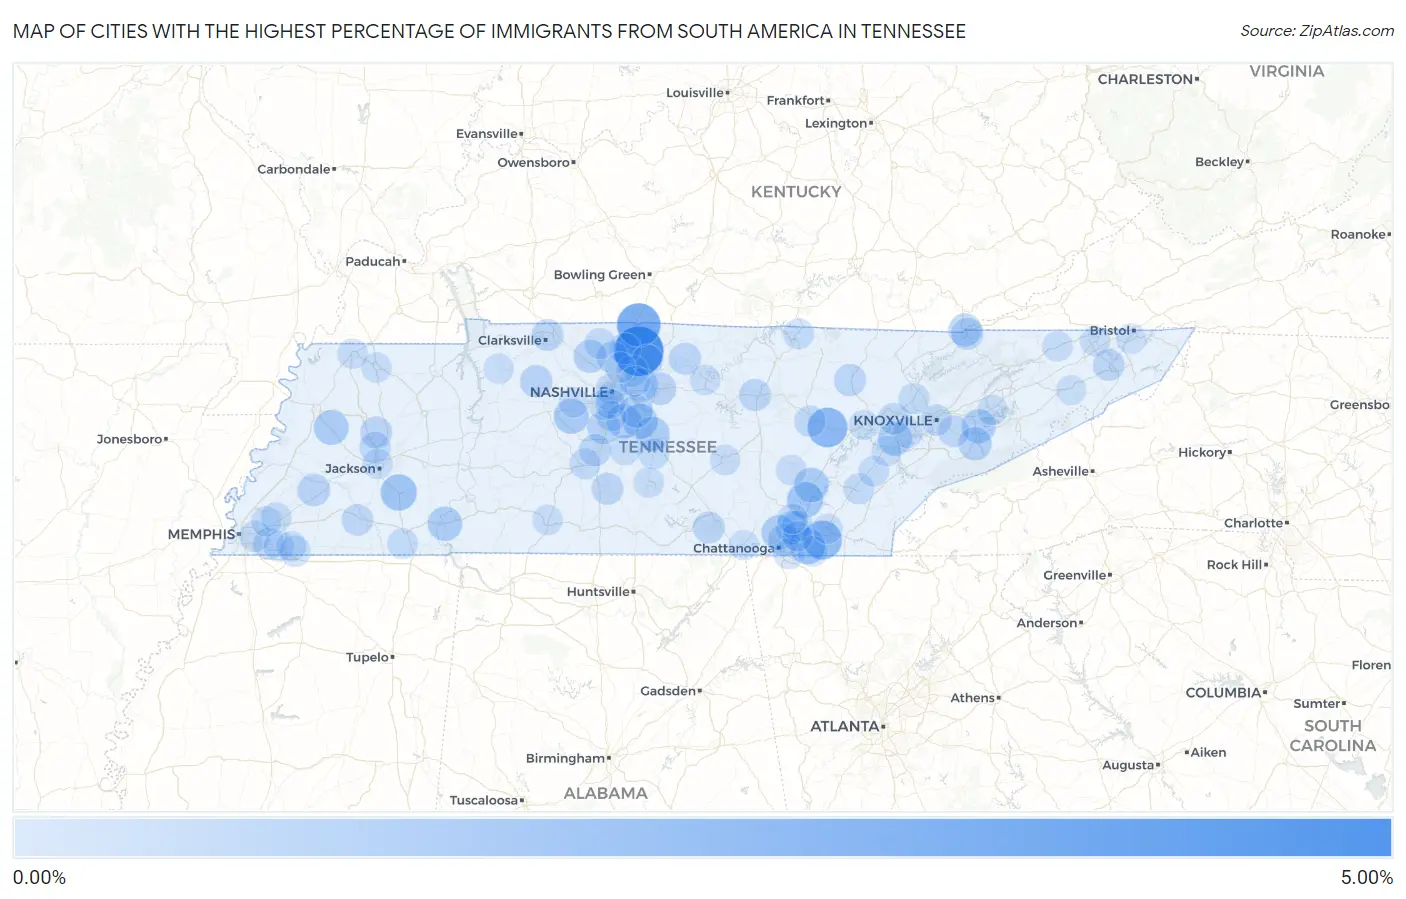
Map of Cities with the Highest Percentage of Immigrants from South America in Tennessee
0.00%
5.00%
Cities with the Highest Percentage of Immigrants from South America in Tennessee
| City | South America | vs State | vs National | |
| 1. | Cottontown | 4.93% | 0.28%(+4.65)#-1 | 1.10%(+3.83)#0 |
| 2. | Mitchellville | 3.38% | 0.28%(+3.10)#117 | 1.10%(+2.28)#8,182 |
| 3. | Crab Orchard | 2.42% | 0.28%(+2.14)#180 | 1.10%(+1.32)#11,019 |
| 4. | South Cleveland | 2.23% | 0.28%(+1.95)#214 | 1.10%(+1.13)#13,231 |
| 5. | Henderson | 1.58% | 0.28%(+1.30)#215 | 1.10%(+0.482)#13,232 |
| 6. | Sale Creek | 1.50% | 0.28%(+1.22)#216 | 1.10%(+0.403)#13,233 |
| 7. | Collegedale | 1.47% | 0.28%(+1.19)#217 | 1.10%(+0.374)#13,234 |
| 8. | Kahite | 1.32% | 0.28%(+1.04)#218 | 1.10%(+0.225)#13,235 |
| 9. | Fairview | 1.27% | 0.28%(+0.993)#219 | 1.10%(+0.173)#13,236 |
| 10. | Smyrna | 1.24% | 0.28%(+0.962)#220 | 1.10%(+0.142)#13,237 |
| 11. | Dayton | 1.19% | 0.28%(+0.912)#221 | 1.10%(+0.092)#13,238 |
| 12. | Friendship | 1.19% | 0.28%(+0.912)#222 | 1.10%(+0.092)#13,239 |
| 13. | Walden | 1.17% | 0.28%(+0.887)#223 | 1.10%(+0.067)#13,240 |
| 14. | Savannah | 1.11% | 0.28%(+0.832)#224 | 1.10%(+0.012)#13,241 |
| 15. | Nolensville | 1.09% | 0.28%(+0.816)#225 | 1.10%(-0.004)#13,242 |
| 16. | Murfreesboro | 1.07% | 0.28%(+0.793)#226 | 1.10%(-0.027)#13,243 |
| 17. | Sevierville | 1.05% | 0.28%(+0.772)#227 | 1.10%(-0.047)#13,244 |
| 18. | Lenoir City | 1.04% | 0.28%(+0.761)#228 | 1.10%(-0.059)#13,245 |
| 19. | Middle Valley | 0.91% | 0.28%(+0.634)#229 | 1.10%(-0.186)#13,246 |
| 20. | Mount Juliet | 0.88% | 0.28%(+0.600)#230 | 1.10%(-0.220)#13,247 |
| 21. | Franklin | 0.84% | 0.28%(+0.563)#231 | 1.10%(-0.256)#13,248 |
| 22. | Pigeon Forge | 0.84% | 0.28%(+0.557)#232 | 1.10%(-0.263)#13,249 |
| 23. | Coopertown | 0.82% | 0.28%(+0.537)#233 | 1.10%(-0.283)#13,250 |
| 24. | Cumberland Gap | 0.80% | 0.28%(+0.520)#234 | 1.10%(-0.300)#13,251 |
| 25. | La Vergne | 0.77% | 0.28%(+0.489)#235 | 1.10%(-0.331)#13,252 |
| 26. | Stanton | 0.68% | 0.28%(+0.404)#236 | 1.10%(-0.416)#13,253 |
| 27. | Lebanon | 0.66% | 0.28%(+0.386)#237 | 1.10%(-0.433)#13,254 |
| 28. | Vanleer | 0.66% | 0.28%(+0.383)#238 | 1.10%(-0.437)#13,255 |
| 29. | Sunbright | 0.57% | 0.28%(+0.290)#239 | 1.10%(-0.530)#13,256 |
| 30. | Cookeville | 0.55% | 0.28%(+0.274)#240 | 1.10%(-0.546)#13,257 |
| 31. | Ridgetop | 0.55% | 0.28%(+0.269)#241 | 1.10%(-0.551)#13,258 |
| 32. | Gibson | 0.54% | 0.28%(+0.264)#242 | 1.10%(-0.556)#13,259 |
| 33. | Berry Hill | 0.54% | 0.28%(+0.258)#243 | 1.10%(-0.562)#13,868 |
| 34. | Hartsville Trousdale County | 0.53% | 0.28%(+0.256)#244 | 1.10%(-0.564)#13,869 |
| 35. | Harrogate | 0.53% | 0.28%(+0.248)#245 | 1.10%(-0.572)#13,958 |
| 36. | Chattanooga | 0.52% | 0.28%(+0.242)#246 | 1.10%(-0.578)#13,959 |
| 37. | Spring Hill | 0.52% | 0.28%(+0.240)#247 | 1.10%(-0.580)#13,960 |
| 38. | Sewanee | 0.51% | 0.28%(+0.235)#248 | 1.10%(-0.585)#13,961 |
| 39. | Hendersonville | 0.51% | 0.28%(+0.235)#249 | 1.10%(-0.585)#13,962 |
| 40. | Lewisburg | 0.51% | 0.28%(+0.231)#250 | 1.10%(-0.589)#13,963 |
| 41. | Clarksville | 0.47% | 0.28%(+0.189)#251 | 1.10%(-0.631)#13,964 |
| 42. | Johnson City | 0.46% | 0.28%(+0.181)#252 | 1.10%(-0.639)#13,965 |
| 43. | Bolivar | 0.44% | 0.28%(+0.164)#253 | 1.10%(-0.656)#13,966 |
| 44. | Oak Ridge | 0.43% | 0.28%(+0.156)#254 | 1.10%(-0.664)#13,967 |
| 45. | Germantown | 0.40% | 0.28%(+0.121)#255 | 1.10%(-0.699)#13,968 |
| 46. | Three Way | 0.40% | 0.28%(+0.121)#256 | 1.10%(-0.699)#13,969 |
| 47. | Seymour | 0.40% | 0.28%(+0.120)#257 | 1.10%(-0.700)#13,970 |
| 48. | Lakesite | 0.39% | 0.28%(+0.111)#258 | 1.10%(-0.709)#13,971 |
| 49. | Crossville | 0.38% | 0.28%(+0.102)#259 | 1.10%(-0.718)#13,972 |
| 50. | Knoxville | 0.38% | 0.28%(+0.099)#260 | 1.10%(-0.721)#13,973 |
| 51. | White House | 0.38% | 0.28%(+0.097)#261 | 1.10%(-0.722)#13,974 |
| 52. | Memphis | 0.37% | 0.28%(+0.087)#262 | 1.10%(-0.733)#13,975 |
| 53. | Rossville | 0.34% | 0.28%(+0.059)#263 | 1.10%(-0.761)#13,976 |
| 54. | Columbia | 0.33% | 0.28%(+0.056)#264 | 1.10%(-0.764)#13,977 |
| 55. | Gallatin | 0.33% | 0.28%(+0.051)#265 | 1.10%(-0.769)#13,978 |
| 56. | Clinton | 0.33% | 0.28%(+0.050)#266 | 1.10%(-0.770)#13,979 |
| 57. | Nashville | 0.32% | 0.28%(+0.046)#267 | 1.10%(-0.774)#13,980 |
| 58. | Springfield | 0.32% | 0.28%(+0.041)#268 | 1.10%(-0.779)#13,981 |
| 59. | Athens | 0.32% | 0.28%(+0.041)#269 | 1.10%(-0.779)#13,982 |
| 60. | Christiana | 0.32% | 0.28%(+0.037)#270 | 1.10%(-0.783)#13,983 |
| 61. | Walnut Grove Cdp Sumner County | 0.30% | 0.28%(+0.025)#271 | 1.10%(-0.795)#13,984 |
| 62. | Ramer | 0.26% | 0.28%(-0.019)#272 | 1.10%(-0.839)#13,985 |
| 63. | East Ridge | 0.25% | 0.28%(-0.024)#273 | 1.10%(-0.844)#13,986 |
| 64. | Green Hill | 0.25% | 0.28%(-0.027)#274 | 1.10%(-0.847)#13,987 |
| 65. | Sweetwater | 0.24% | 0.28%(-0.041)#275 | 1.10%(-0.861)#13,988 |
| 66. | Byrdstown | 0.24% | 0.28%(-0.043)#276 | 1.10%(-0.863)#13,989 |
| 67. | Powell | 0.22% | 0.28%(-0.057)#277 | 1.10%(-0.877)#13,990 |
| 68. | Lakeland | 0.21% | 0.28%(-0.068)#278 | 1.10%(-0.888)#13,991 |
| 69. | Biltmore | 0.21% | 0.28%(-0.070)#279 | 1.10%(-0.890)#13,992 |
| 70. | Goodlettsville | 0.21% | 0.28%(-0.073)#280 | 1.10%(-0.893)#13,993 |
| 71. | Eagleville | 0.20% | 0.28%(-0.075)#281 | 1.10%(-0.895)#13,994 |
| 72. | Lawrenceburg | 0.20% | 0.28%(-0.080)#282 | 1.10%(-0.900)#13,995 |
| 73. | Pikeville | 0.20% | 0.28%(-0.082)#283 | 1.10%(-0.902)#13,996 |
| 74. | Farragut | 0.19% | 0.28%(-0.085)#284 | 1.10%(-0.905)#13,997 |
| 75. | Apison | 0.19% | 0.28%(-0.088)#285 | 1.10%(-0.908)#13,998 |
| 76. | Mcminnville | 0.19% | 0.28%(-0.089)#286 | 1.10%(-0.909)#13,999 |
| 77. | Collierville | 0.18% | 0.28%(-0.095)#287 | 1.10%(-0.915)#14,000 |
| 78. | South Carthage | 0.18% | 0.28%(-0.102)#288 | 1.10%(-0.922)#14,001 |
| 79. | Bartlett | 0.17% | 0.28%(-0.104)#289 | 1.10%(-0.924)#14,002 |
| 80. | Surgoinsville | 0.17% | 0.28%(-0.106)#290 | 1.10%(-0.926)#14,003 |
| 81. | Brentwood | 0.17% | 0.28%(-0.109)#291 | 1.10%(-0.929)#14,004 |
| 82. | Harrison | 0.17% | 0.28%(-0.110)#292 | 1.10%(-0.930)#14,005 |
| 83. | Soddy Daisy | 0.17% | 0.28%(-0.110)#293 | 1.10%(-0.930)#14,006 |
| 84. | Shelbyville | 0.16% | 0.28%(-0.114)#294 | 1.10%(-0.934)#14,007 |
| 85. | Union City | 0.15% | 0.28%(-0.125)#295 | 1.10%(-0.945)#14,008 |
| 86. | Dandridge | 0.15% | 0.28%(-0.129)#296 | 1.10%(-0.949)#14,009 |
| 87. | Martin | 0.15% | 0.28%(-0.130)#297 | 1.10%(-0.950)#14,010 |
| 88. | Jackson | 0.15% | 0.28%(-0.131)#298 | 1.10%(-0.951)#14,011 |
| 89. | Cleveland | 0.14% | 0.28%(-0.134)#299 | 1.10%(-0.954)#14,012 |
| 90. | Tennessee Ridge | 0.14% | 0.28%(-0.135)#300 | 1.10%(-0.955)#14,013 |
| 91. | Forest Hills | 0.14% | 0.28%(-0.136)#301 | 1.10%(-0.956)#14,014 |
| 92. | Kingsport | 0.13% | 0.28%(-0.148)#302 | 1.10%(-0.968)#14,015 |
| 93. | Piperton | 0.13% | 0.28%(-0.151)#303 | 1.10%(-0.971)#14,016 |
| 94. | Oak Hill | 0.13% | 0.28%(-0.152)#304 | 1.10%(-0.972)#14,090 |
| 95. | Bristol | 0.12% | 0.28%(-0.161)#305 | 1.10%(-0.981)#14,091 |
| 96. | Harriman | 0.12% | 0.28%(-0.162)#306 | 1.10%(-0.982)#14,092 |
| 97. | Loudon | 0.12% | 0.28%(-0.163)#307 | 1.10%(-0.983)#14,093 |
| 98. | Jasper | 0.11% | 0.28%(-0.167)#308 | 1.10%(-0.987)#14,094 |
| 99. | Kingston Springs | 0.11% | 0.28%(-0.171)#309 | 1.10%(-0.991)#14,095 |
| 100. | Tusculum | 0.092% | 0.28%(-0.186)#310 | 1.10%(-1.01)#14,096 |
Common Questions
What are the Top 10 Cities with the Highest Percentage of Immigrants from South America in Tennessee?
Top 10 Cities with the Highest Percentage of Immigrants from South America in Tennessee are:
#1
4.93%
#2
3.38%
#3
2.42%
#4
2.23%
#5
1.58%
#6
1.50%
#7
1.47%
#8
1.27%
#9
1.24%
#10
1.19%
What city has the Highest Percentage of Immigrants from South America in Tennessee?
Cottontown has the Highest Percentage of Immigrants from South America in Tennessee with 4.93%.
What is the Percentage of Immigrants from South America in the State of Tennessee?
Percentage of Immigrants from South America in Tennessee is 0.28%.
What is the Percentage of Immigrants from South America in the United States?
Percentage of Immigrants from South America in the United States is 1.10%.