South Lancaster, MA
South Lancaster Map
South Lancaster Overview
1,642
TOTAL POPULATION
701
MALE POPULATION
941
FEMALE POPULATION
74.50
MALES / 100 FEMALES
134.24
FEMALES / 100 MALES
39.0
MEDIAN AGE
3.3
AVG FAMILY SIZE
2.2
AVG HOUSEHOLD SIZE
$45,354
PER CAPITA INCOME
$109,667
AVG FAMILY INCOME
$101,250
AVG HOUSEHOLD INCOME
6.0%
WAGE / INCOME GAP [ % ]
94.0¢/ $1
WAGE / INCOME GAP [ $ ]
0.34
INEQUALITY / GINI INDEX
931
LABOR FORCE [ PEOPLE ]
69.6%
PERCENT IN LABOR FORCE
19.0%
UNEMPLOYMENT RATE
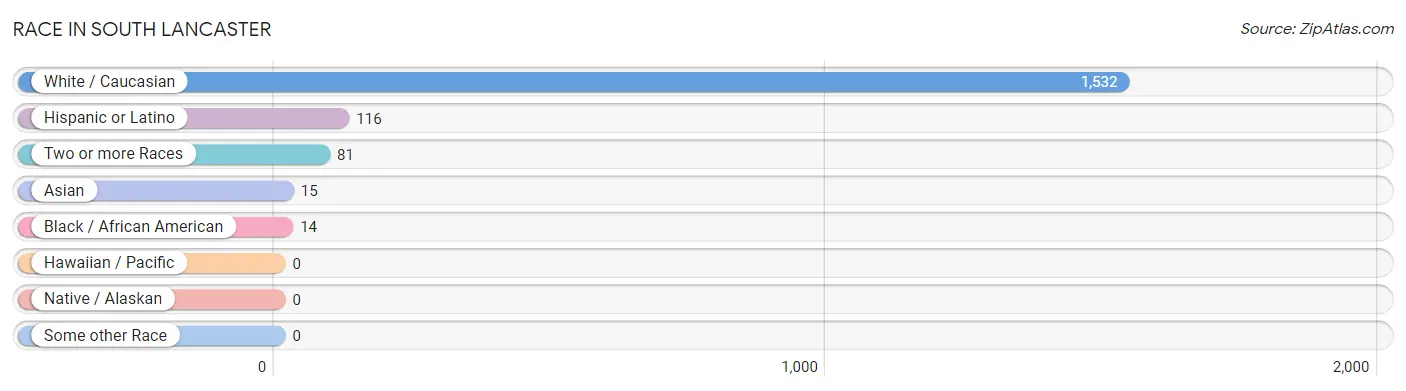
Race in South Lancaster
The most populous races in South Lancaster are White / Caucasian (1,532 | 93.3%), Hispanic or Latino (116 | 7.1%), and Two or more Races (81 | 4.9%).
| Race | # Population | % Population |
| Asian | 15 | 0.9% |
| Black / African American | 14 | 0.9% |
| Hawaiian / Pacific | 0 | 0.0% |
| Hispanic or Latino | 116 | 7.1% |
| Native / Alaskan | 0 | 0.0% |
| White / Caucasian | 1,532 | 93.3% |
| Two or more Races | 81 | 4.9% |
| Some other Race | 0 | 0.0% |
| Total | 1,642 | 100.0% |
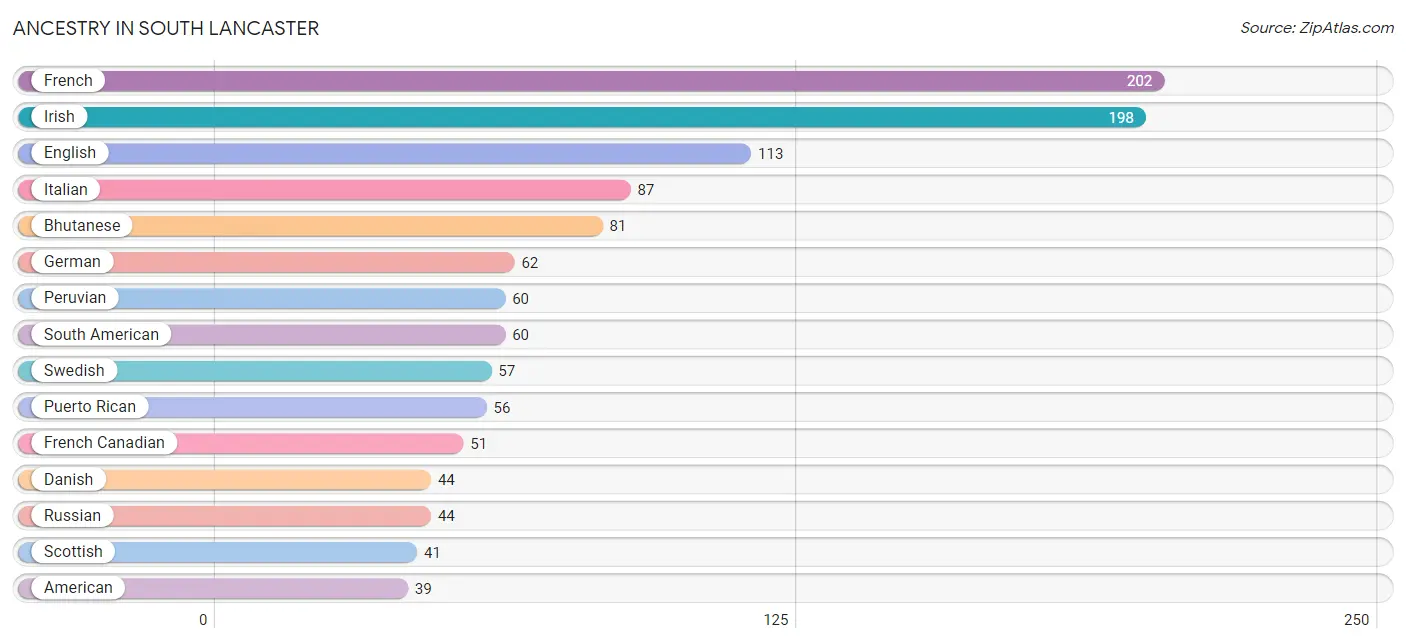
Ancestry in South Lancaster
The most populous ancestries reported in South Lancaster are French (202 | 12.3%), Irish (198 | 12.1%), English (113 | 6.9%), Italian (87 | 5.3%), and Bhutanese (81 | 4.9%), together accounting for 41.5% of all South Lancaster residents.
| Ancestry | # Population | % Population |
| American | 39 | 2.4% |
| Bhutanese | 81 | 4.9% |
| Danish | 44 | 2.7% |
| English | 113 | 6.9% |
| Finnish | 24 | 1.5% |
| French | 202 | 12.3% |
| French Canadian | 51 | 3.1% |
| German | 62 | 3.8% |
| Irish | 198 | 12.1% |
| Italian | 87 | 5.3% |
| Korean | 15 | 0.9% |
| Peruvian | 60 | 3.6% |
| Polish | 35 | 2.1% |
| Portuguese | 14 | 0.9% |
| Puerto Rican | 56 | 3.4% |
| Russian | 44 | 2.7% |
| Scandinavian | 16 | 1.0% |
| Scotch-Irish | 38 | 2.3% |
| Scottish | 41 | 2.5% |
| South American | 60 | 3.6% |
| Swedish | 57 | 3.5% | View All 21 Rows |
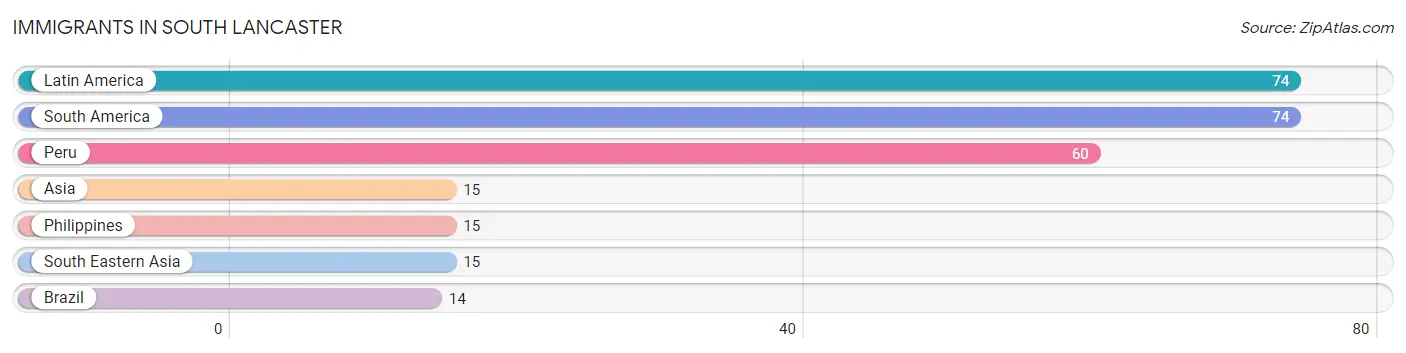
Immigrants in South Lancaster
The most numerous immigrant groups reported in South Lancaster came from Latin America (74 | 4.5%), South America (74 | 4.5%), Peru (60 | 3.6%), Asia (15 | 0.9%), and Philippines (15 | 0.9%), together accounting for 14.5% of all South Lancaster residents.
| Immigration Origin | # Population | % Population |
| Asia | 15 | 0.9% |
| Brazil | 14 | 0.9% |
| Latin America | 74 | 4.5% |
| Peru | 60 | 3.6% |
| Philippines | 15 | 0.9% |
| South America | 74 | 4.5% |
| South Eastern Asia | 15 | 0.9% | View All 7 Rows |
Sex and Age in South Lancaster
Sex and Age in South Lancaster
The most populous age groups in South Lancaster are Under 5 Years (80 | 11.4%) for men and 30 to 34 Years (111 | 11.8%) for women.
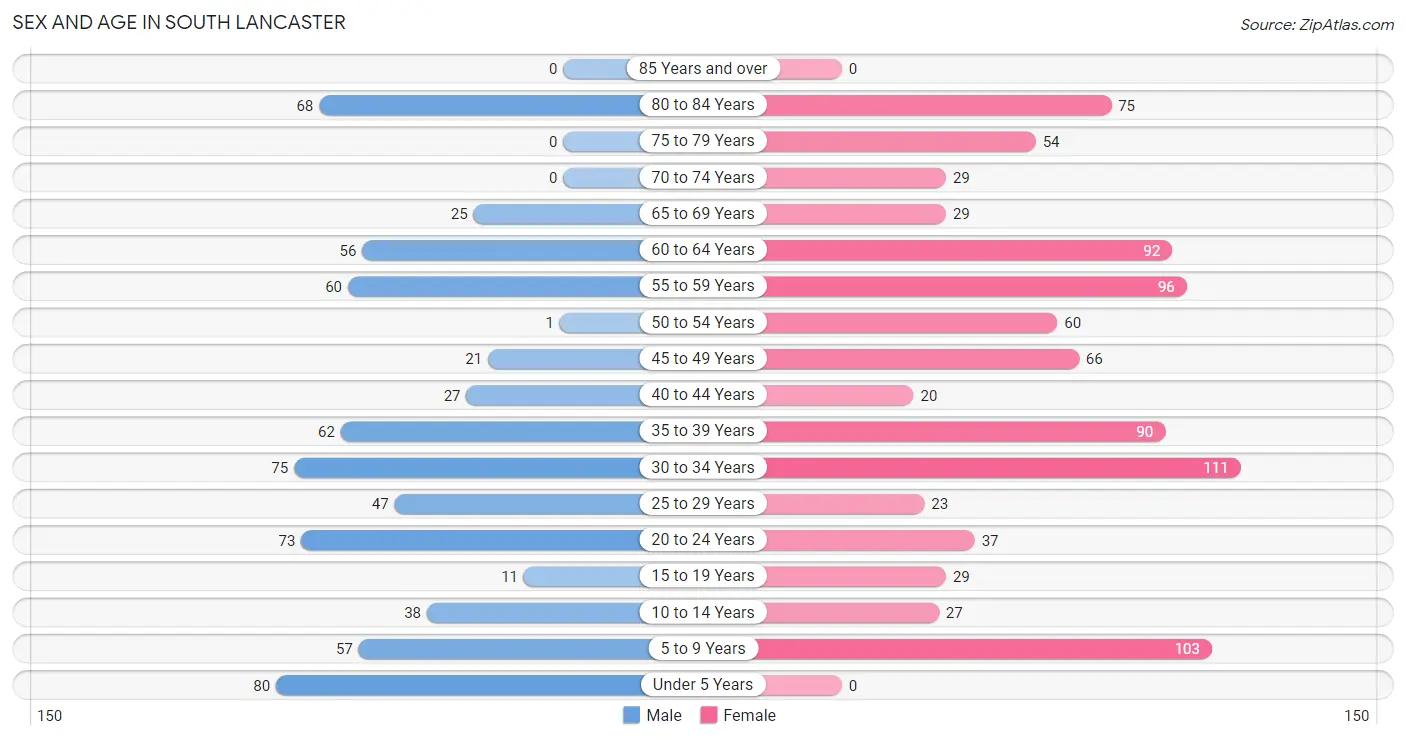
| Age Bracket | Male | Female |
| Under 5 Years | 80 (11.4%) | 0 (0.0%) |
| 5 to 9 Years | 57 (8.1%) | 103 (11.0%) |
| 10 to 14 Years | 38 (5.4%) | 27 (2.9%) |
| 15 to 19 Years | 11 (1.6%) | 29 (3.1%) |
| 20 to 24 Years | 73 (10.4%) | 37 (3.9%) |
| 25 to 29 Years | 47 (6.7%) | 23 (2.4%) |
| 30 to 34 Years | 75 (10.7%) | 111 (11.8%) |
| 35 to 39 Years | 62 (8.8%) | 90 (9.6%) |
| 40 to 44 Years | 27 (3.8%) | 20 (2.1%) |
| 45 to 49 Years | 21 (3.0%) | 66 (7.0%) |
| 50 to 54 Years | 1 (0.1%) | 60 (6.4%) |
| 55 to 59 Years | 60 (8.6%) | 96 (10.2%) |
| 60 to 64 Years | 56 (8.0%) | 92 (9.8%) |
| 65 to 69 Years | 25 (3.6%) | 29 (3.1%) |
| 70 to 74 Years | 0 (0.0%) | 29 (3.1%) |
| 75 to 79 Years | 0 (0.0%) | 54 (5.7%) |
| 80 to 84 Years | 68 (9.7%) | 75 (8.0%) |
| 85 Years and over | 0 (0.0%) | 0 (0.0%) |
| Total | 701 (100.0%) | 941 (100.0%) |
Families and Households in South Lancaster
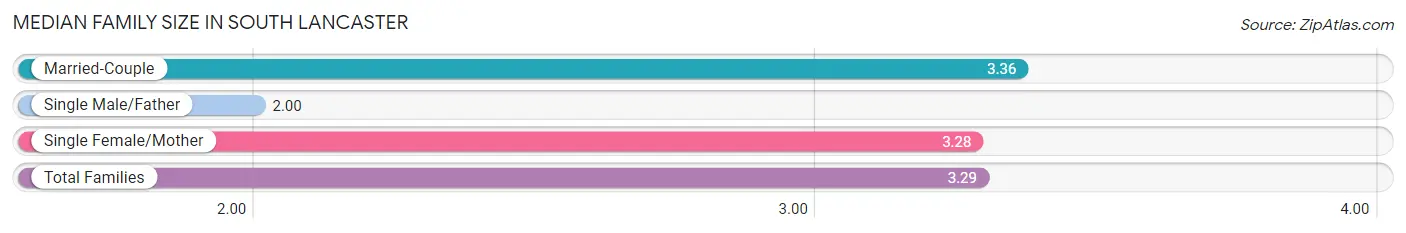
Median Family Size in South Lancaster
The median family size in South Lancaster is 3.29 persons per family, with married-couple families (274 | 74.1%) accounting for the largest median family size of 3.36 persons per family. On the other hand, single male/father families (14 | 3.8%) represent the smallest median family size with 2.00 persons per family.
| Family Type | # Families | Family Size |
| Married-Couple | 274 (74.1%) | 3.36 |
| Single Male/Father | 14 (3.8%) | 2.00 |
| Single Female/Mother | 82 (22.2%) | 3.28 |
| Total Families | 370 (100.0%) | 3.29 |
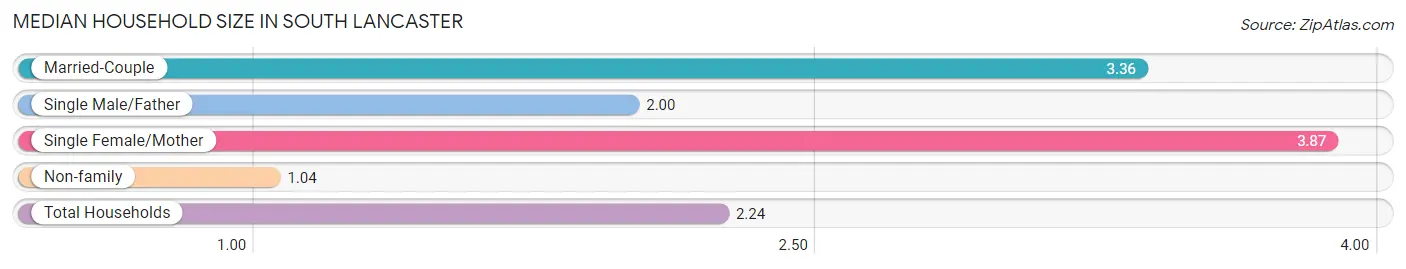
Median Household Size in South Lancaster
The median household size in South Lancaster is 2.24 persons per household, with single female/mother households (82 | 11.2%) accounting for the largest median household size of 3.87 persons per household. non-family households (363 | 49.5%) represent the smallest median household size with 1.04 persons per household.
| Household Type | # Households | Household Size |
| Married-Couple | 274 (37.4%) | 3.36 |
| Single Male/Father | 14 (1.9%) | 2.00 |
| Single Female/Mother | 82 (11.2%) | 3.87 |
| Non-family | 363 (49.5%) | 1.04 |
| Total Households | 733 (100.0%) | 2.24 |
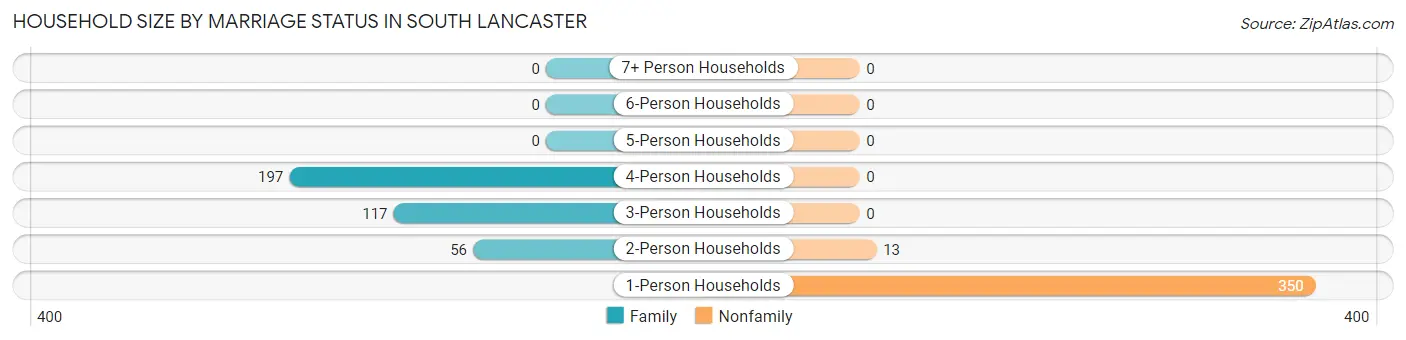
Household Size by Marriage Status in South Lancaster
Out of a total of 733 households in South Lancaster, 370 (50.5%) are family households, while 363 (49.5%) are nonfamily households. The most numerous type of family households are 4-person households, comprising 197, and the most common type of nonfamily households are 1-person households, comprising 350.
| Household Size | Family Households | Nonfamily Households |
| 1-Person Households | - | 350 (47.7%) |
| 2-Person Households | 56 (7.6%) | 13 (1.8%) |
| 3-Person Households | 117 (16.0%) | 0 (0.0%) |
| 4-Person Households | 197 (26.9%) | 0 (0.0%) |
| 5-Person Households | 0 (0.0%) | 0 (0.0%) |
| 6-Person Households | 0 (0.0%) | 0 (0.0%) |
| 7+ Person Households | 0 (0.0%) | 0 (0.0%) |
| Total | 370 (50.5%) | 363 (49.5%) |
Female Fertility in South Lancaster
Fertility by Age in South Lancaster
Average fertility rate in South Lancaster is 77.0 births per 1,000 women. Women in the age bracket of 20 to 34 years have the highest fertility rate with 170.0 births per 1,000 women. Women in the age bracket of 20 to 34 years acount for 100.0% of all women with births.
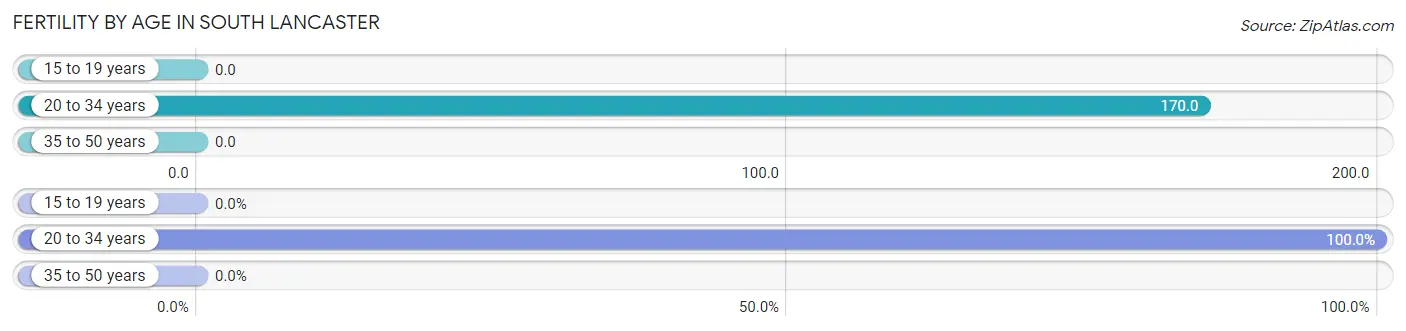
| Age Bracket | Women with Births | Births / 1,000 Women |
| 15 to 19 years | 0 (0.0%) | 0.0 |
| 20 to 34 years | 29 (100.0%) | 170.0 |
| 35 to 50 years | 0 (0.0%) | 0.0 |
| Total | 29 (100.0%) | 77.0 |
Fertility by Age by Marriage Status in South Lancaster
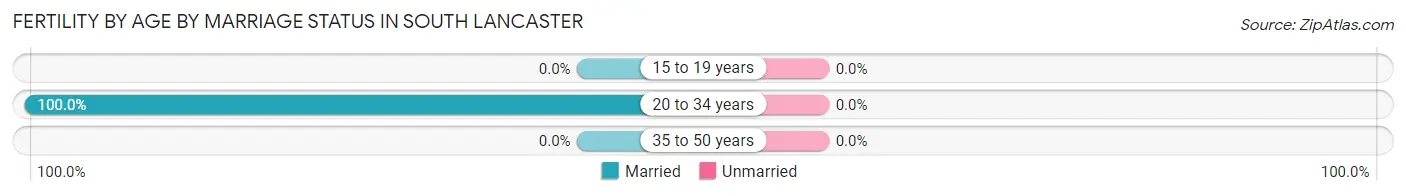
| Age Bracket | Married | Unmarried |
| 15 to 19 years | 0 (0.0%) | 0 (0.0%) |
| 20 to 34 years | 29 (100.0%) | 0 (0.0%) |
| 35 to 50 years | 0 (0.0%) | 0 (0.0%) |
| Total | 29 (100.0%) | 0 (0.0%) |
Fertility by Education in South Lancaster
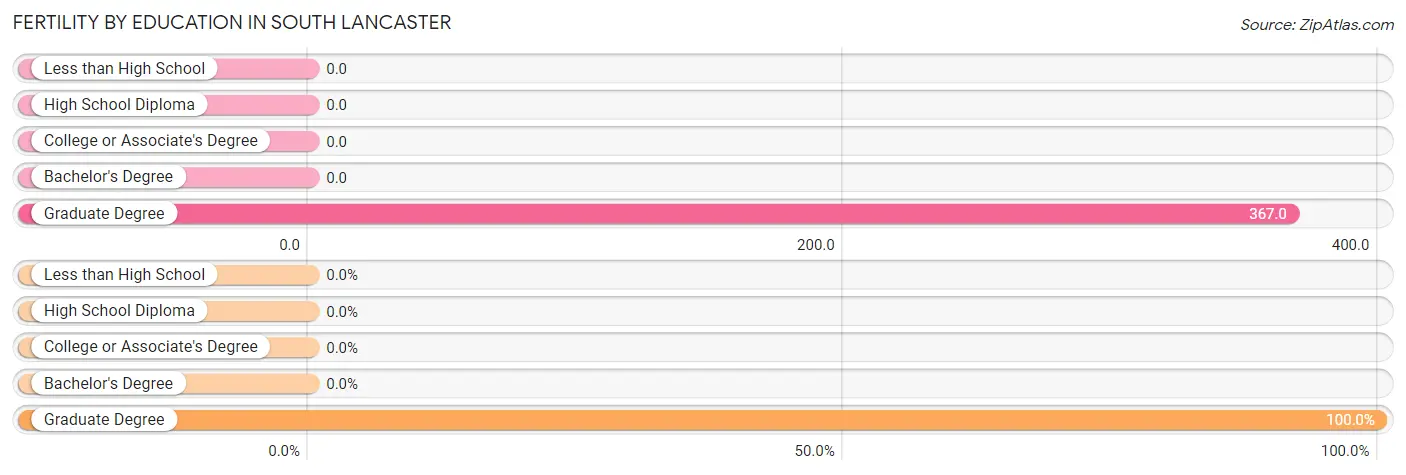
| Educational Attainment | Women with Births | Births / 1,000 Women |
| Less than High School | 0 (0.0%) | 0.0 |
| High School Diploma | 0 (0.0%) | 0.0 |
| College or Associate's Degree | 0 (0.0%) | 0.0 |
| Bachelor's Degree | 0 (0.0%) | 0.0 |
| Graduate Degree | 29 (100.0%) | 367.0 |
| Total | 29 (100.0%) | 77.0 |
Fertility by Education by Marriage Status in South Lancaster
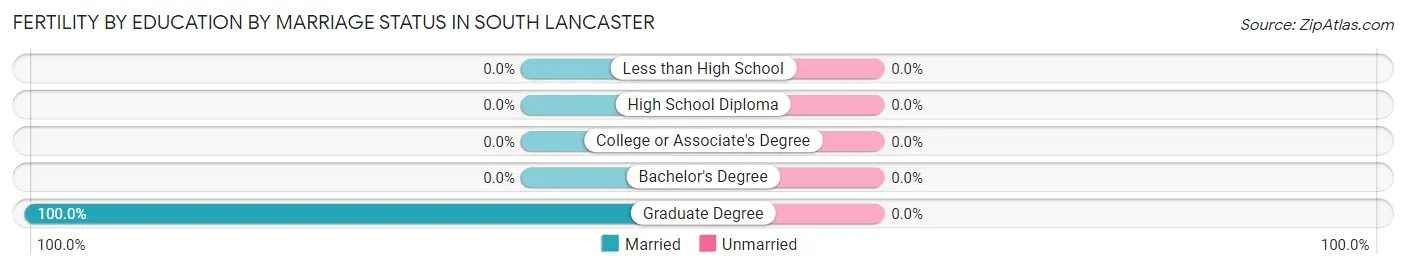
| Educational Attainment | Married | Unmarried |
| Less than High School | 0 (0.0%) | 0 (0.0%) |
| High School Diploma | 0 (0.0%) | 0 (0.0%) |
| College or Associate's Degree | 0 (0.0%) | 0 (0.0%) |
| Bachelor's Degree | 0 (0.0%) | 0 (0.0%) |
| Graduate Degree | 29 (100.0%) | 0 (0.0%) |
| Total | 29 (100.0%) | 0 (0.0%) |
Income in South Lancaster
Income Overview in South Lancaster
Per Capita Income in South Lancaster is $45,354, while median incomes of families and households are $109,667 and $101,250 respectively.
| Characteristic | Number | Measure |
| Per Capita Income | 1,642 | $45,354 |
| Median Family Income | 370 | $109,667 |
| Mean Family Income | 370 | $115,236 |
| Median Household Income | 733 | $101,250 |
| Mean Household Income | 733 | $101,421 |
| Income Deficit | 370 | $0 |
| Wage / Income Gap (%) | 1,642 | 6.00% |
| Wage / Income Gap ($) | 1,642 | 94.00¢ per $1 |
| Gini / Inequality Index | 1,642 | 0.34 |
Earnings by Sex in South Lancaster
Average Earnings in South Lancaster are $60,159, $56,898 for men and $60,532 for women, a difference of 6.0%.
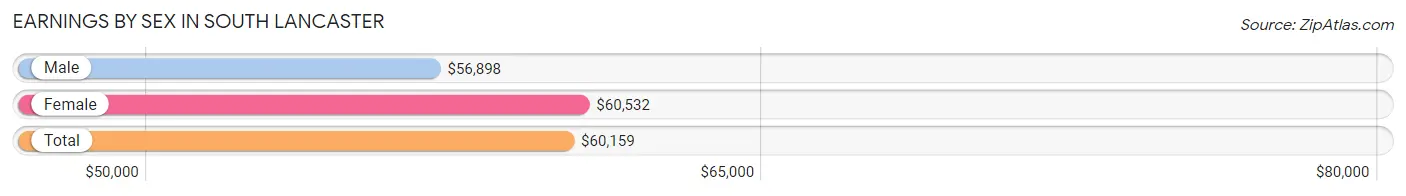
| Sex | Number | Average Earnings |
| Male | 433 (44.5%) | $56,898 |
| Female | 540 (55.5%) | $60,532 |
| Total | 973 (100.0%) | $60,159 |
Earnings by Sex by Income Bracket in South Lancaster
The most common earnings brackets in South Lancaster are $100,000+ for men (100 | 23.1%) and $100,000+ for women (165 | 30.6%).
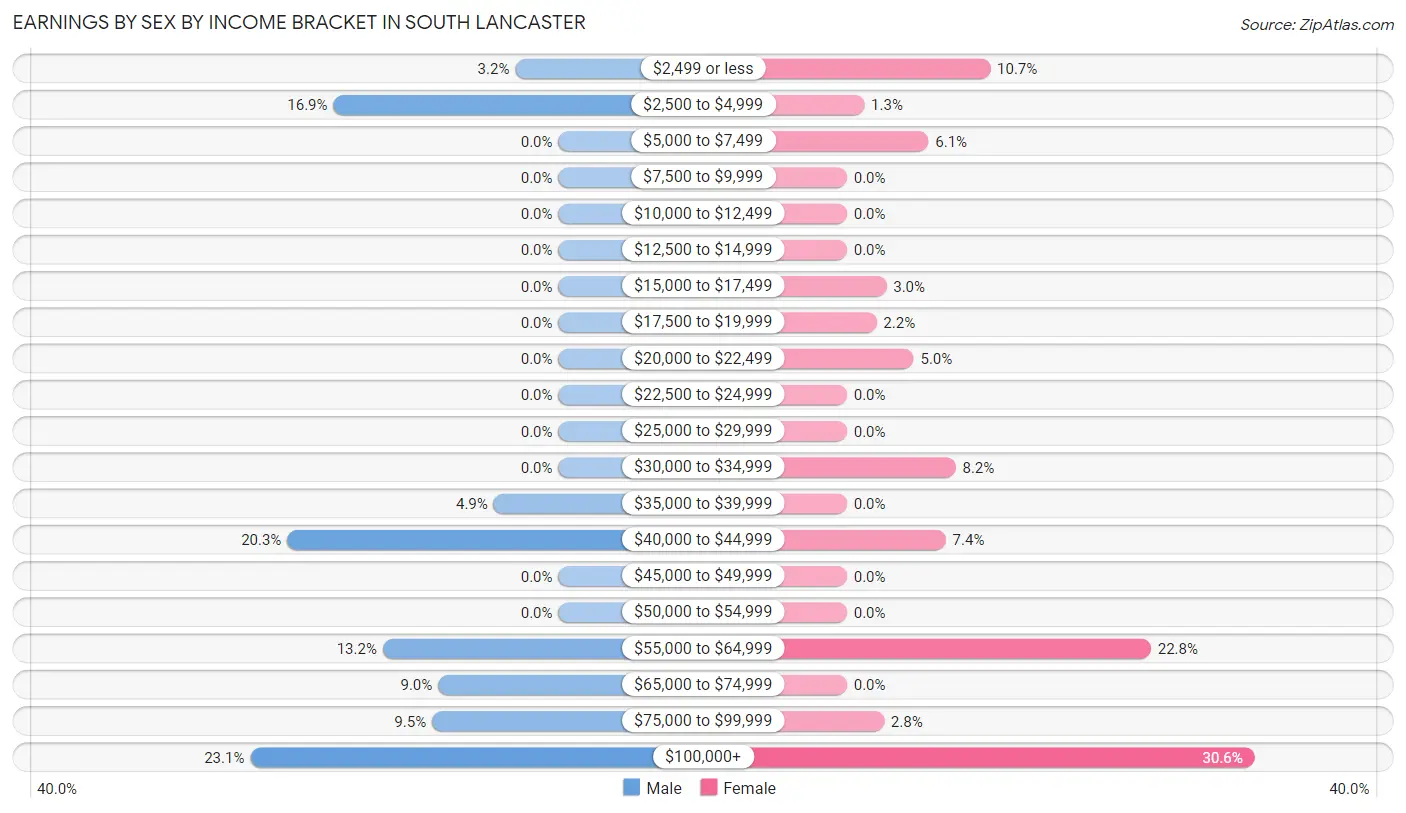
| Income | Male | Female |
| $2,499 or less | 14 (3.2%) | 58 (10.7%) |
| $2,500 to $4,999 | 73 (16.9%) | 7 (1.3%) |
| $5,000 to $7,499 | 0 (0.0%) | 33 (6.1%) |
| $7,500 to $9,999 | 0 (0.0%) | 0 (0.0%) |
| $10,000 to $12,499 | 0 (0.0%) | 0 (0.0%) |
| $12,500 to $14,999 | 0 (0.0%) | 0 (0.0%) |
| $15,000 to $17,499 | 0 (0.0%) | 16 (3.0%) |
| $17,500 to $19,999 | 0 (0.0%) | 12 (2.2%) |
| $20,000 to $22,499 | 0 (0.0%) | 27 (5.0%) |
| $22,500 to $24,999 | 0 (0.0%) | 0 (0.0%) |
| $25,000 to $29,999 | 0 (0.0%) | 0 (0.0%) |
| $30,000 to $34,999 | 0 (0.0%) | 44 (8.2%) |
| $35,000 to $39,999 | 21 (4.9%) | 0 (0.0%) |
| $40,000 to $44,999 | 88 (20.3%) | 40 (7.4%) |
| $45,000 to $49,999 | 0 (0.0%) | 0 (0.0%) |
| $50,000 to $54,999 | 0 (0.0%) | 0 (0.0%) |
| $55,000 to $64,999 | 57 (13.2%) | 123 (22.8%) |
| $65,000 to $74,999 | 39 (9.0%) | 0 (0.0%) |
| $75,000 to $99,999 | 41 (9.5%) | 15 (2.8%) |
| $100,000+ | 100 (23.1%) | 165 (30.6%) |
| Total | 433 (100.0%) | 540 (100.0%) |
Earnings by Sex by Educational Attainment in South Lancaster
Average earnings in South Lancaster are $65,000 for men and $60,559 for women, a difference of 6.8%. Men with an educational attainment of bachelor's degree enjoy the highest average annual earnings of $64,602, while those with high school diploma education earn the least with $55,185. Women with an educational attainment of graduate degree earn the most with the average annual earnings of $63,319, while those with college or associate's degree education have the smallest earnings of $61,170.
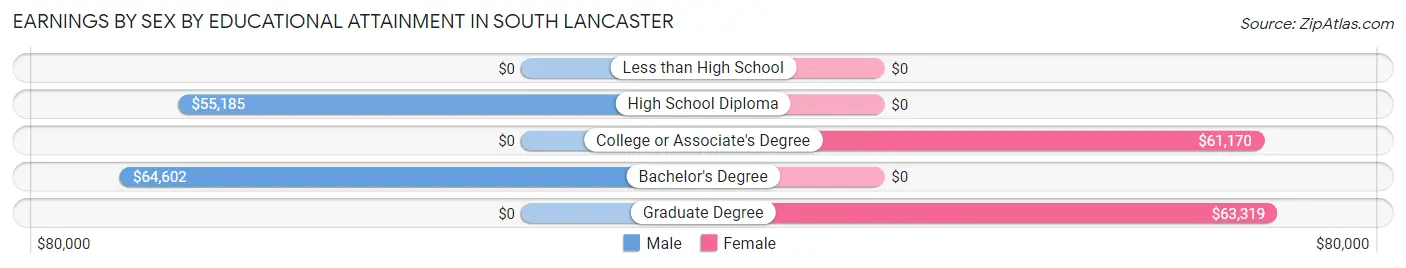
| Educational Attainment | Male Income | Female Income |
| Less than High School | - | - |
| High School Diploma | $55,185 | $0 |
| College or Associate's Degree | - | - |
| Bachelor's Degree | $64,602 | $0 |
| Graduate Degree | - | - |
| Total | $65,000 | $60,559 |
Family Income in South Lancaster
Family Income Brackets in South Lancaster
According to the South Lancaster family income data, there are 134 families falling into the $150,000 to $199,999 income range, which is the most common income bracket and makes up 36.2% of all families.
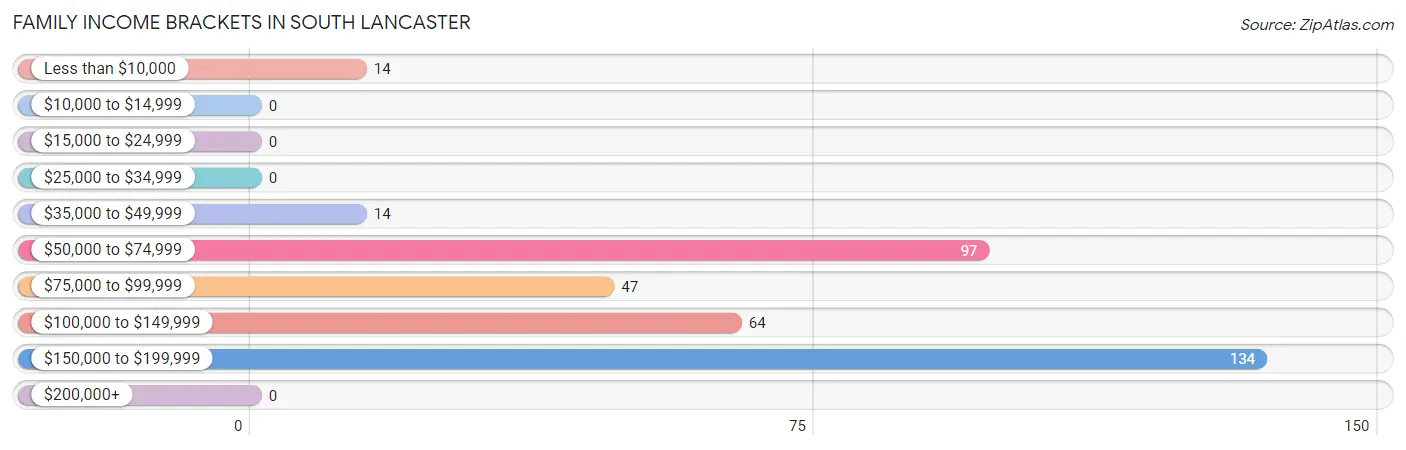
| Income Bracket | # Families | % Families |
| Less than $10,000 | 14 | 3.8% |
| $10,000 to $14,999 | 0 | 0.0% |
| $15,000 to $24,999 | 0 | 0.0% |
| $25,000 to $34,999 | 0 | 0.0% |
| $35,000 to $49,999 | 14 | 3.8% |
| $50,000 to $74,999 | 97 | 26.2% |
| $75,000 to $99,999 | 47 | 12.7% |
| $100,000 to $149,999 | 64 | 17.3% |
| $150,000 to $199,999 | 134 | 36.2% |
| $200,000+ | 0 | 0.0% |
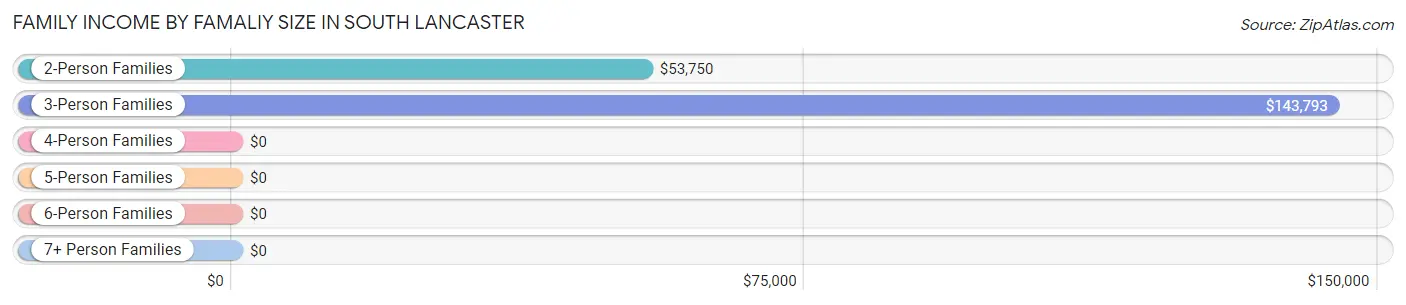
Family Income by Famaliy Size in South Lancaster
3-person families (164 | 44.3%) account for the highest median family income in South Lancaster with $143,793 per family, while 3-person families (164 | 44.3%) have the highest median income of $47,931 per family member.
| Income Bracket | # Families | Median Income |
| 2-Person Families | 56 (15.1%) | $53,750 |
| 3-Person Families | 164 (44.3%) | $143,793 |
| 4-Person Families | 150 (40.5%) | $0 |
| 5-Person Families | 0 (0.0%) | $0 |
| 6-Person Families | 0 (0.0%) | $0 |
| 7+ Person Families | 0 (0.0%) | $0 |
| Total | 370 (100.0%) | $109,667 |
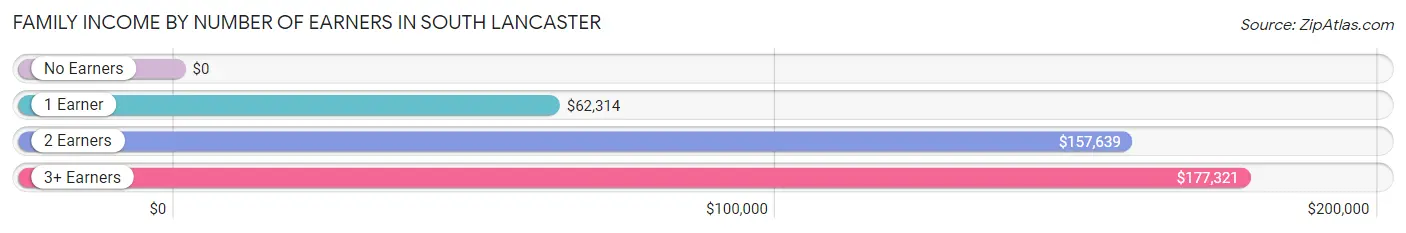
Family Income by Number of Earners in South Lancaster
| Number of Earners | # Families | Median Income |
| No Earners | 30 (8.1%) | $0 |
| 1 Earner | 115 (31.1%) | $62,314 |
| 2 Earners | 132 (35.7%) | $157,639 |
| 3+ Earners | 93 (25.1%) | $177,321 |
| Total | 370 (100.0%) | $109,667 |
Household Income in South Lancaster
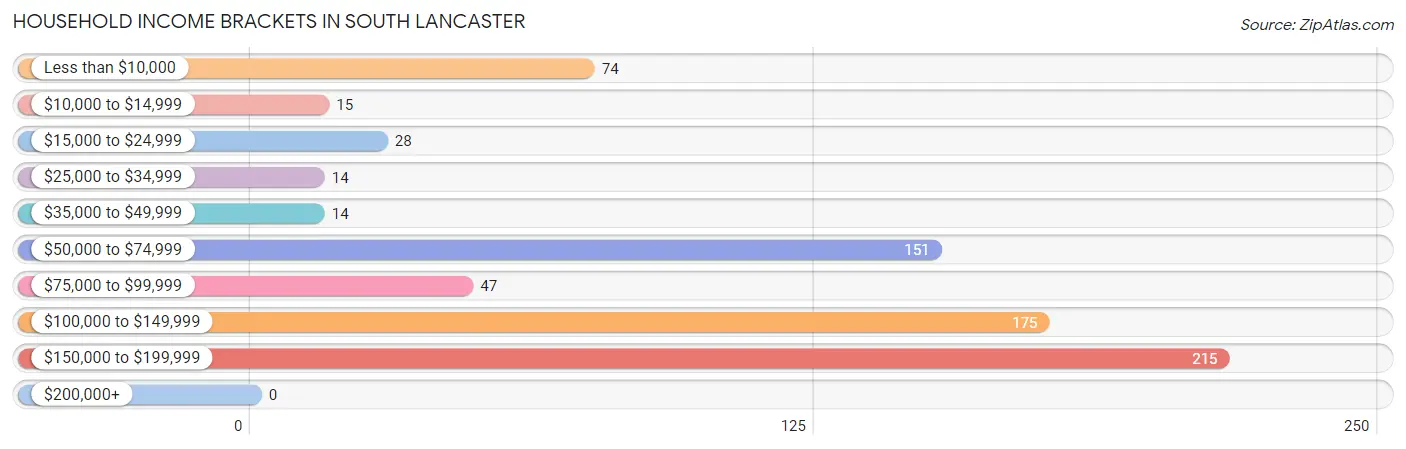
Household Income Brackets in South Lancaster
With 215 households falling in the category, the $150,000 to $199,999 income range is the most frequent in South Lancaster, accounting for 29.3% of all households.
| Income Bracket | # Households | % Households |
| Less than $10,000 | 74 | 10.1% |
| $10,000 to $14,999 | 15 | 2.0% |
| $15,000 to $24,999 | 28 | 3.8% |
| $25,000 to $34,999 | 14 | 1.9% |
| $35,000 to $49,999 | 14 | 1.9% |
| $50,000 to $74,999 | 151 | 20.6% |
| $75,000 to $99,999 | 47 | 6.4% |
| $100,000 to $149,999 | 175 | 23.9% |
| $150,000 to $199,999 | 215 | 29.3% |
| $200,000+ | 0 | 0.0% |
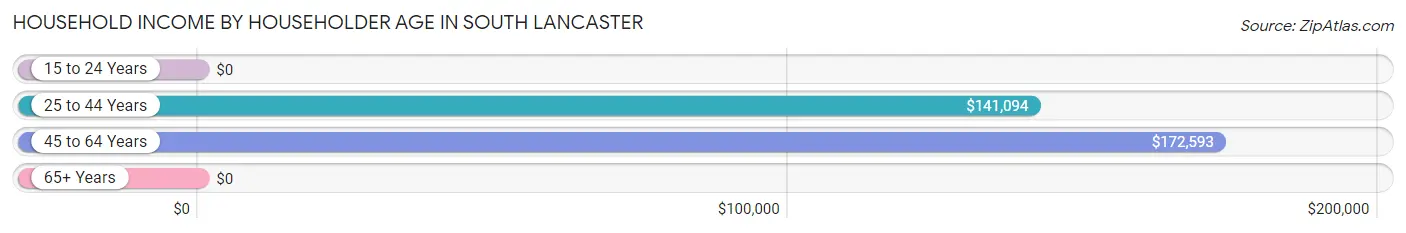
Household Income by Householder Age in South Lancaster
The median household income in South Lancaster is $101,250, with the highest median household income of $172,593 found in the 45 to 64 years age bracket for the primary householder. A total of 310 households (42.3%) fall into this category.
| Income Bracket | # Households | Median Income |
| 15 to 24 Years | 0 (0.0%) | $0 |
| 25 to 44 Years | 199 (27.2%) | $141,094 |
| 45 to 64 Years | 310 (42.3%) | $172,593 |
| 65+ Years | 224 (30.6%) | $0 |
| Total | 733 (100.0%) | $101,250 |
Poverty in South Lancaster
Income Below Poverty by Sex and Age in South Lancaster
With 4.0% poverty level for males and 8.0% for females among the residents of South Lancaster, 35 to 44 year old males and 75 year old and over females are the most vulnerable to poverty, with 14 males (15.7%) and 60 females (46.5%) in their respective age groups living below the poverty level.
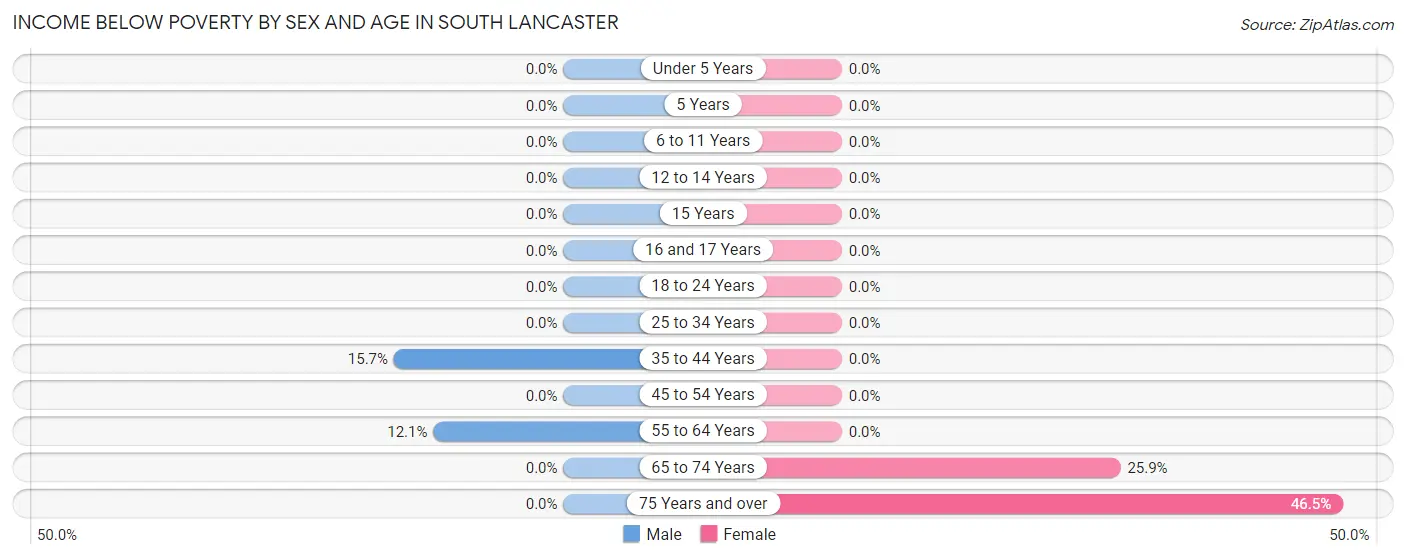
| Age Bracket | Male | Female |
| Under 5 Years | 0 (0.0%) | 0 (0.0%) |
| 5 Years | 0 (0.0%) | 0 (0.0%) |
| 6 to 11 Years | 0 (0.0%) | 0 (0.0%) |
| 12 to 14 Years | 0 (0.0%) | 0 (0.0%) |
| 15 Years | 0 (0.0%) | 0 (0.0%) |
| 16 and 17 Years | 0 (0.0%) | 0 (0.0%) |
| 18 to 24 Years | 0 (0.0%) | 0 (0.0%) |
| 25 to 34 Years | 0 (0.0%) | 0 (0.0%) |
| 35 to 44 Years | 14 (15.7%) | 0 (0.0%) |
| 45 to 54 Years | 0 (0.0%) | 0 (0.0%) |
| 55 to 64 Years | 14 (12.1%) | 0 (0.0%) |
| 65 to 74 Years | 0 (0.0%) | 15 (25.9%) |
| 75 Years and over | 0 (0.0%) | 60 (46.5%) |
| Total | 28 (4.0%) | 75 (8.0%) |
Income Above Poverty by Sex and Age in South Lancaster
According to the poverty statistics in South Lancaster, males aged under 5 years and females aged 6 to 11 years are the age groups that are most secure financially, with 100.0% of males and 100.0% of females in these age groups living above the poverty line.
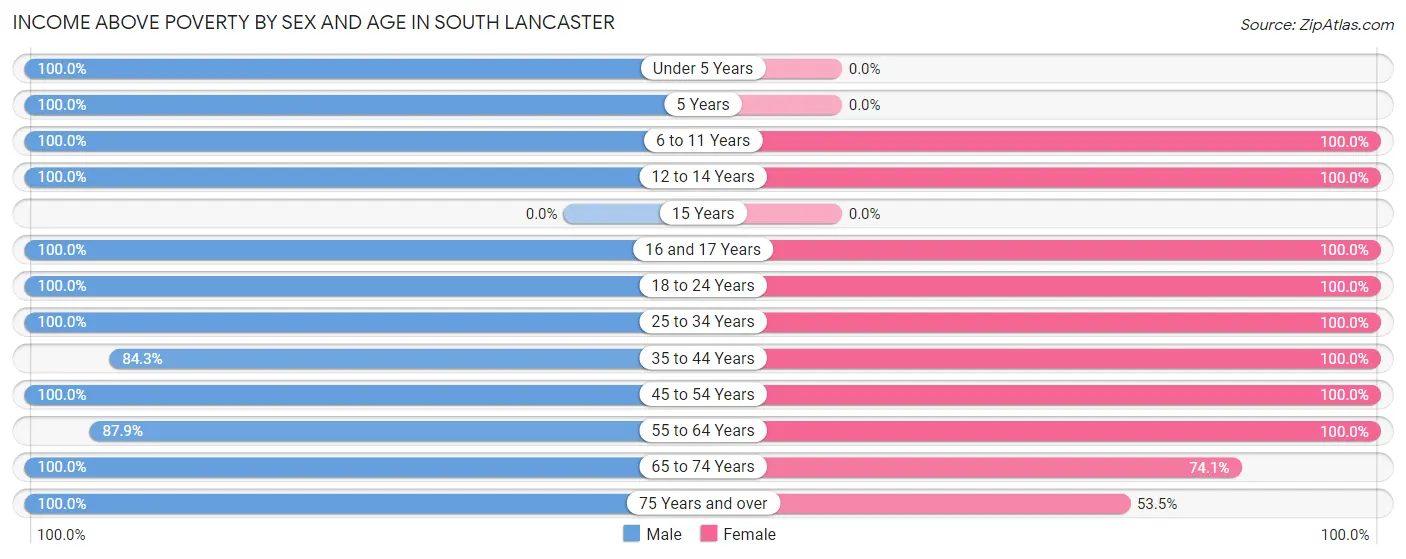
| Age Bracket | Male | Female |
| Under 5 Years | 80 (100.0%) | 0 (0.0%) |
| 5 Years | 35 (100.0%) | 0 (0.0%) |
| 6 to 11 Years | 22 (100.0%) | 118 (100.0%) |
| 12 to 14 Years | 38 (100.0%) | 12 (100.0%) |
| 15 Years | 0 (0.0%) | 0 (0.0%) |
| 16 and 17 Years | 11 (100.0%) | 29 (100.0%) |
| 18 to 24 Years | 73 (100.0%) | 37 (100.0%) |
| 25 to 34 Years | 122 (100.0%) | 134 (100.0%) |
| 35 to 44 Years | 75 (84.3%) | 110 (100.0%) |
| 45 to 54 Years | 22 (100.0%) | 126 (100.0%) |
| 55 to 64 Years | 102 (87.9%) | 188 (100.0%) |
| 65 to 74 Years | 25 (100.0%) | 43 (74.1%) |
| 75 Years and over | 68 (100.0%) | 69 (53.5%) |
| Total | 673 (96.0%) | 866 (92.0%) |
Income Below Poverty Among Married-Couple Families in South Lancaster
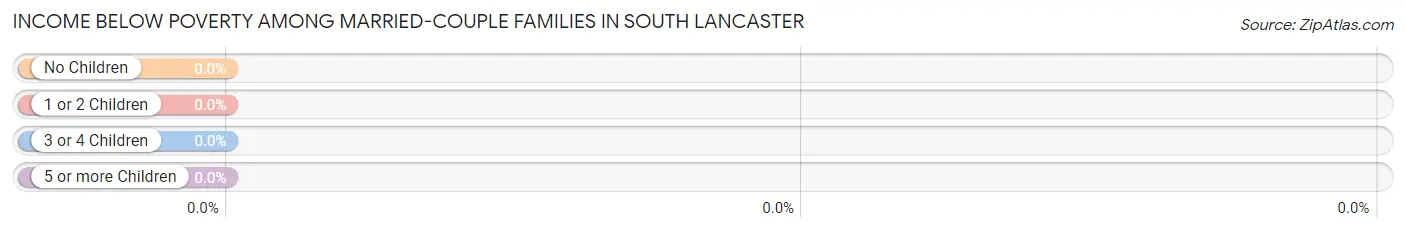
| Children | Above Poverty | Below Poverty |
| No Children | 139 (100.0%) | 0 (0.0%) |
| 1 or 2 Children | 135 (100.0%) | 0 (0.0%) |
| 3 or 4 Children | 0 (0.0%) | 0 (0.0%) |
| 5 or more Children | 0 (0.0%) | 0 (0.0%) |
| Total | 274 (100.0%) | 0 (0.0%) |
Income Below Poverty Among Single-Parent Households in South Lancaster
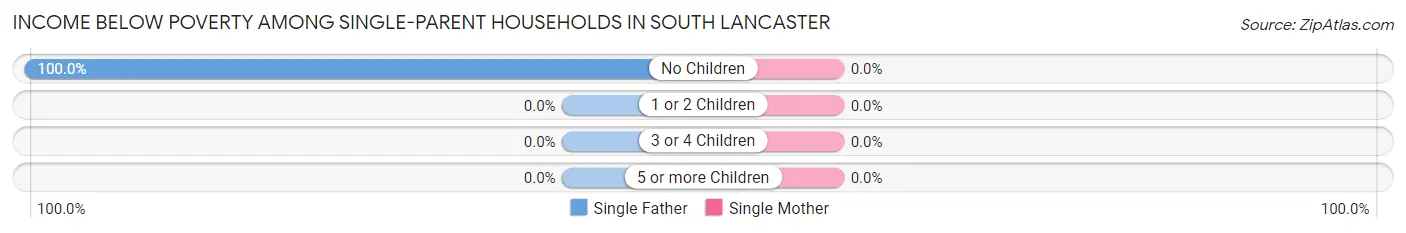
| Children | Single Father | Single Mother |
| No Children | 14 (100.0%) | 0 (0.0%) |
| 1 or 2 Children | 0 (0.0%) | 0 (0.0%) |
| 3 or 4 Children | 0 (0.0%) | 0 (0.0%) |
| 5 or more Children | 0 (0.0%) | 0 (0.0%) |
| Total | 14 (100.0%) | 0 (0.0%) |
Income Below Poverty Among Married-Couple vs Single-Parent Households in South Lancaster
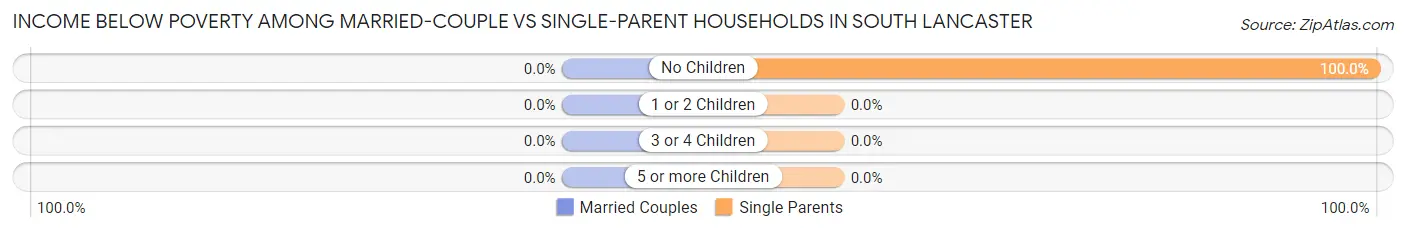
| Children | Married-Couple Families | Single-Parent Households |
| No Children | 0 (0.0%) | 14 (100.0%) |
| 1 or 2 Children | 0 (0.0%) | 0 (0.0%) |
| 3 or 4 Children | 0 (0.0%) | 0 (0.0%) |
| 5 or more Children | 0 (0.0%) | 0 (0.0%) |
| Total | 0 (0.0%) | 14 (14.6%) |
Employment Characteristics in South Lancaster
Employment by Class of Employer in South Lancaster
Among the 711 employed individuals in South Lancaster, private company employees (497 | 69.9%), local government employees (82 | 11.5%), and not-for-profit organizations (63 | 8.9%) make up the most common classes of employment.
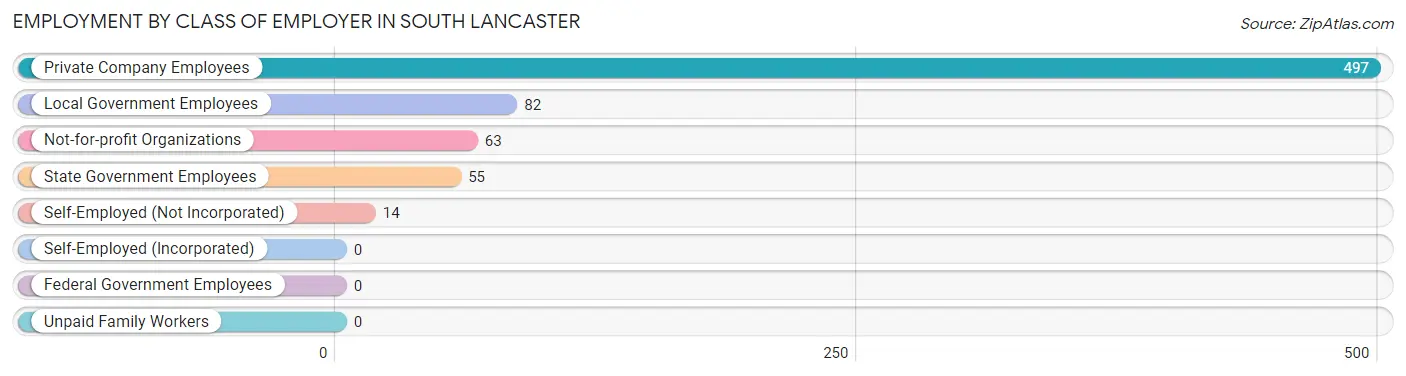
| Employer Class | # Employees | % Employees |
| Private Company Employees | 497 | 69.9% |
| Self-Employed (Incorporated) | 0 | 0.0% |
| Self-Employed (Not Incorporated) | 14 | 2.0% |
| Not-for-profit Organizations | 63 | 8.9% |
| Local Government Employees | 82 | 11.5% |
| State Government Employees | 55 | 7.7% |
| Federal Government Employees | 0 | 0.0% |
| Unpaid Family Workers | 0 | 0.0% |
| Total | 711 | 100.0% |
Employment Status by Age in South Lancaster
According to the labor force statistics for South Lancaster, out of the total population over 16 years of age (1,337), 69.6% or 931 individuals are in the labor force, with 19.0% or 177 of them unemployed. The age group with the highest labor force participation rate is 25 to 29 years, with 100.0% or 70 individuals in the labor force. Within the labor force, the 20 to 24 years age range has the highest percentage of unemployed individuals, with 64.4% or 47 of them being unemployed.
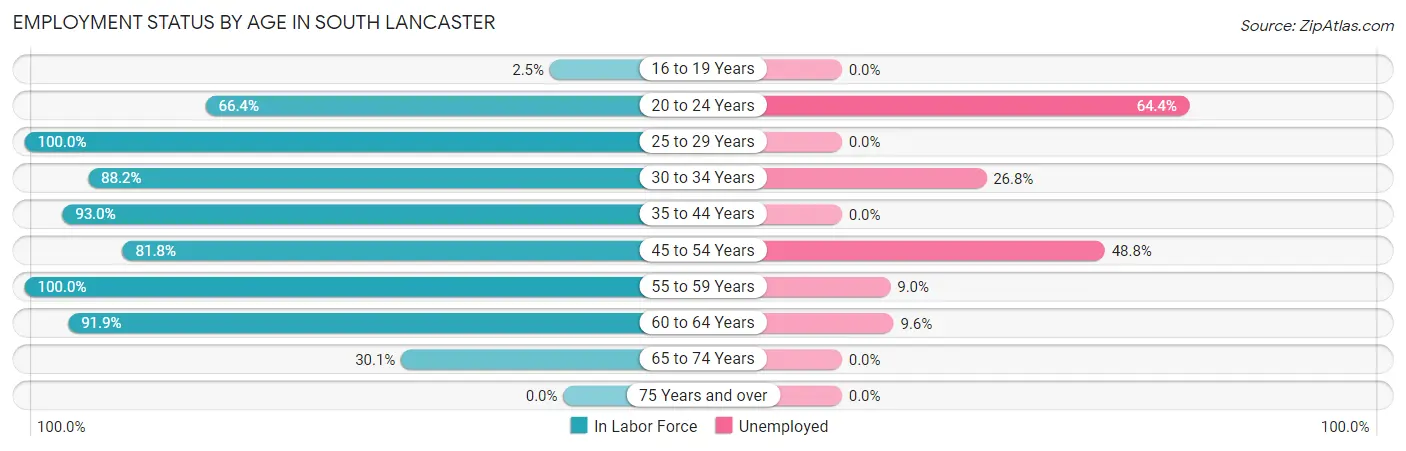
| Age Bracket | In Labor Force | Unemployed |
| 16 to 19 Years | 1 (2.5%) | 0 (0.0%) |
| 20 to 24 Years | 73 (66.4%) | 47 (64.4%) |
| 25 to 29 Years | 70 (100.0%) | 0 (0.0%) |
| 30 to 34 Years | 164 (88.2%) | 44 (26.8%) |
| 35 to 44 Years | 185 (93.0%) | 0 (0.0%) |
| 45 to 54 Years | 121 (81.8%) | 59 (48.8%) |
| 55 to 59 Years | 156 (100.0%) | 14 (9.0%) |
| 60 to 64 Years | 136 (91.9%) | 13 (9.6%) |
| 65 to 74 Years | 25 (30.1%) | 0 (0.0%) |
| 75 Years and over | 0 (0.0%) | 0 (0.0%) |
| Total | 931 (69.6%) | 177 (19.0%) |
Employment Status by Educational Attainment in South Lancaster
According to labor force statistics for South Lancaster, 91.7% of individuals (832) out of the total population between 25 and 64 years of age (907) are in the labor force, with 15.6% or 130 of them being unemployed. The group with the highest labor force participation rate are those with the educational attainment of bachelor's degree or higher, with 96.6% or 628 individuals in the labor force. Within the labor force, individuals with college / associate degree education have the highest percentage of unemployment, with 20.8% or 27 of them being unemployed.
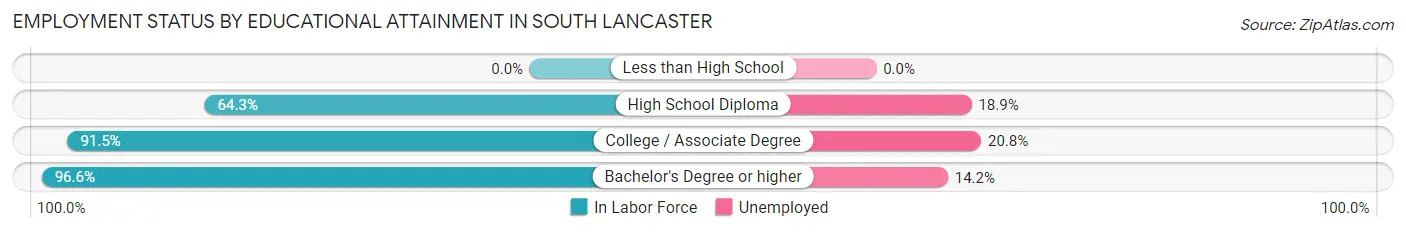
| Educational Attainment | In Labor Force | Unemployed |
| Less than High School | 0 (0.0%) | 0 (0.0%) |
| High School Diploma | 74 (64.3%) | 22 (18.9%) |
| College / Associate Degree | 130 (91.5%) | 30 (20.8%) |
| Bachelor's Degree or higher | 628 (96.6%) | 92 (14.2%) |
| Total | 832 (91.7%) | 141 (15.6%) |
Employment Occupations by Sex in South Lancaster
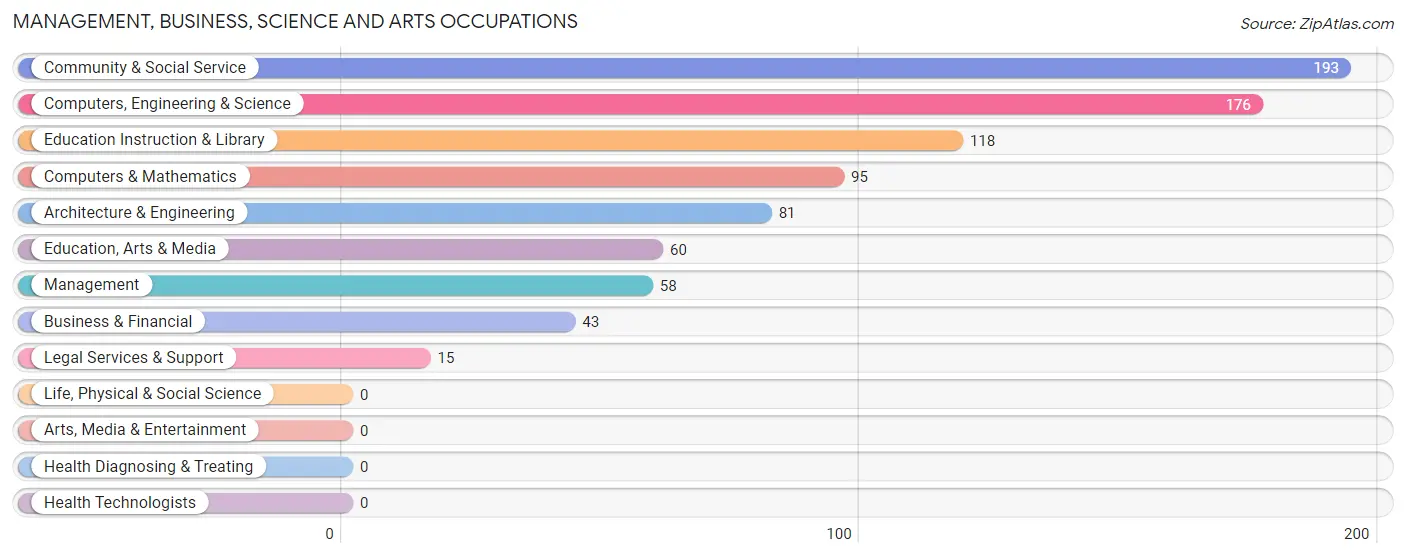
Management, Business, Science and Arts Occupations
The most common Management, Business, Science and Arts occupations in South Lancaster are Community & Social Service (193 | 25.6%), Computers, Engineering & Science (176 | 23.3%), Education Instruction & Library (118 | 15.7%), Computers & Mathematics (95 | 12.6%), and Architecture & Engineering (81 | 10.7%).
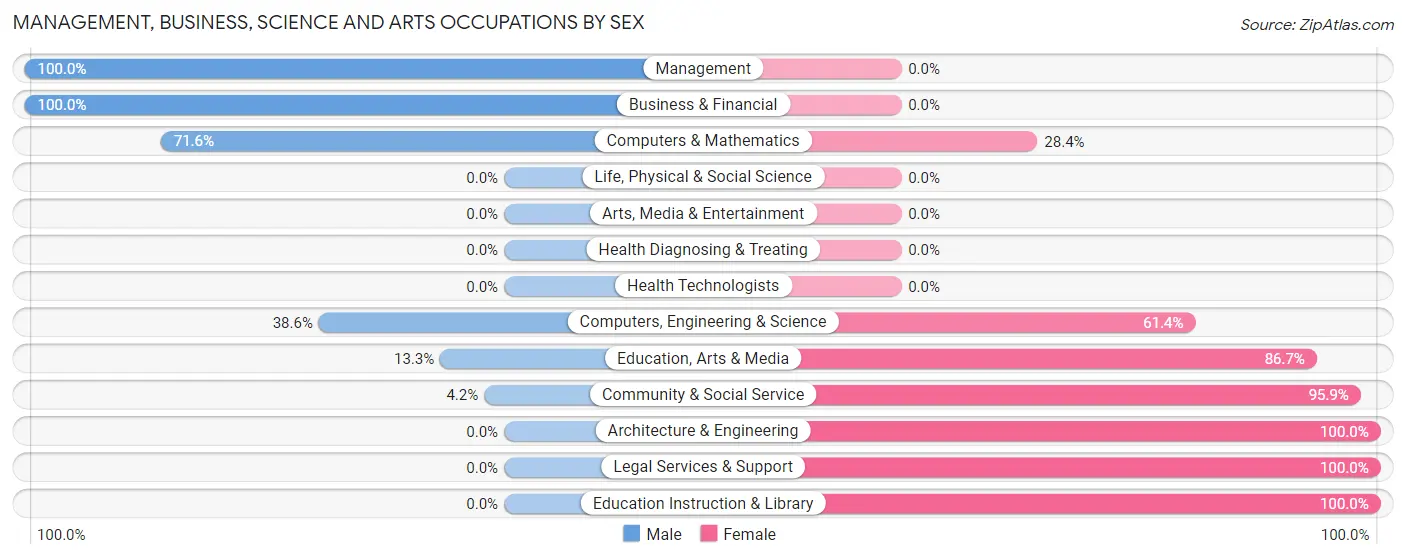
Management, Business, Science and Arts Occupations by Sex
Within the Management, Business, Science and Arts occupations in South Lancaster, the most male-oriented occupations are Management (100.0%), Business & Financial (100.0%), and Computers & Mathematics (71.6%), while the most female-oriented occupations are Architecture & Engineering (100.0%), Legal Services & Support (100.0%), and Education Instruction & Library (100.0%).
| Occupation | Male | Female |
| Management | 58 (100.0%) | 0 (0.0%) |
| Business & Financial | 43 (100.0%) | 0 (0.0%) |
| Computers, Engineering & Science | 68 (38.6%) | 108 (61.4%) |
| Computers & Mathematics | 68 (71.6%) | 27 (28.4%) |
| Architecture & Engineering | 0 (0.0%) | 81 (100.0%) |
| Life, Physical & Social Science | 0 (0.0%) | 0 (0.0%) |
| Community & Social Service | 8 (4.2%) | 185 (95.9%) |
| Education, Arts & Media | 8 (13.3%) | 52 (86.7%) |
| Legal Services & Support | 0 (0.0%) | 15 (100.0%) |
| Education Instruction & Library | 0 (0.0%) | 118 (100.0%) |
| Arts, Media & Entertainment | 0 (0.0%) | 0 (0.0%) |
| Health Diagnosing & Treating | 0 (0.0%) | 0 (0.0%) |
| Health Technologists | 0 (0.0%) | 0 (0.0%) |
| Total (Category) | 177 (37.7%) | 293 (62.3%) |
| Total (Overall) | 372 (49.3%) | 382 (50.7%) |
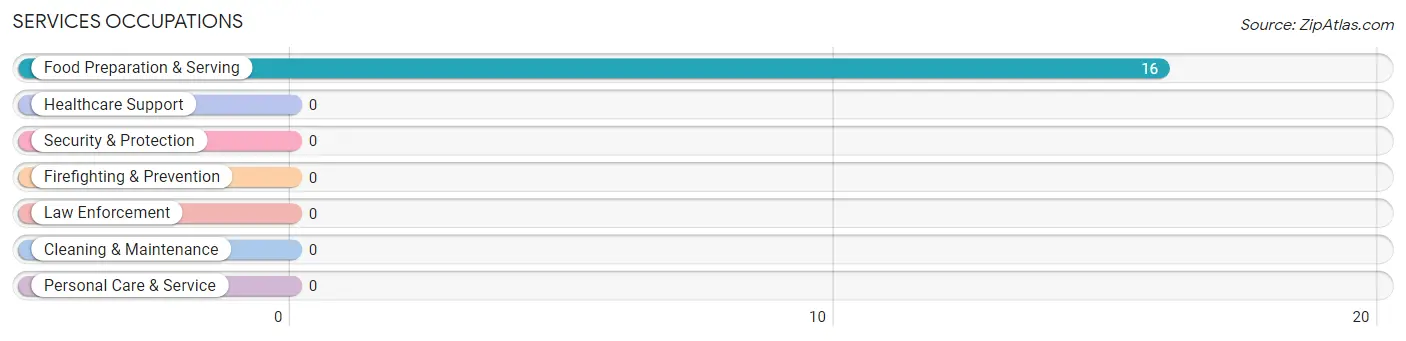
Services Occupations
The most common Services occupations in South Lancaster are , and Food Preparation & Serving (16 | 2.1%).
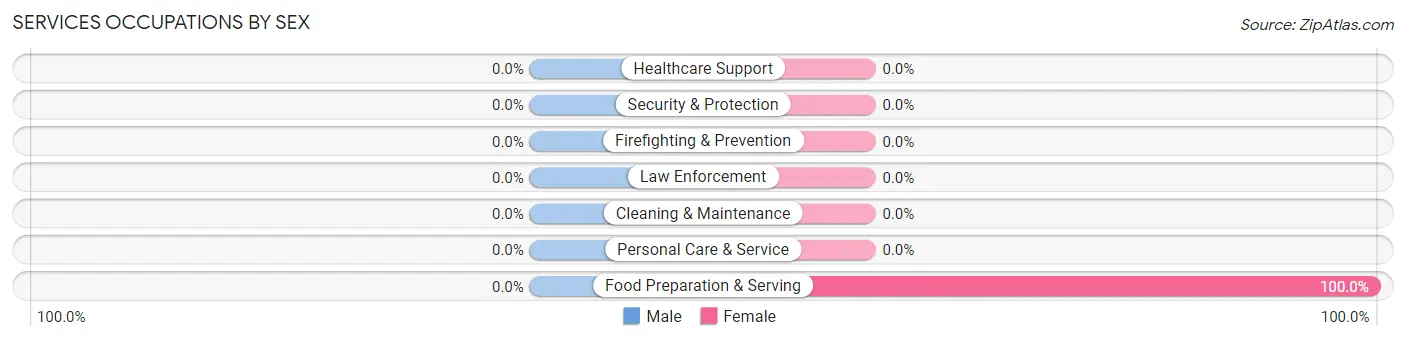
Services Occupations by Sex
| Occupation | Male | Female |
| Healthcare Support | 0 (0.0%) | 0 (0.0%) |
| Security & Protection | 0 (0.0%) | 0 (0.0%) |
| Firefighting & Prevention | 0 (0.0%) | 0 (0.0%) |
| Law Enforcement | 0 (0.0%) | 0 (0.0%) |
| Food Preparation & Serving | 0 (0.0%) | 16 (100.0%) |
| Cleaning & Maintenance | 0 (0.0%) | 0 (0.0%) |
| Personal Care & Service | 0 (0.0%) | 0 (0.0%) |
| Total (Category) | 0 (0.0%) | 16 (100.0%) |
| Total (Overall) | 372 (49.3%) | 382 (50.7%) |
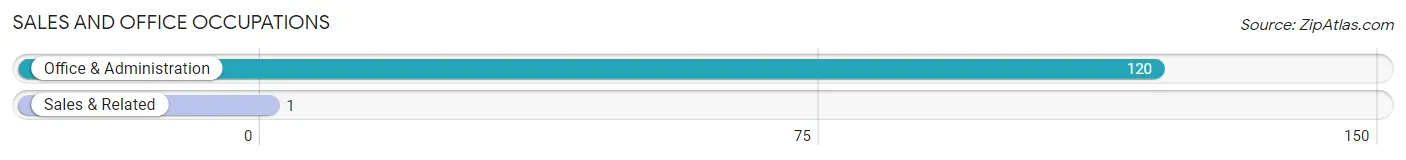
Sales and Office Occupations
The most common Sales and Office occupations in South Lancaster are Office & Administration (120 | 15.9%), and Sales & Related (1 | 0.1%).
Sales and Office Occupations by Sex
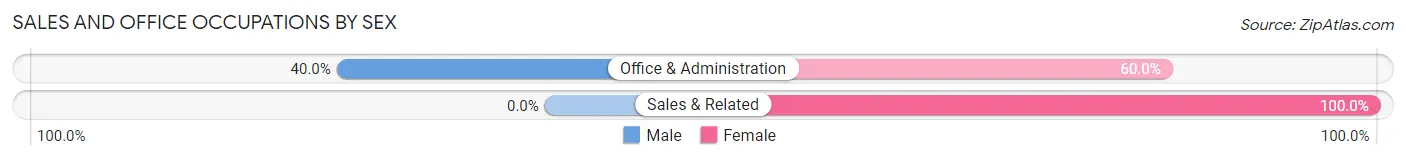
| Occupation | Male | Female |
| Sales & Related | 0 (0.0%) | 1 (100.0%) |
| Office & Administration | 48 (40.0%) | 72 (60.0%) |
| Total (Category) | 48 (39.7%) | 73 (60.3%) |
| Total (Overall) | 372 (49.3%) | 382 (50.7%) |
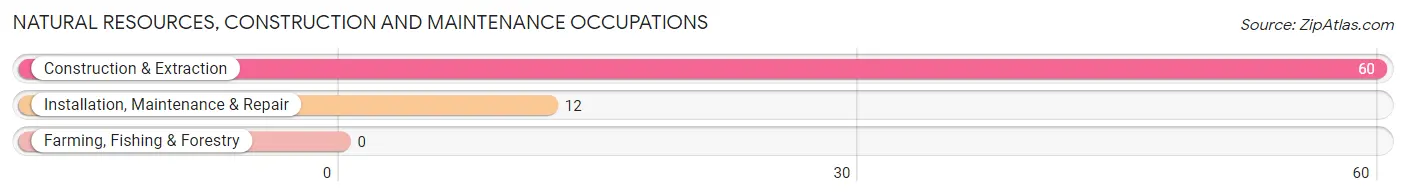
Natural Resources, Construction and Maintenance Occupations
The most common Natural Resources, Construction and Maintenance occupations in South Lancaster are Construction & Extraction (60 | 8.0%), and Installation, Maintenance & Repair (12 | 1.6%).
Natural Resources, Construction and Maintenance Occupations by Sex
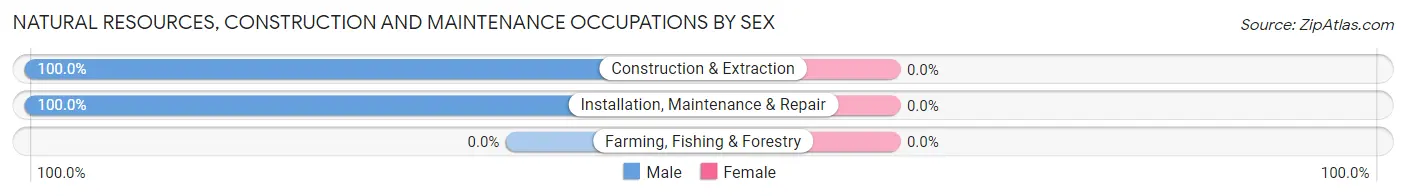
| Occupation | Male | Female |
| Farming, Fishing & Forestry | 0 (0.0%) | 0 (0.0%) |
| Construction & Extraction | 60 (100.0%) | 0 (0.0%) |
| Installation, Maintenance & Repair | 12 (100.0%) | 0 (0.0%) |
| Total (Category) | 72 (100.0%) | 0 (0.0%) |
| Total (Overall) | 372 (49.3%) | 382 (50.7%) |
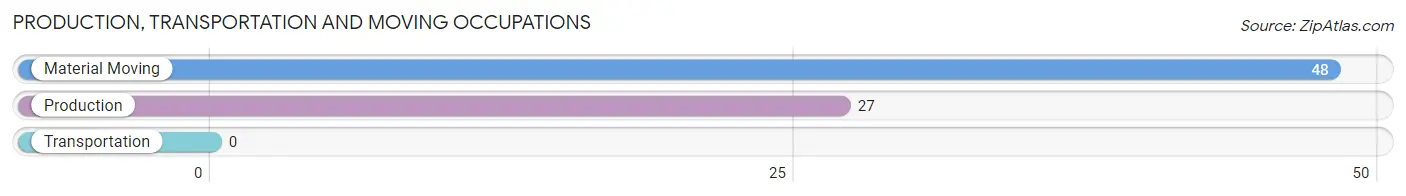
Production, Transportation and Moving Occupations
The most common Production, Transportation and Moving occupations in South Lancaster are Material Moving (48 | 6.4%), and Production (27 | 3.6%).
Production, Transportation and Moving Occupations by Sex
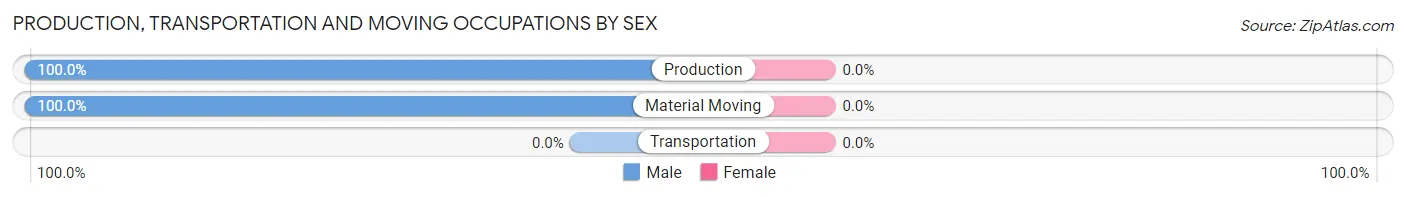
| Occupation | Male | Female |
| Production | 27 (100.0%) | 0 (0.0%) |
| Transportation | 0 (0.0%) | 0 (0.0%) |
| Material Moving | 48 (100.0%) | 0 (0.0%) |
| Total (Category) | 75 (100.0%) | 0 (0.0%) |
| Total (Overall) | 372 (49.3%) | 382 (50.7%) |
Employment Industries by Sex in South Lancaster
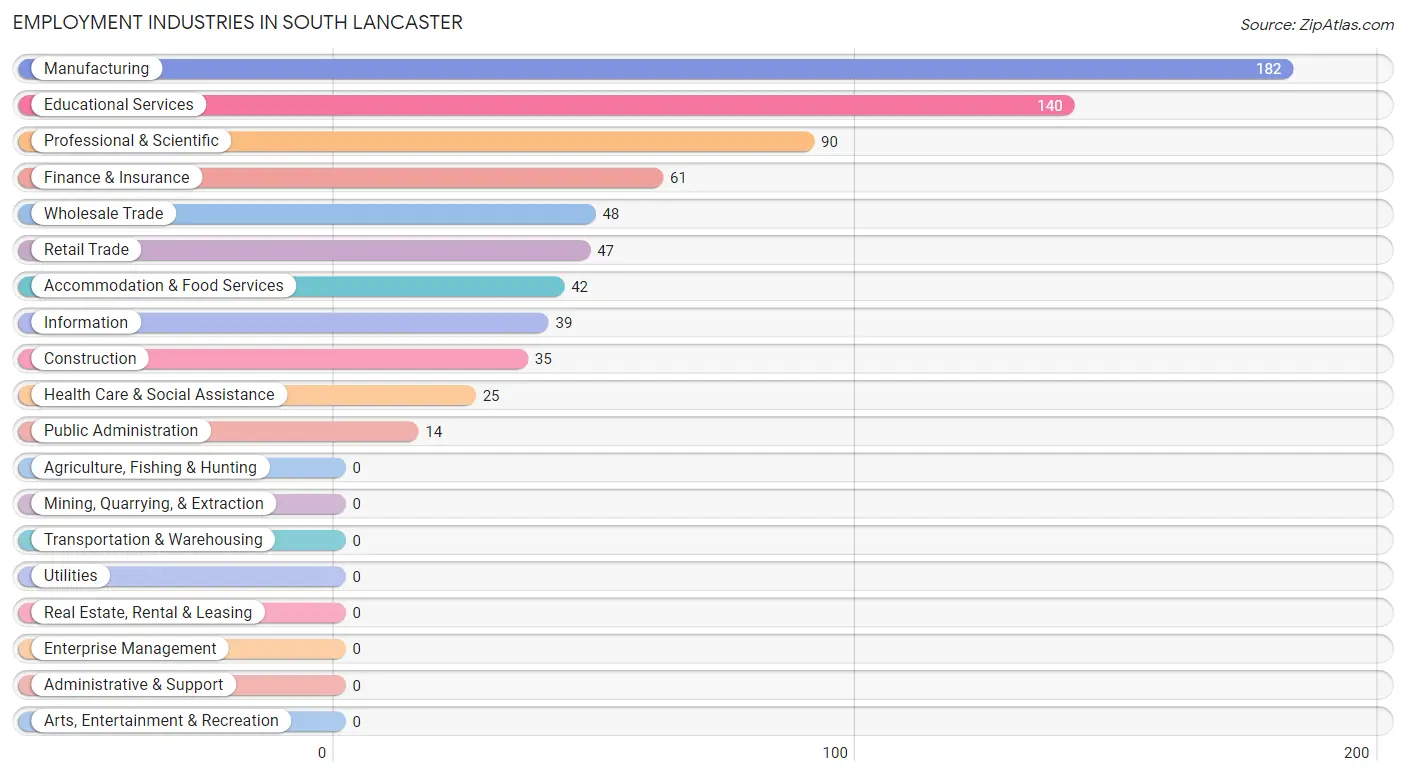
Employment Industries in South Lancaster
The major employment industries in South Lancaster include Manufacturing (182 | 24.1%), Educational Services (140 | 18.6%), Professional & Scientific (90 | 11.9%), Finance & Insurance (61 | 8.1%), and Wholesale Trade (48 | 6.4%).
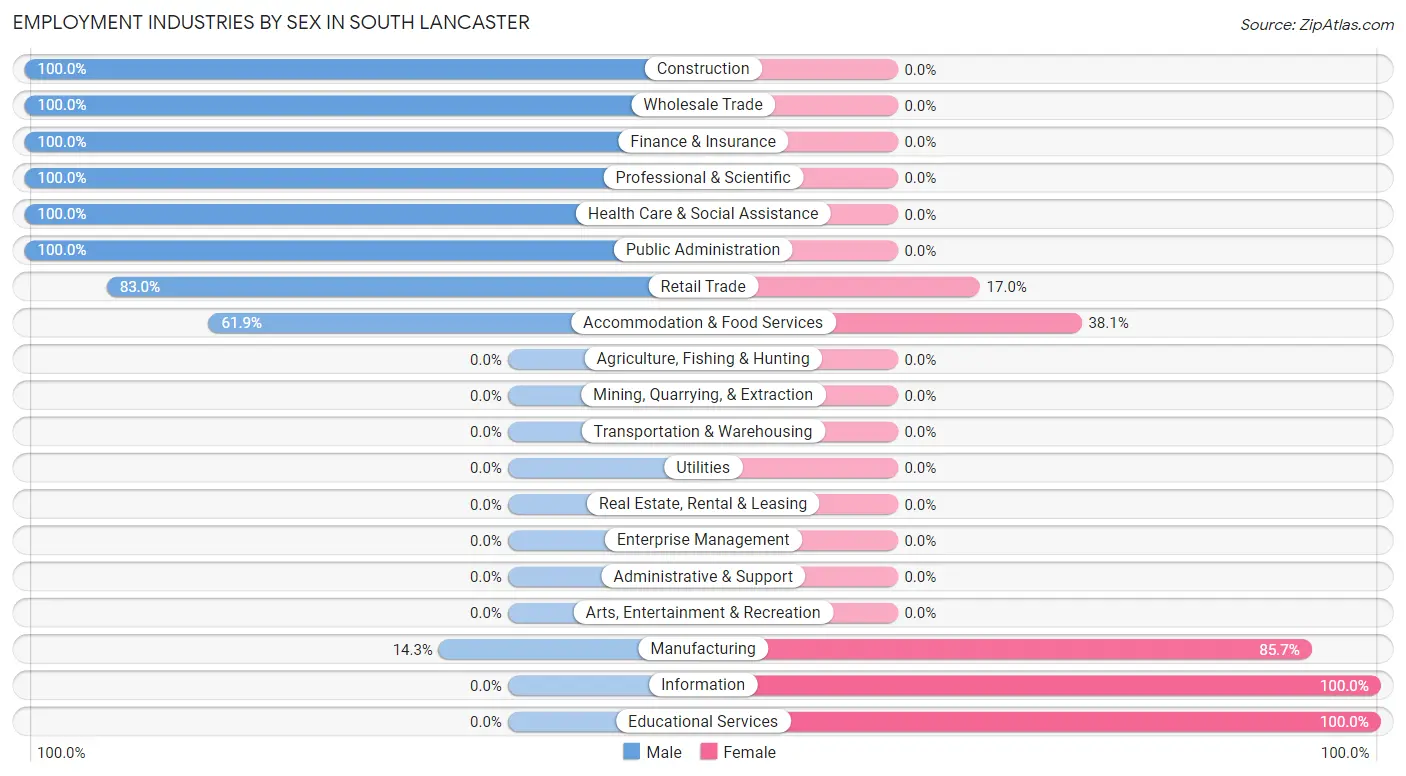
Employment Industries by Sex in South Lancaster
The South Lancaster industries that see more men than women are Construction (100.0%), Wholesale Trade (100.0%), and Finance & Insurance (100.0%), whereas the industries that tend to have a higher number of women are Information (100.0%), Educational Services (100.0%), and Manufacturing (85.7%).
| Industry | Male | Female |
| Agriculture, Fishing & Hunting | 0 (0.0%) | 0 (0.0%) |
| Mining, Quarrying, & Extraction | 0 (0.0%) | 0 (0.0%) |
| Construction | 35 (100.0%) | 0 (0.0%) |
| Manufacturing | 26 (14.3%) | 156 (85.7%) |
| Wholesale Trade | 48 (100.0%) | 0 (0.0%) |
| Retail Trade | 39 (83.0%) | 8 (17.0%) |
| Transportation & Warehousing | 0 (0.0%) | 0 (0.0%) |
| Utilities | 0 (0.0%) | 0 (0.0%) |
| Information | 0 (0.0%) | 39 (100.0%) |
| Finance & Insurance | 61 (100.0%) | 0 (0.0%) |
| Real Estate, Rental & Leasing | 0 (0.0%) | 0 (0.0%) |
| Professional & Scientific | 90 (100.0%) | 0 (0.0%) |
| Enterprise Management | 0 (0.0%) | 0 (0.0%) |
| Administrative & Support | 0 (0.0%) | 0 (0.0%) |
| Educational Services | 0 (0.0%) | 140 (100.0%) |
| Health Care & Social Assistance | 25 (100.0%) | 0 (0.0%) |
| Arts, Entertainment & Recreation | 0 (0.0%) | 0 (0.0%) |
| Accommodation & Food Services | 26 (61.9%) | 16 (38.1%) |
| Public Administration | 14 (100.0%) | 0 (0.0%) |
| Total | 372 (49.3%) | 382 (50.7%) |
Education in South Lancaster
School Enrollment in South Lancaster
The most common levels of schooling among the 338 students in South Lancaster are elementary school (140 | 41.4%), nursery / preschool (53 | 15.7%), and middle school (50 | 14.8%).
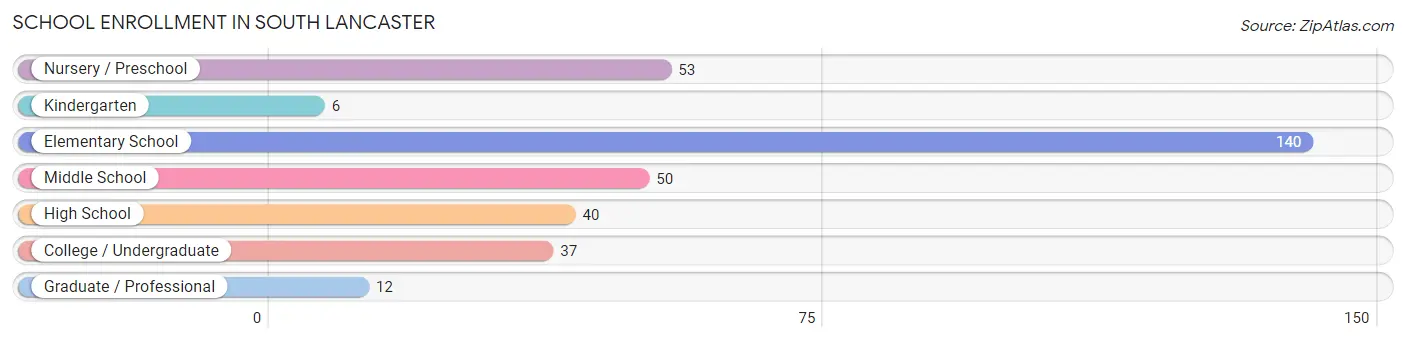
| School Level | # Students | % Students |
| Nursery / Preschool | 53 | 15.7% |
| Kindergarten | 6 | 1.8% |
| Elementary School | 140 | 41.4% |
| Middle School | 50 | 14.8% |
| High School | 40 | 11.8% |
| College / Undergraduate | 37 | 11.0% |
| Graduate / Professional | 12 | 3.5% |
| Total | 338 | 100.0% |
School Enrollment by Age by Funding Source in South Lancaster
Out of a total of 338 students who are enrolled in schools in South Lancaster, 37 (10.9%) attend a private institution, while the remaining 301 (89.1%) are enrolled in public schools. The age group of 3 to 4 year olds has the highest likelihood of being enrolled in private schools, with 24 (100.0% in the age bracket) enrolled. Conversely, the age group of 10 to 14 year olds has the lowest likelihood of being enrolled in a private school, with 65 (100.0% in the age bracket) attending a public institution.
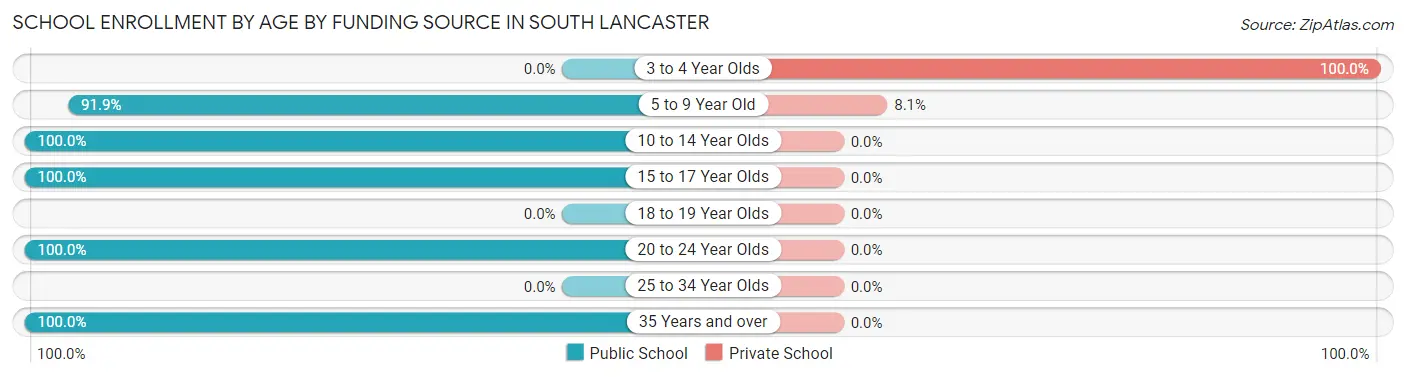
| Age Bracket | Public School | Private School |
| 3 to 4 Year Olds | 0 (0.0%) | 24 (100.0%) |
| 5 to 9 Year Old | 147 (91.9%) | 13 (8.1%) |
| 10 to 14 Year Olds | 65 (100.0%) | 0 (0.0%) |
| 15 to 17 Year Olds | 40 (100.0%) | 0 (0.0%) |
| 18 to 19 Year Olds | 0 (0.0%) | 0 (0.0%) |
| 20 to 24 Year Olds | 37 (100.0%) | 0 (0.0%) |
| 25 to 34 Year Olds | 0 (0.0%) | 0 (0.0%) |
| 35 Years and over | 12 (100.0%) | 0 (0.0%) |
| Total | 301 (89.1%) | 37 (10.9%) |
Educational Attainment by Field of Study in South Lancaster
Education (198 | 22.1%), business (174 | 19.4%), computers & mathematics (82 | 9.2%), bio, nature & agricultural (81 | 9.0%), and arts & humanities (63 | 7.0%) are the most common fields of study among 895 individuals in South Lancaster who have obtained a bachelor's degree or higher.
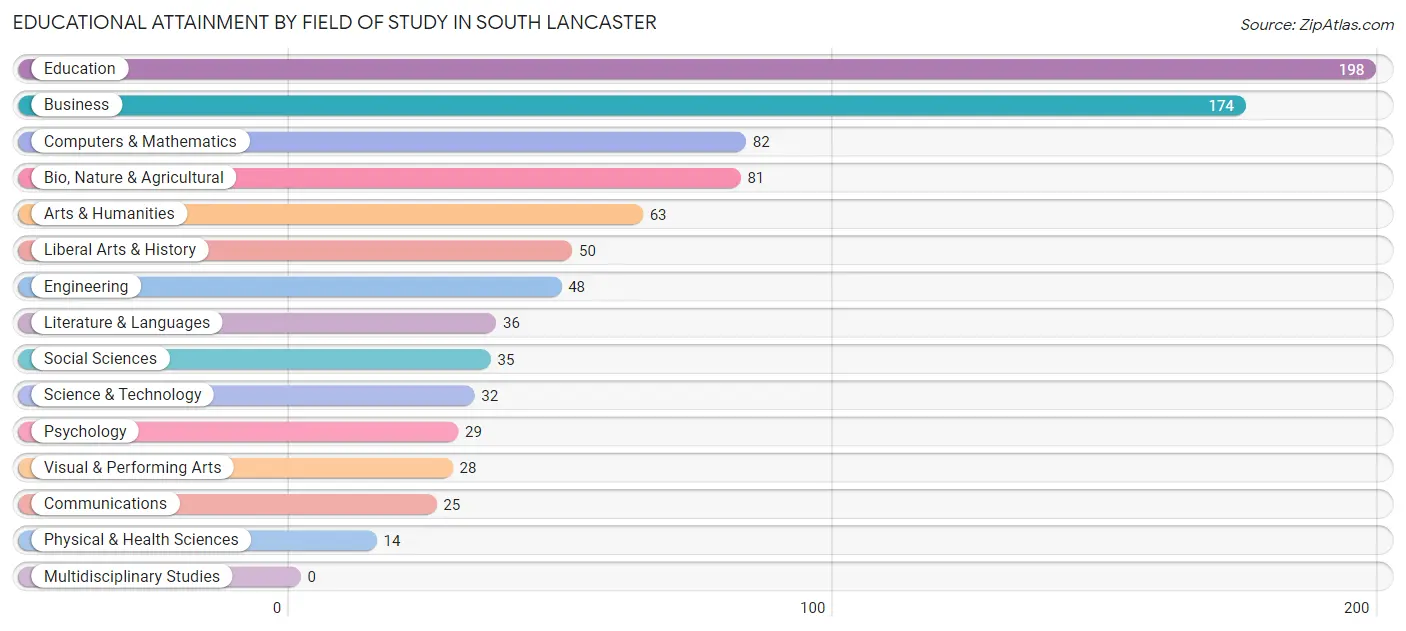
| Field of Study | # Graduates | % Graduates |
| Computers & Mathematics | 82 | 9.2% |
| Bio, Nature & Agricultural | 81 | 9.0% |
| Physical & Health Sciences | 14 | 1.6% |
| Psychology | 29 | 3.2% |
| Social Sciences | 35 | 3.9% |
| Engineering | 48 | 5.4% |
| Multidisciplinary Studies | 0 | 0.0% |
| Science & Technology | 32 | 3.6% |
| Business | 174 | 19.4% |
| Education | 198 | 22.1% |
| Literature & Languages | 36 | 4.0% |
| Liberal Arts & History | 50 | 5.6% |
| Visual & Performing Arts | 28 | 3.1% |
| Communications | 25 | 2.8% |
| Arts & Humanities | 63 | 7.0% |
| Total | 895 | 100.0% |
Transportation & Commute in South Lancaster
Vehicle Availability by Sex in South Lancaster
The most prevalent vehicle ownership categories in South Lancaster are males with 3 vehicles (169, accounting for 45.4%) and females with 3 vehicles (35, making up 49.8%).
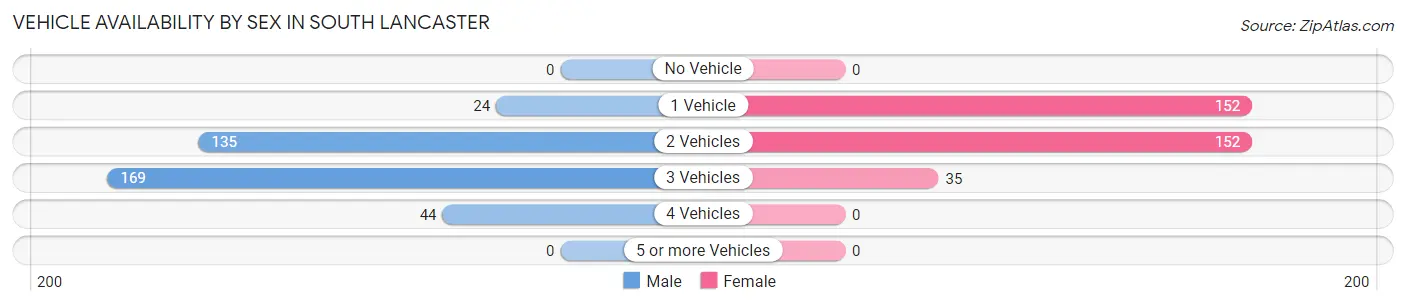
| Vehicles Available | Male | Female |
| No Vehicle | 0 (0.0%) | 0 (0.0%) |
| 1 Vehicle | 24 (6.5%) | 152 (44.8%) |
| 2 Vehicles | 135 (36.3%) | 152 (44.8%) |
| 3 Vehicles | 169 (45.4%) | 35 (10.3%) |
| 4 Vehicles | 44 (11.8%) | 0 (0.0%) |
| 5 or more Vehicles | 0 (0.0%) | 0 (0.0%) |
| Total | 372 (100.0%) | 339 (100.0%) |
Commute Time in South Lancaster
The most frequently occuring commute durations in South Lancaster are 60 to 89 minutes (118 commuters, 27.8%), 45 to 59 minutes (76 commuters, 17.9%), and 40 to 44 minutes (48 commuters, 11.3%).
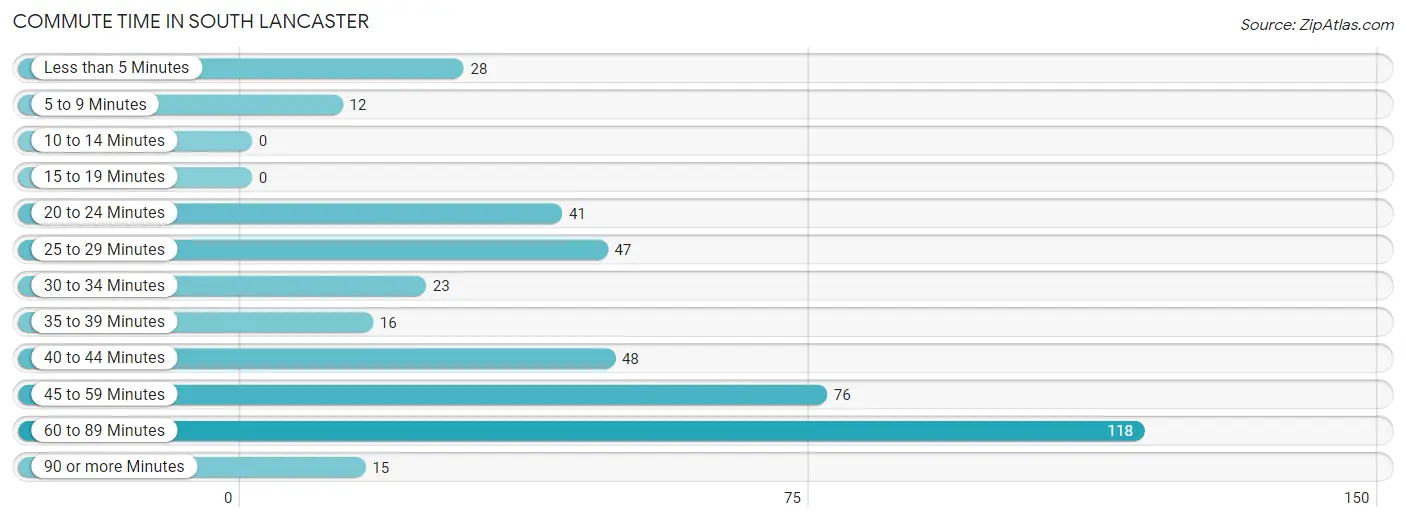
| Commute Time | # Commuters | % Commuters |
| Less than 5 Minutes | 28 | 6.6% |
| 5 to 9 Minutes | 12 | 2.8% |
| 10 to 14 Minutes | 0 | 0.0% |
| 15 to 19 Minutes | 0 | 0.0% |
| 20 to 24 Minutes | 41 | 9.7% |
| 25 to 29 Minutes | 47 | 11.1% |
| 30 to 34 Minutes | 23 | 5.4% |
| 35 to 39 Minutes | 16 | 3.8% |
| 40 to 44 Minutes | 48 | 11.3% |
| 45 to 59 Minutes | 76 | 17.9% |
| 60 to 89 Minutes | 118 | 27.8% |
| 90 or more Minutes | 15 | 3.5% |
Commute Time by Sex in South Lancaster
The most common commute times in South Lancaster are 60 to 89 minutes (118 commuters, 45.0%) for males and 25 to 29 minutes (47 commuters, 29.0%) for females.
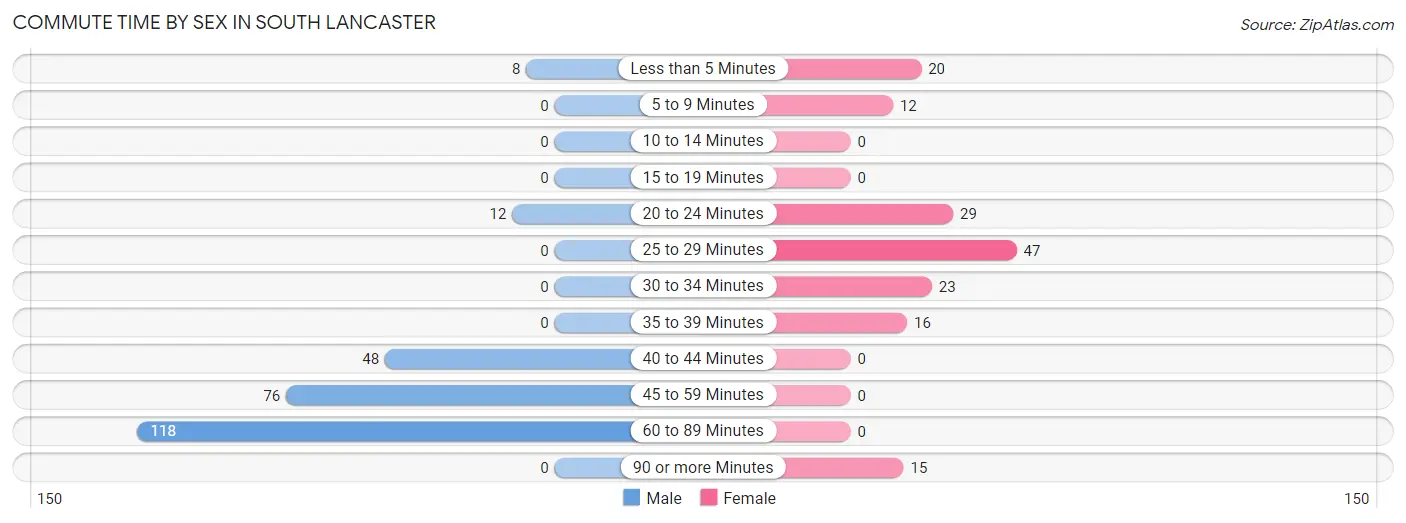
| Commute Time | Male | Female |
| Less than 5 Minutes | 8 (3.0%) | 20 (12.3%) |
| 5 to 9 Minutes | 0 (0.0%) | 12 (7.4%) |
| 10 to 14 Minutes | 0 (0.0%) | 0 (0.0%) |
| 15 to 19 Minutes | 0 (0.0%) | 0 (0.0%) |
| 20 to 24 Minutes | 12 (4.6%) | 29 (17.9%) |
| 25 to 29 Minutes | 0 (0.0%) | 47 (29.0%) |
| 30 to 34 Minutes | 0 (0.0%) | 23 (14.2%) |
| 35 to 39 Minutes | 0 (0.0%) | 16 (9.9%) |
| 40 to 44 Minutes | 48 (18.3%) | 0 (0.0%) |
| 45 to 59 Minutes | 76 (29.0%) | 0 (0.0%) |
| 60 to 89 Minutes | 118 (45.0%) | 0 (0.0%) |
| 90 or more Minutes | 0 (0.0%) | 15 (9.3%) |
Time of Departure to Work by Sex in South Lancaster
The most frequent times of departure to work in South Lancaster are 5:00 AM to 5:29 AM (69, 26.3%) for males and 7:00 AM to 7:29 AM (90, 55.6%) for females.
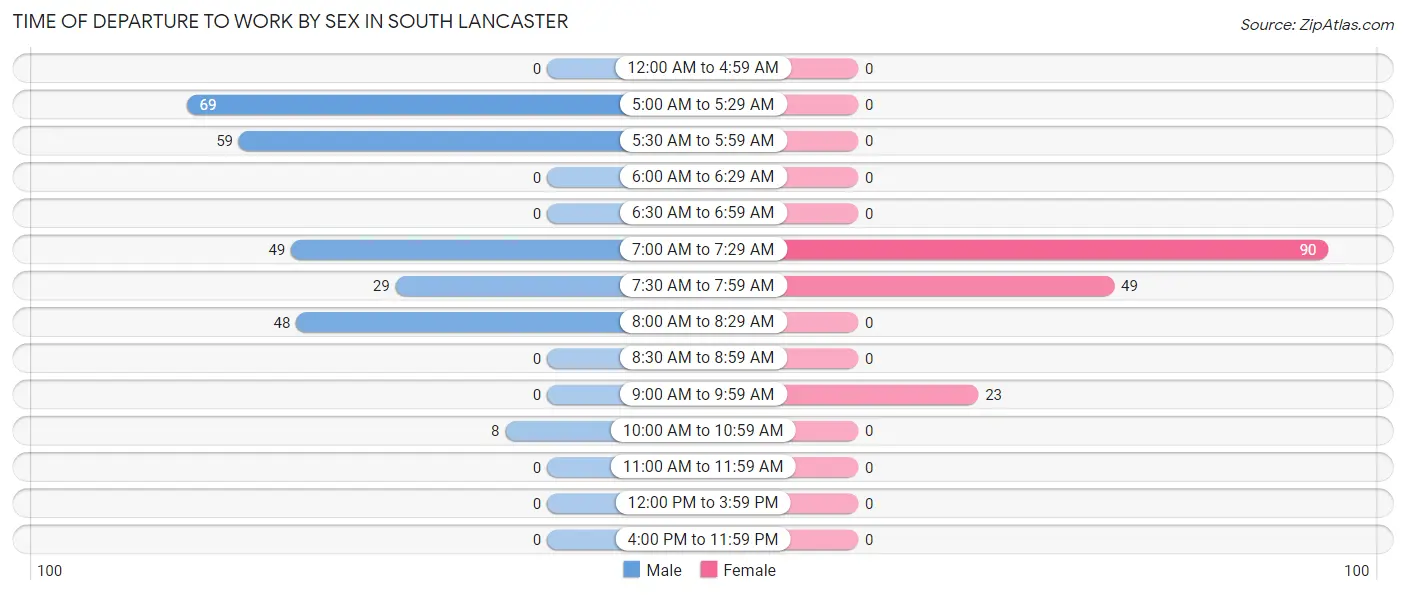
| Time of Departure | Male | Female |
| 12:00 AM to 4:59 AM | 0 (0.0%) | 0 (0.0%) |
| 5:00 AM to 5:29 AM | 69 (26.3%) | 0 (0.0%) |
| 5:30 AM to 5:59 AM | 59 (22.5%) | 0 (0.0%) |
| 6:00 AM to 6:29 AM | 0 (0.0%) | 0 (0.0%) |
| 6:30 AM to 6:59 AM | 0 (0.0%) | 0 (0.0%) |
| 7:00 AM to 7:29 AM | 49 (18.7%) | 90 (55.6%) |
| 7:30 AM to 7:59 AM | 29 (11.1%) | 49 (30.2%) |
| 8:00 AM to 8:29 AM | 48 (18.3%) | 0 (0.0%) |
| 8:30 AM to 8:59 AM | 0 (0.0%) | 0 (0.0%) |
| 9:00 AM to 9:59 AM | 0 (0.0%) | 23 (14.2%) |
| 10:00 AM to 10:59 AM | 8 (3.0%) | 0 (0.0%) |
| 11:00 AM to 11:59 AM | 0 (0.0%) | 0 (0.0%) |
| 12:00 PM to 3:59 PM | 0 (0.0%) | 0 (0.0%) |
| 4:00 PM to 11:59 PM | 0 (0.0%) | 0 (0.0%) |
| Total | 262 (100.0%) | 162 (100.0%) |
Housing Occupancy in South Lancaster
Occupancy by Ownership in South Lancaster
Of the total 733 dwellings in South Lancaster, owner-occupied units account for 513 (70.0%), while renter-occupied units make up 220 (30.0%).
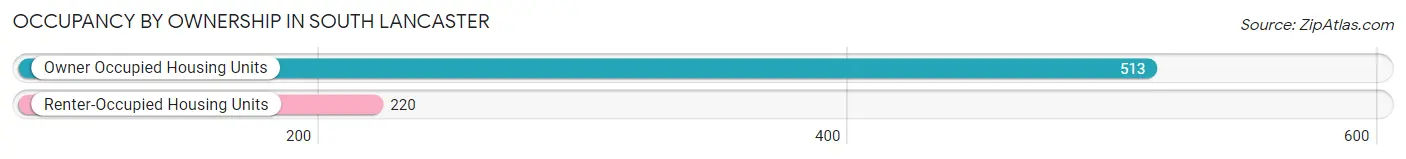
| Occupancy | # Housing Units | % Housing Units |
| Owner Occupied Housing Units | 513 | 70.0% |
| Renter-Occupied Housing Units | 220 | 30.0% |
| Total Occupied Housing Units | 733 | 100.0% |
Occupancy by Household Size in South Lancaster
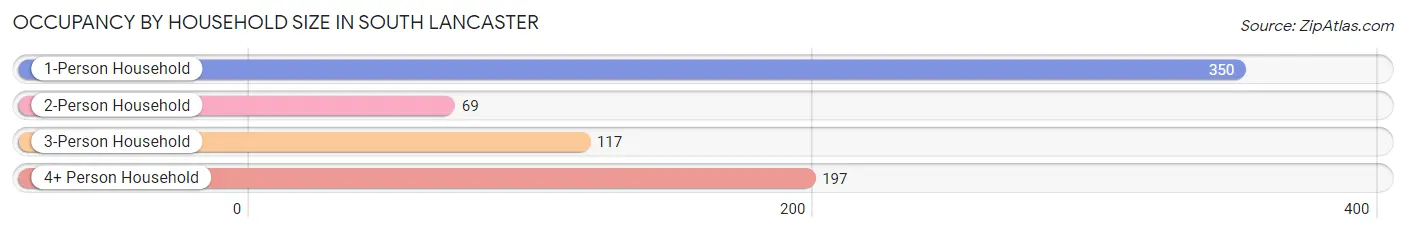
| Household Size | # Housing Units | % Housing Units |
| 1-Person Household | 350 | 47.7% |
| 2-Person Household | 69 | 9.4% |
| 3-Person Household | 117 | 16.0% |
| 4+ Person Household | 197 | 26.9% |
| Total Housing Units | 733 | 100.0% |
Occupancy by Ownership by Household Size in South Lancaster
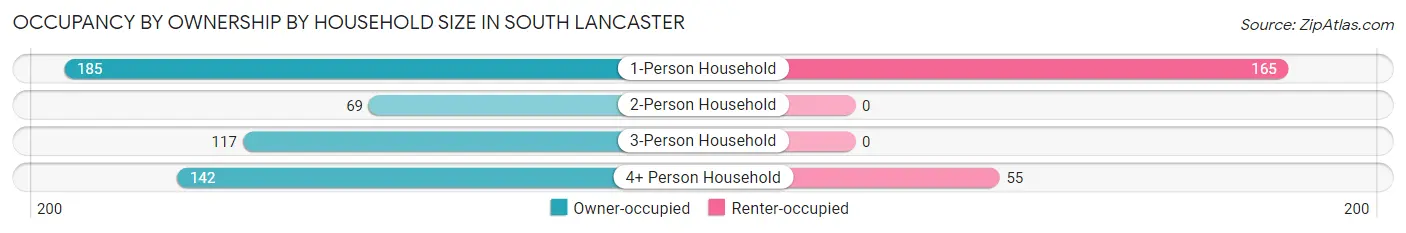
| Household Size | Owner-occupied | Renter-occupied |
| 1-Person Household | 185 (52.9%) | 165 (47.1%) |
| 2-Person Household | 69 (100.0%) | 0 (0.0%) |
| 3-Person Household | 117 (100.0%) | 0 (0.0%) |
| 4+ Person Household | 142 (72.1%) | 55 (27.9%) |
| Total Housing Units | 513 (70.0%) | 220 (30.0%) |
Occupancy by Educational Attainment in South Lancaster
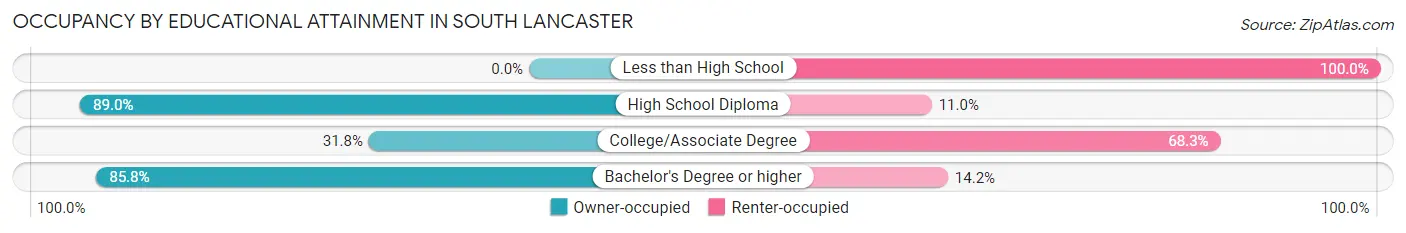
| Household Size | Owner-occupied | Renter-occupied |
| Less than High School | 0 (0.0%) | 60 (100.0%) |
| High School Diploma | 105 (89.0%) | 13 (11.0%) |
| College/Associate Degree | 40 (31.8%) | 86 (68.2%) |
| Bachelor's Degree or higher | 368 (85.8%) | 61 (14.2%) |
Occupancy by Age of Householder in South Lancaster
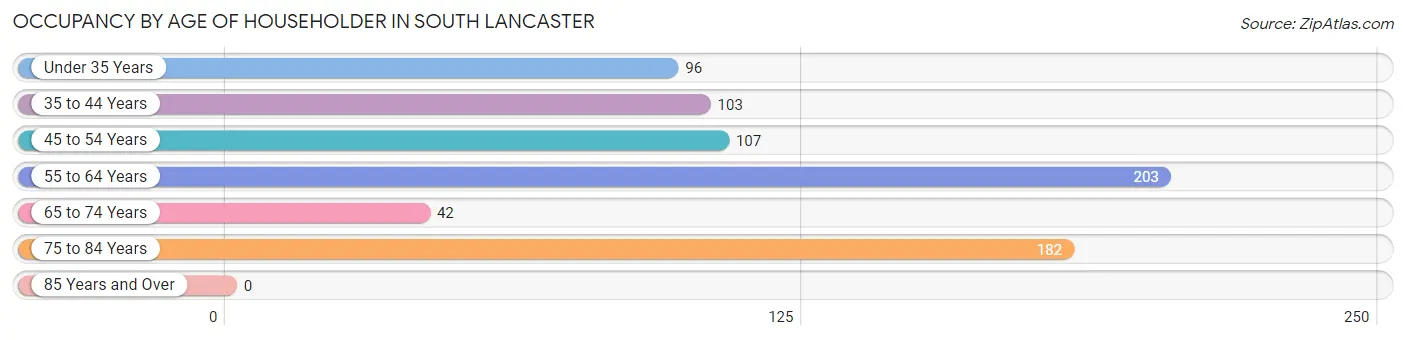
| Age Bracket | # Households | % Households |
| Under 35 Years | 96 | 13.1% |
| 35 to 44 Years | 103 | 14.1% |
| 45 to 54 Years | 107 | 14.6% |
| 55 to 64 Years | 203 | 27.7% |
| 65 to 74 Years | 42 | 5.7% |
| 75 to 84 Years | 182 | 24.8% |
| 85 Years and Over | 0 | 0.0% |
| Total | 733 | 100.0% |
Housing Finances in South Lancaster
Median Income by Occupancy in South Lancaster
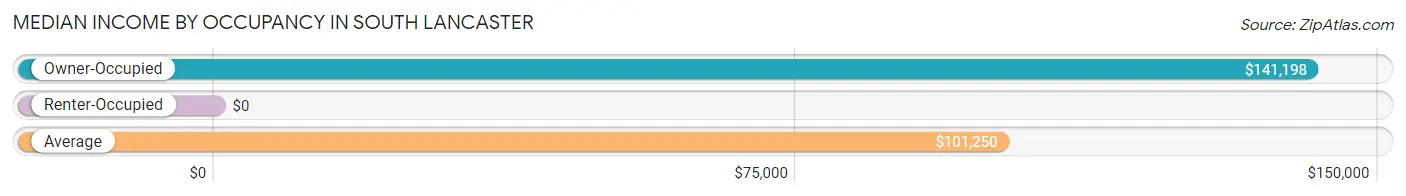
| Occupancy Type | # Households | Median Income |
| Owner-Occupied | 513 (70.0%) | $141,198 |
| Renter-Occupied | 220 (30.0%) | $0 |
| Average | 733 (100.0%) | $101,250 |
Occupancy by Householder Income Bracket in South Lancaster
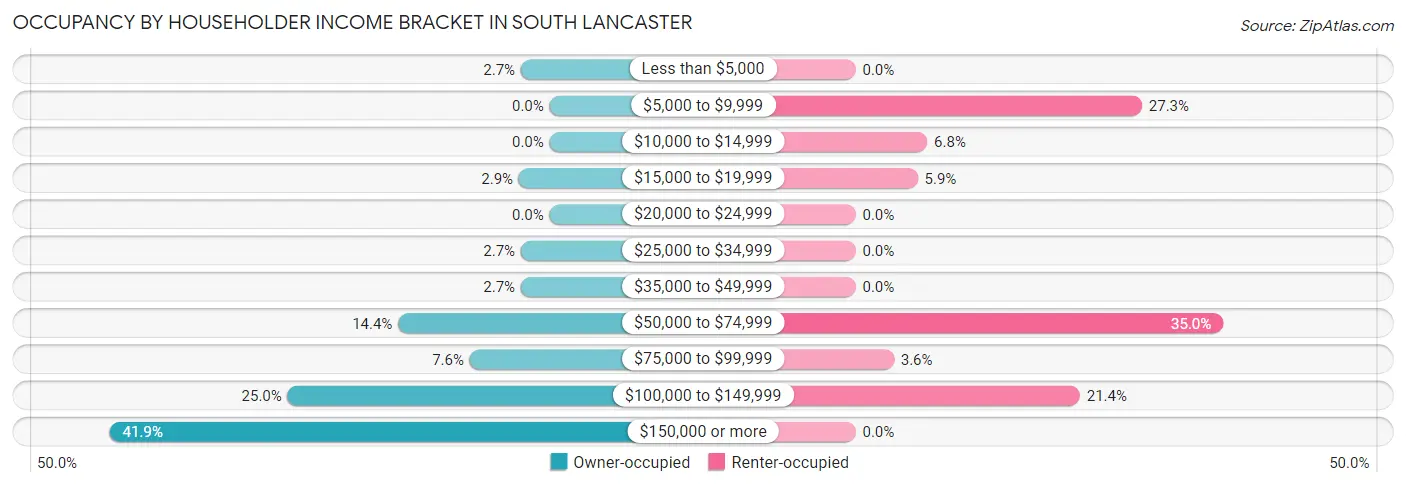
| Income Bracket | Owner-occupied | Renter-occupied |
| Less than $5,000 | 14 (2.7%) | 0 (0.0%) |
| $5,000 to $9,999 | 0 (0.0%) | 60 (27.3%) |
| $10,000 to $14,999 | 0 (0.0%) | 15 (6.8%) |
| $15,000 to $19,999 | 15 (2.9%) | 13 (5.9%) |
| $20,000 to $24,999 | 0 (0.0%) | 0 (0.0%) |
| $25,000 to $34,999 | 14 (2.7%) | 0 (0.0%) |
| $35,000 to $49,999 | 14 (2.7%) | 0 (0.0%) |
| $50,000 to $74,999 | 74 (14.4%) | 77 (35.0%) |
| $75,000 to $99,999 | 39 (7.6%) | 8 (3.6%) |
| $100,000 to $149,999 | 128 (24.9%) | 47 (21.4%) |
| $150,000 or more | 215 (41.9%) | 0 (0.0%) |
| Total | 513 (100.0%) | 220 (100.0%) |
Monthly Housing Cost Tiers in South Lancaster
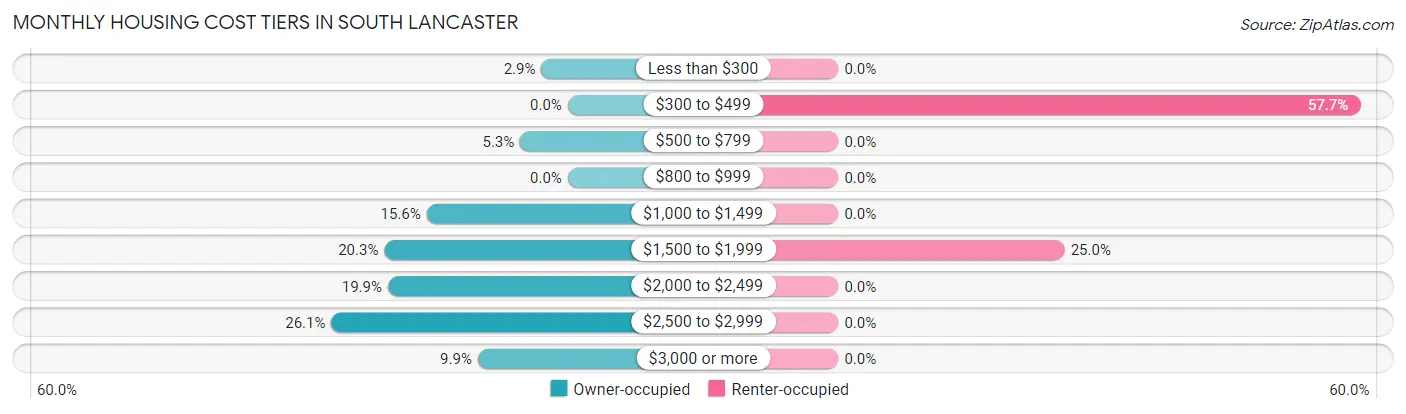
| Monthly Cost | Owner-occupied | Renter-occupied |
| Less than $300 | 15 (2.9%) | 0 (0.0%) |
| $300 to $499 | 0 (0.0%) | 127 (57.7%) |
| $500 to $799 | 27 (5.3%) | 0 (0.0%) |
| $800 to $999 | 0 (0.0%) | 0 (0.0%) |
| $1,000 to $1,499 | 80 (15.6%) | 0 (0.0%) |
| $1,500 to $1,999 | 104 (20.3%) | 55 (25.0%) |
| $2,000 to $2,499 | 102 (19.9%) | 0 (0.0%) |
| $2,500 to $2,999 | 134 (26.1%) | 0 (0.0%) |
| $3,000 or more | 51 (9.9%) | 0 (0.0%) |
| Total | 513 (100.0%) | 220 (100.0%) |
Physical Housing Characteristics in South Lancaster
Housing Structures in South Lancaster
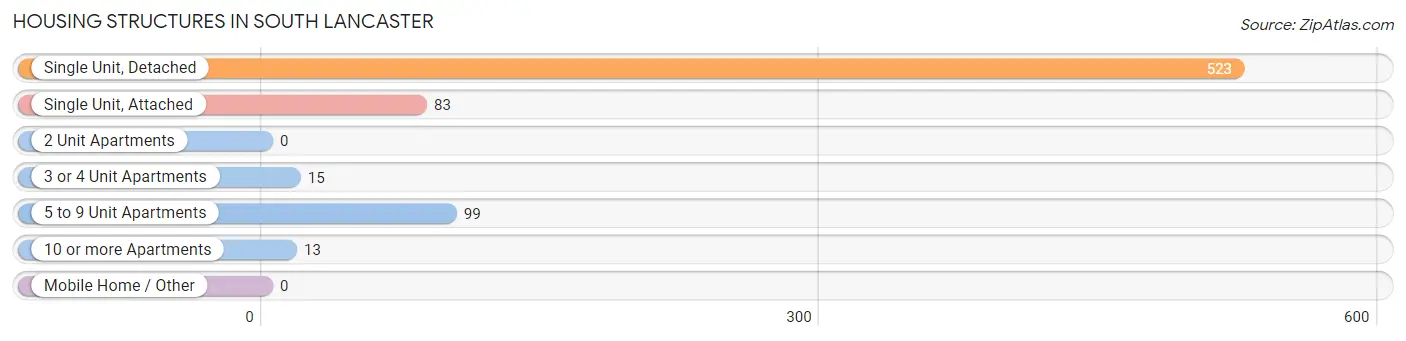
| Structure Type | # Housing Units | % Housing Units |
| Single Unit, Detached | 523 | 71.4% |
| Single Unit, Attached | 83 | 11.3% |
| 2 Unit Apartments | 0 | 0.0% |
| 3 or 4 Unit Apartments | 15 | 2.1% |
| 5 to 9 Unit Apartments | 99 | 13.5% |
| 10 or more Apartments | 13 | 1.8% |
| Mobile Home / Other | 0 | 0.0% |
| Total | 733 | 100.0% |
Housing Structures by Occupancy in South Lancaster
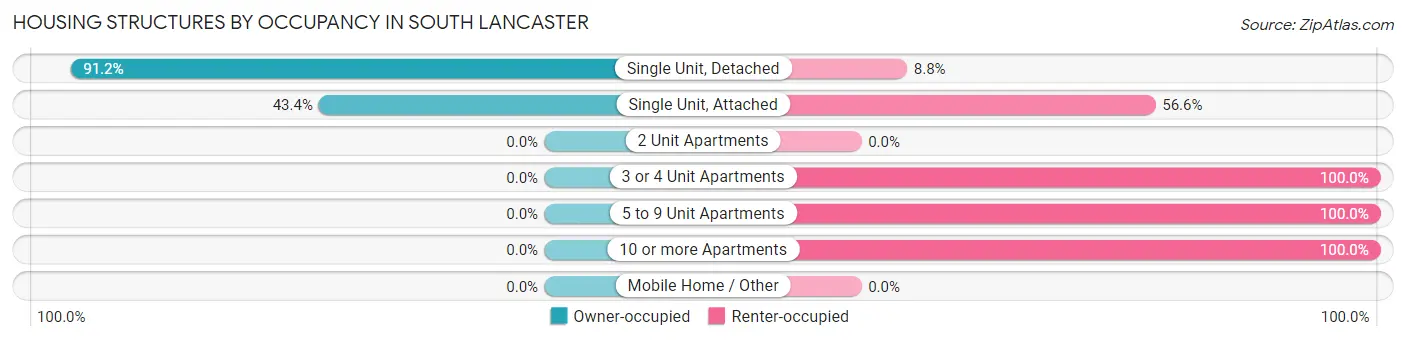
| Structure Type | Owner-occupied | Renter-occupied |
| Single Unit, Detached | 477 (91.2%) | 46 (8.8%) |
| Single Unit, Attached | 36 (43.4%) | 47 (56.6%) |
| 2 Unit Apartments | 0 (0.0%) | 0 (0.0%) |
| 3 or 4 Unit Apartments | 0 (0.0%) | 15 (100.0%) |
| 5 to 9 Unit Apartments | 0 (0.0%) | 99 (100.0%) |
| 10 or more Apartments | 0 (0.0%) | 13 (100.0%) |
| Mobile Home / Other | 0 (0.0%) | 0 (0.0%) |
| Total | 513 (70.0%) | 220 (30.0%) |
Housing Structures by Number of Rooms in South Lancaster
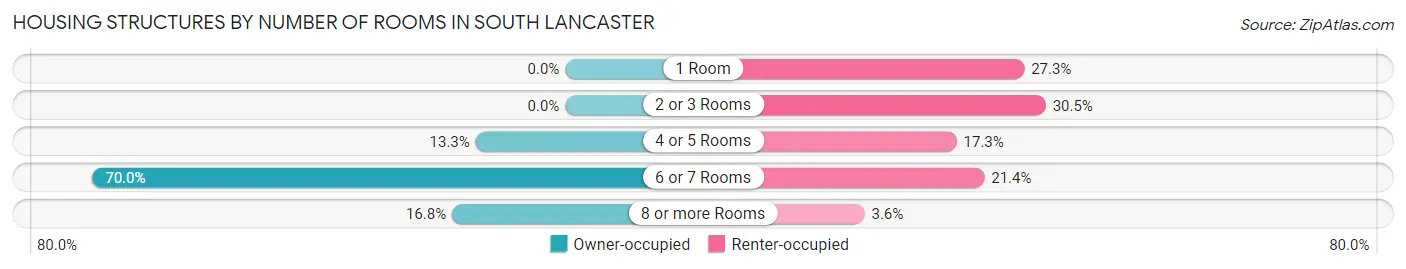
| Number of Rooms | Owner-occupied | Renter-occupied |
| 1 Room | 0 (0.0%) | 60 (27.3%) |
| 2 or 3 Rooms | 0 (0.0%) | 67 (30.4%) |
| 4 or 5 Rooms | 68 (13.3%) | 38 (17.3%) |
| 6 or 7 Rooms | 359 (70.0%) | 47 (21.4%) |
| 8 or more Rooms | 86 (16.8%) | 8 (3.6%) |
| Total | 513 (100.0%) | 220 (100.0%) |
Housing Structure by Heating Type in South Lancaster
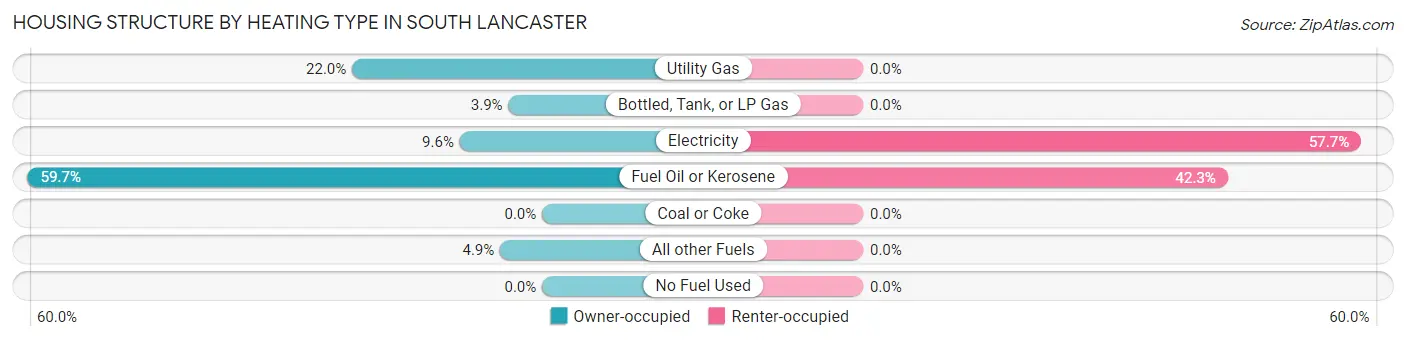
| Heating Type | Owner-occupied | Renter-occupied |
| Utility Gas | 113 (22.0%) | 0 (0.0%) |
| Bottled, Tank, or LP Gas | 20 (3.9%) | 0 (0.0%) |
| Electricity | 49 (9.6%) | 127 (57.7%) |
| Fuel Oil or Kerosene | 306 (59.7%) | 93 (42.3%) |
| Coal or Coke | 0 (0.0%) | 0 (0.0%) |
| All other Fuels | 25 (4.9%) | 0 (0.0%) |
| No Fuel Used | 0 (0.0%) | 0 (0.0%) |
| Total | 513 (100.0%) | 220 (100.0%) |
Household Vehicle Usage in South Lancaster
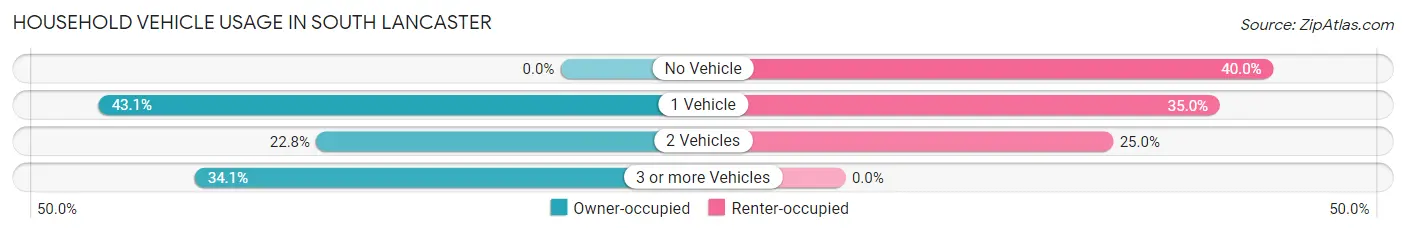
| Vehicles per Household | Owner-occupied | Renter-occupied |
| No Vehicle | 0 (0.0%) | 88 (40.0%) |
| 1 Vehicle | 221 (43.1%) | 77 (35.0%) |
| 2 Vehicles | 117 (22.8%) | 55 (25.0%) |
| 3 or more Vehicles | 175 (34.1%) | 0 (0.0%) |
| Total | 513 (100.0%) | 220 (100.0%) |
Real Estate & Mortgages in South Lancaster
Real Estate and Mortgage Overview in South Lancaster
| Characteristic | Without Mortgage | With Mortgage |
| Housing Units | 68 | 445 |
| Median Property Value | $346,300 | $337,900 |
| Median Household Income | $86,042 | $215 |
| Monthly Housing Costs | - | - |
| Real Estate Taxes | - | - |
Property Value by Mortgage Status in South Lancaster
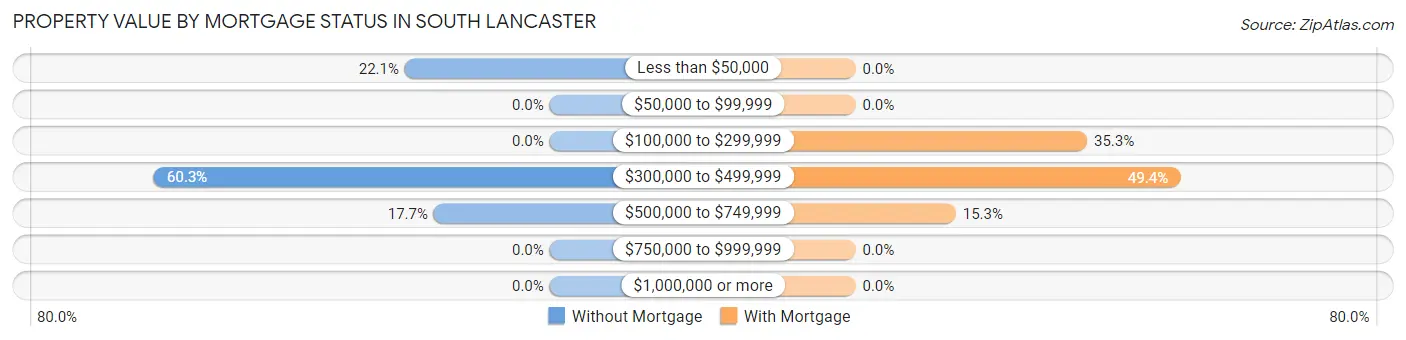
| Property Value | Without Mortgage | With Mortgage |
| Less than $50,000 | 15 (22.1%) | 0 (0.0%) |
| $50,000 to $99,999 | 0 (0.0%) | 0 (0.0%) |
| $100,000 to $299,999 | 0 (0.0%) | 157 (35.3%) |
| $300,000 to $499,999 | 41 (60.3%) | 220 (49.4%) |
| $500,000 to $749,999 | 12 (17.6%) | 68 (15.3%) |
| $750,000 to $999,999 | 0 (0.0%) | 0 (0.0%) |
| $1,000,000 or more | 0 (0.0%) | 0 (0.0%) |
| Total | 68 (100.0%) | 445 (100.0%) |
Household Income by Mortgage Status in South Lancaster
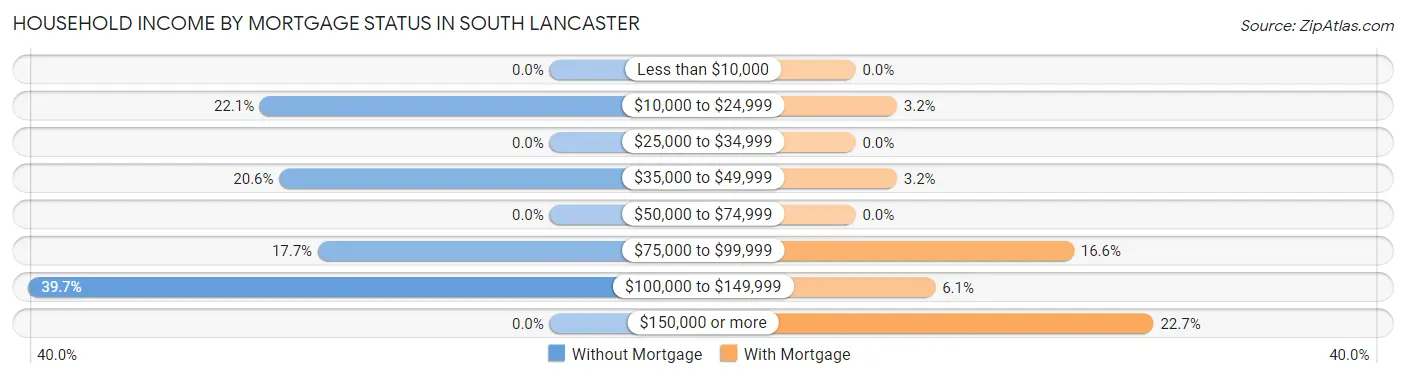
| Household Income | Without Mortgage | With Mortgage |
| Less than $10,000 | 0 (0.0%) | 0 (0.0%) |
| $10,000 to $24,999 | 15 (22.1%) | 14 (3.2%) |
| $25,000 to $34,999 | 0 (0.0%) | 0 (0.0%) |
| $35,000 to $49,999 | 14 (20.6%) | 14 (3.2%) |
| $50,000 to $74,999 | 0 (0.0%) | 0 (0.0%) |
| $75,000 to $99,999 | 12 (17.6%) | 74 (16.6%) |
| $100,000 to $149,999 | 27 (39.7%) | 27 (6.1%) |
| $150,000 or more | 0 (0.0%) | 101 (22.7%) |
| Total | 68 (100.0%) | 445 (100.0%) |
Property Value to Household Income Ratio in South Lancaster
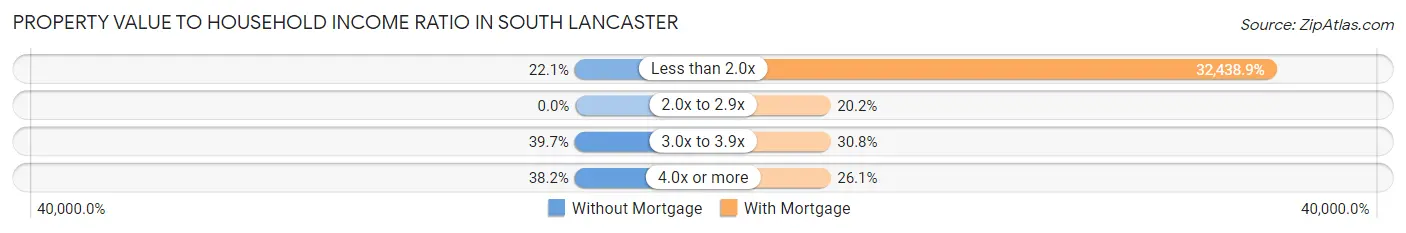
| Value-to-Income Ratio | Without Mortgage | With Mortgage |
| Less than 2.0x | 15 (22.1%) | 144,353 (32,438.9%) |
| 2.0x to 2.9x | 0 (0.0%) | 90 (20.2%) |
| 3.0x to 3.9x | 27 (39.7%) | 137 (30.8%) |
| 4.0x or more | 26 (38.2%) | 116 (26.1%) |
| Total | 68 (100.0%) | 445 (100.0%) |
Real Estate Taxes by Mortgage Status in South Lancaster
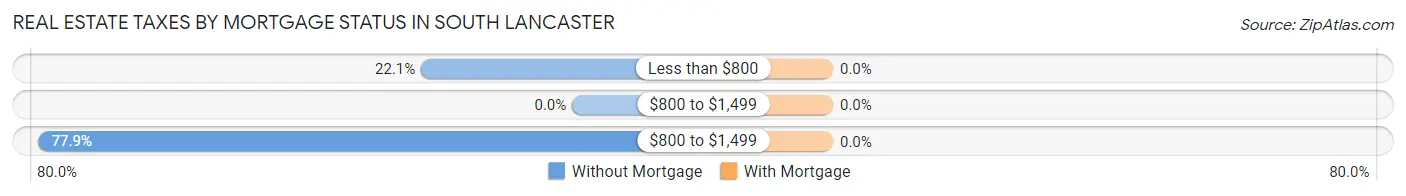
| Property Taxes | Without Mortgage | With Mortgage |
| Less than $800 | 15 (22.1%) | 0 (0.0%) |
| $800 to $1,499 | 0 (0.0%) | 0 (0.0%) |
| $800 to $1,499 | 53 (77.9%) | 0 (0.0%) |
| Total | 68 (100.0%) | 445 (100.0%) |
Health & Disability in South Lancaster
Health Insurance Coverage by Age in South Lancaster
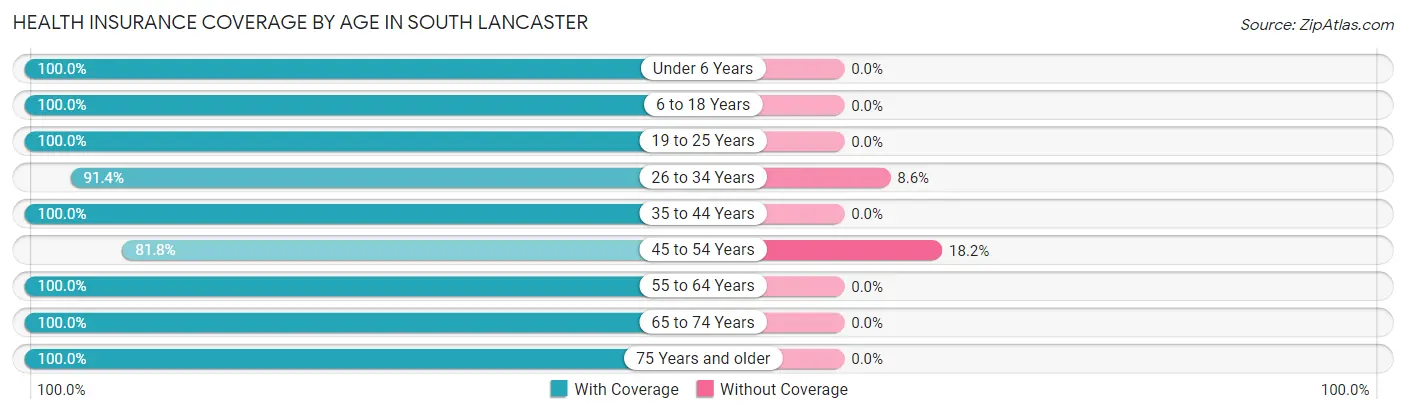
| Age Bracket | With Coverage | Without Coverage |
| Under 6 Years | 115 (100.0%) | 0 (0.0%) |
| 6 to 18 Years | 230 (100.0%) | 0 (0.0%) |
| 19 to 25 Years | 110 (100.0%) | 0 (0.0%) |
| 26 to 34 Years | 234 (91.4%) | 22 (8.6%) |
| 35 to 44 Years | 199 (100.0%) | 0 (0.0%) |
| 45 to 54 Years | 121 (81.8%) | 27 (18.2%) |
| 55 to 64 Years | 304 (100.0%) | 0 (0.0%) |
| 65 to 74 Years | 83 (100.0%) | 0 (0.0%) |
| 75 Years and older | 197 (100.0%) | 0 (0.0%) |
| Total | 1,593 (97.0%) | 49 (3.0%) |
Health Insurance Coverage by Citizenship Status in South Lancaster
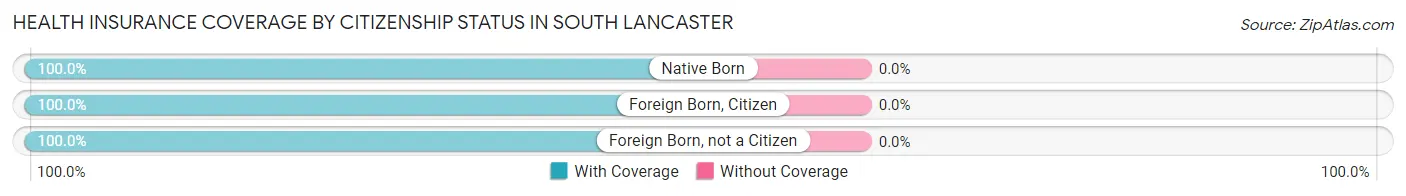
| Citizenship Status | With Coverage | Without Coverage |
| Native Born | 115 (100.0%) | 0 (0.0%) |
| Foreign Born, Citizen | 230 (100.0%) | 0 (0.0%) |
| Foreign Born, not a Citizen | 110 (100.0%) | 0 (0.0%) |
Health Insurance Coverage by Household Income in South Lancaster
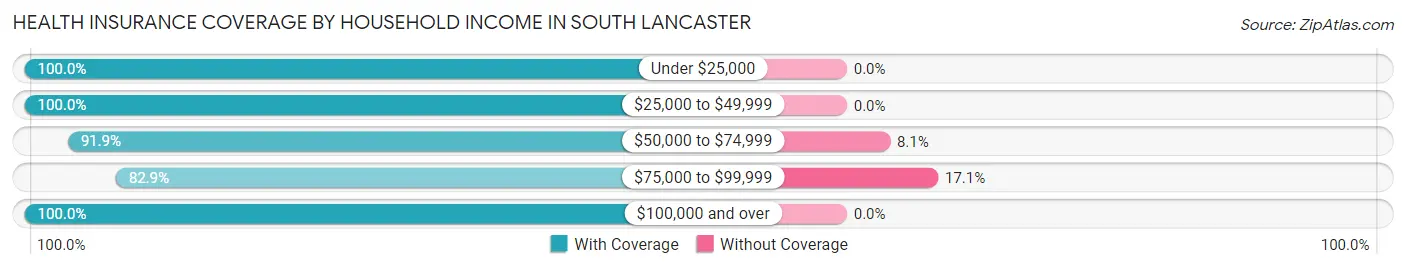
| Household Income | With Coverage | Without Coverage |
| Under $25,000 | 131 (100.0%) | 0 (0.0%) |
| $25,000 to $49,999 | 43 (100.0%) | 0 (0.0%) |
| $50,000 to $74,999 | 250 (91.9%) | 22 (8.1%) |
| $75,000 to $99,999 | 131 (82.9%) | 27 (17.1%) |
| $100,000 and over | 1,038 (100.0%) | 0 (0.0%) |
Public vs Private Health Insurance Coverage by Age in South Lancaster
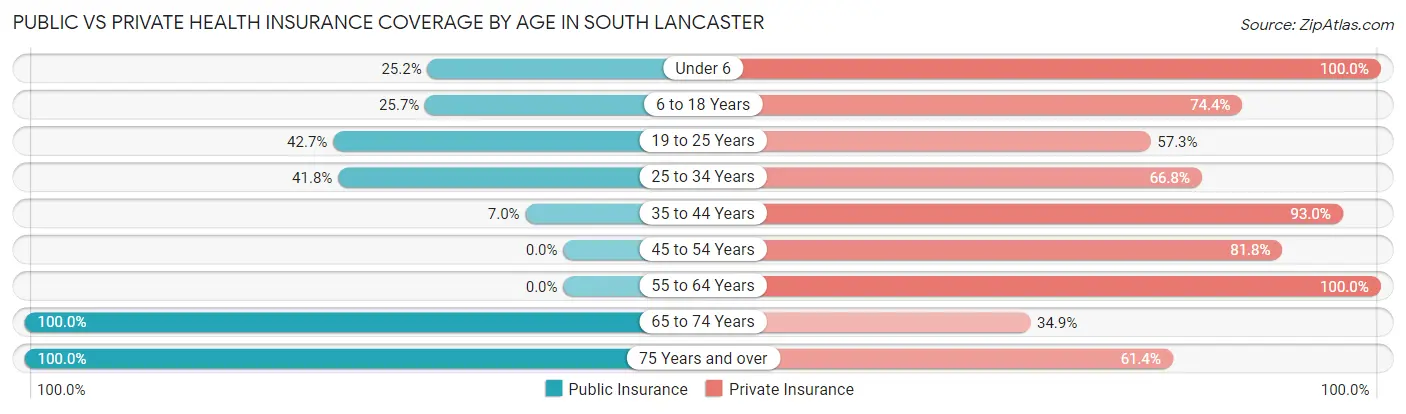
| Age Bracket | Public Insurance | Private Insurance |
| Under 6 | 29 (25.2%) | 115 (100.0%) |
| 6 to 18 Years | 59 (25.7%) | 171 (74.4%) |
| 19 to 25 Years | 47 (42.7%) | 63 (57.3%) |
| 25 to 34 Years | 107 (41.8%) | 171 (66.8%) |
| 35 to 44 Years | 14 (7.0%) | 185 (93.0%) |
| 45 to 54 Years | 0 (0.0%) | 121 (81.8%) |
| 55 to 64 Years | 0 (0.0%) | 304 (100.0%) |
| 65 to 74 Years | 83 (100.0%) | 29 (34.9%) |
| 75 Years and over | 197 (100.0%) | 121 (61.4%) |
| Total | 536 (32.6%) | 1,280 (77.9%) |
Disability Status by Sex by Age in South Lancaster
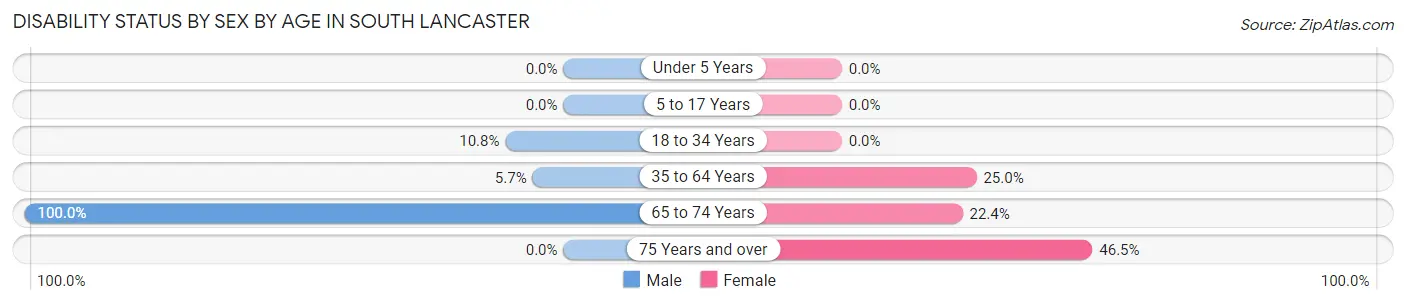
| Age Bracket | Male | Female |
| Under 5 Years | 0 (0.0%) | 0 (0.0%) |
| 5 to 17 Years | 0 (0.0%) | 0 (0.0%) |
| 18 to 34 Years | 21 (10.8%) | 0 (0.0%) |
| 35 to 64 Years | 13 (5.7%) | 106 (25.0%) |
| 65 to 74 Years | 25 (100.0%) | 13 (22.4%) |
| 75 Years and over | 0 (0.0%) | 60 (46.5%) |
Disability Class by Sex by Age in South Lancaster
Disability Class: Hearing Difficulty
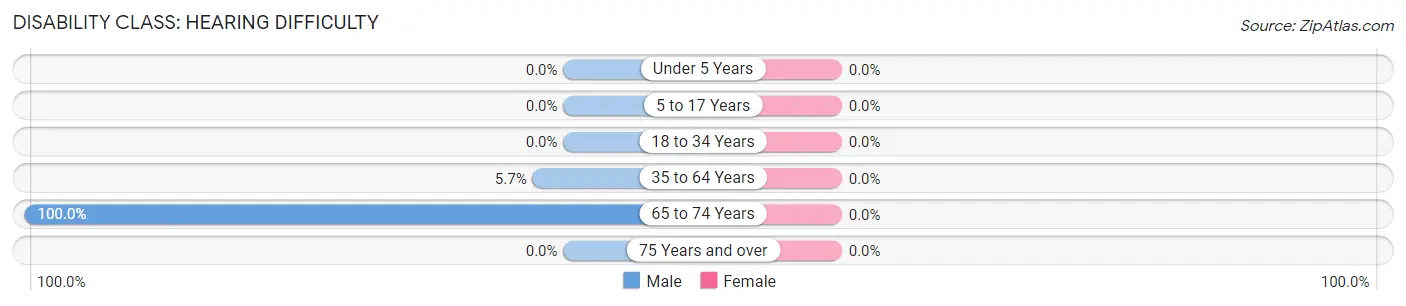
| Age Bracket | Male | Female |
| Under 5 Years | 0 (0.0%) | 0 (0.0%) |
| 5 to 17 Years | 0 (0.0%) | 0 (0.0%) |
| 18 to 34 Years | 0 (0.0%) | 0 (0.0%) |
| 35 to 64 Years | 13 (5.7%) | 0 (0.0%) |
| 65 to 74 Years | 25 (100.0%) | 0 (0.0%) |
| 75 Years and over | 0 (0.0%) | 0 (0.0%) |
Disability Class: Vision Difficulty
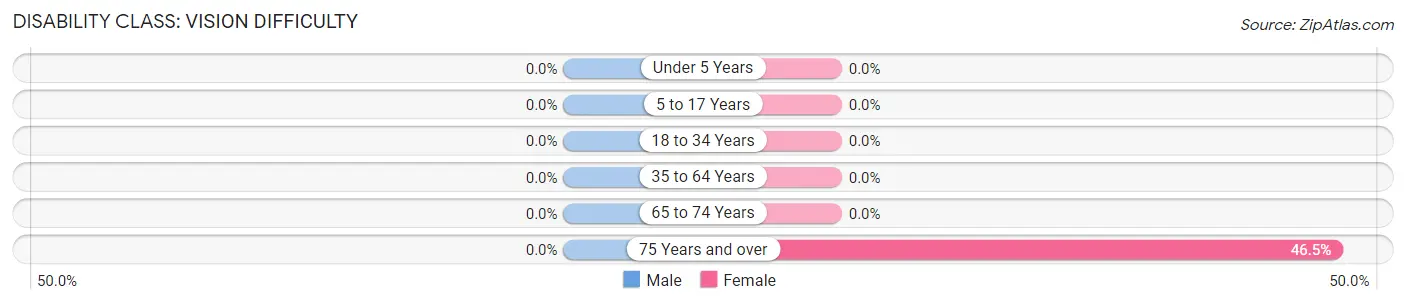
| Age Bracket | Male | Female |
| Under 5 Years | 0 (0.0%) | 0 (0.0%) |
| 5 to 17 Years | 0 (0.0%) | 0 (0.0%) |
| 18 to 34 Years | 0 (0.0%) | 0 (0.0%) |
| 35 to 64 Years | 0 (0.0%) | 0 (0.0%) |
| 65 to 74 Years | 0 (0.0%) | 0 (0.0%) |
| 75 Years and over | 0 (0.0%) | 60 (46.5%) |
Disability Class: Cognitive Difficulty
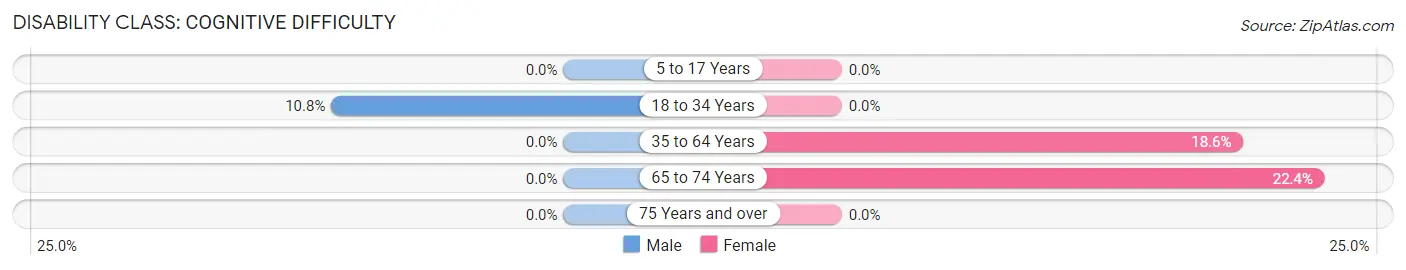
| Age Bracket | Male | Female |
| 5 to 17 Years | 0 (0.0%) | 0 (0.0%) |
| 18 to 34 Years | 21 (10.8%) | 0 (0.0%) |
| 35 to 64 Years | 0 (0.0%) | 79 (18.6%) |
| 65 to 74 Years | 0 (0.0%) | 13 (22.4%) |
| 75 Years and over | 0 (0.0%) | 0 (0.0%) |
Disability Class: Ambulatory Difficulty
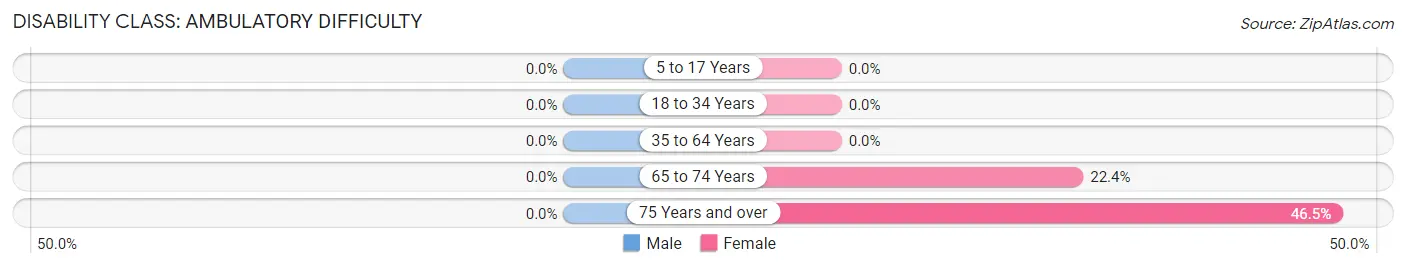
| Age Bracket | Male | Female |
| 5 to 17 Years | 0 (0.0%) | 0 (0.0%) |
| 18 to 34 Years | 0 (0.0%) | 0 (0.0%) |
| 35 to 64 Years | 0 (0.0%) | 0 (0.0%) |
| 65 to 74 Years | 0 (0.0%) | 13 (22.4%) |
| 75 Years and over | 0 (0.0%) | 60 (46.5%) |
Disability Class: Self-Care Difficulty
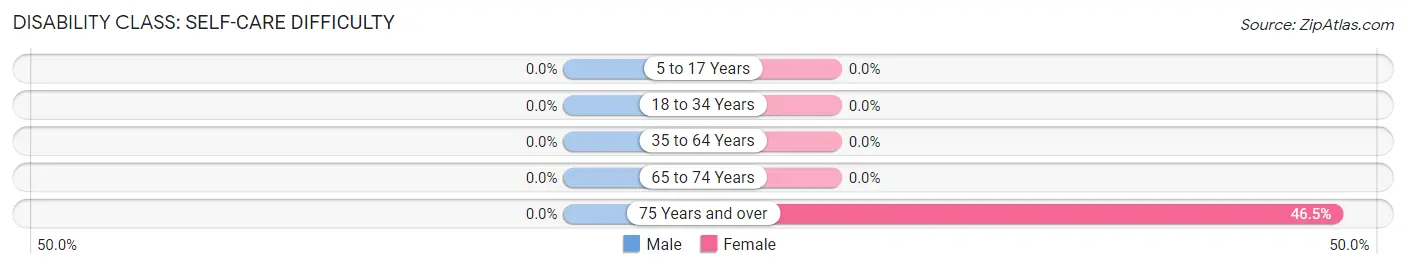
| Age Bracket | Male | Female |
| 5 to 17 Years | 0 (0.0%) | 0 (0.0%) |
| 18 to 34 Years | 0 (0.0%) | 0 (0.0%) |
| 35 to 64 Years | 0 (0.0%) | 0 (0.0%) |
| 65 to 74 Years | 0 (0.0%) | 0 (0.0%) |
| 75 Years and over | 0 (0.0%) | 60 (46.5%) |
Technology Access in South Lancaster
Computing Device Access in South Lancaster
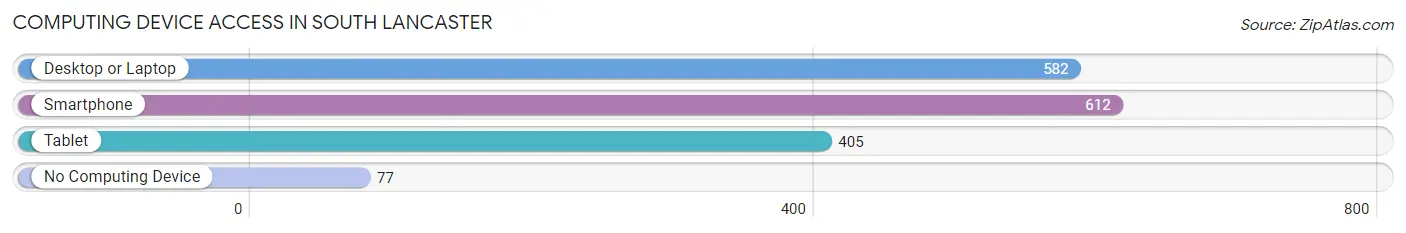
| Device Type | # Households | % Households |
| Desktop or Laptop | 582 | 79.4% |
| Smartphone | 612 | 83.5% |
| Tablet | 405 | 55.2% |
| No Computing Device | 77 | 10.5% |
| Total | 733 | 100.0% |
Internet Access in South Lancaster
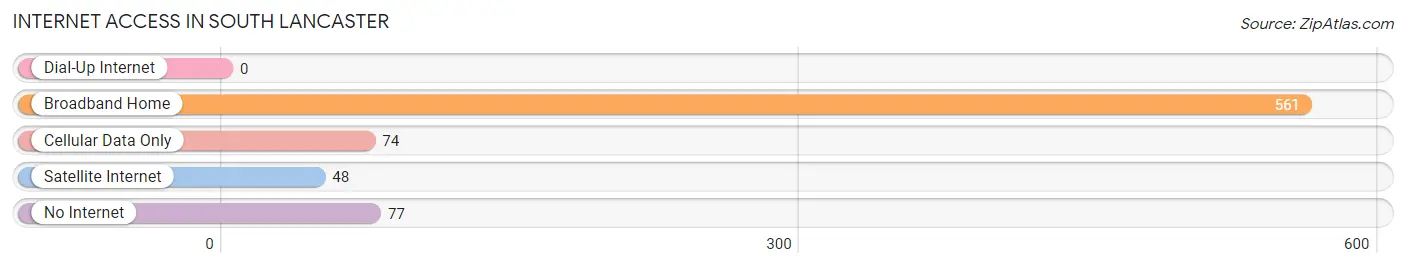
| Internet Type | # Households | % Households |
| Dial-Up Internet | 0 | 0.0% |
| Broadband Home | 561 | 76.5% |
| Cellular Data Only | 74 | 10.1% |
| Satellite Internet | 48 | 6.6% |
| No Internet | 77 | 10.5% |
| Total | 733 | 100.0% |
South Lancaster Summary
History
South Lancaster is a small town located in Worcester County, Massachusetts. It is situated on the banks of the Nashua River, and is part of the town of Lancaster. The town was first settled in 1653 by a group of English settlers from the nearby town of Lancaster. The town was originally known as "South Lancaster" due to its location south of the main town of Lancaster.
The town was primarily an agricultural community for much of its history, with the main crops being corn, potatoes, and hay. The town also had a number of small mills, including a grist mill, a saw mill, and a paper mill. The town was also home to a number of small businesses, including a blacksmith, a tannery, and a shoe factory.
In the late 19th century, the town began to experience a period of growth and development. The railroad arrived in 1872, and the town was connected to the larger cities of Worcester and Boston. This allowed for increased trade and commerce, and the town began to experience a period of prosperity.
The town continued to grow and develop throughout the 20th century. In the 1950s, the town was home to a number of small businesses, including a grocery store, a hardware store, and a gas station. The town also had a number of churches, including the Congregational Church, the Methodist Church, and the Baptist Church.
Geography
South Lancaster is located in Worcester County, Massachusetts. It is situated on the banks of the Nashua River, and is part of the town of Lancaster. The town is bordered by the towns of Bolton to the north, Harvard to the east, and Sterling to the south. The town is located approximately 25 miles west of Boston, and is accessible via Route 2 and Route 70.
The town has a total area of 8.3 square miles, of which 8.2 square miles is land and 0.1 square miles is water. The town is mostly flat, with some rolling hills in the northern part of town. The highest point in the town is located at an elevation of 545 feet.
Economy
South Lancaster is a small, rural town with a population of approximately 2,000 people. The town has a number of small businesses, including a grocery store, a hardware store, and a gas station. The town also has a number of churches, including the Congregational Church, the Methodist Church, and the Baptist Church.
The town is home to a number of small manufacturing companies, including a plastics manufacturer, a metal fabricator, and a machine shop. The town also has a number of small farms, which produce a variety of crops, including corn, potatoes, and hay.
Demographics
As of the 2010 census, South Lancaster had a population of 2,039 people. The racial makeup of the town was 97.2% White, 0.7% African American, 0.3% Native American, 0.4% Asian, 0.1% Pacific Islander, 0.3% from other races, and 1.0% from two or more races. Hispanic or Latino of any race were 1.2% of the population.
The median household income in the town was $60,938, and the median family income was $68,750. The per capita income for the town was $25,945. About 4.3% of families and 5.7% of the population were below the poverty line, including 6.3% of those under age 18 and 4.2% of those age 65 or over.
Common Questions
What is the Total Population of South Lancaster?
Total Population of South Lancaster is 1,642.
What is the Total Male Population of South Lancaster?
Total Male Population of South Lancaster is 701.
What is the Total Female Population of South Lancaster?
Total Female Population of South Lancaster is 941.
What is the Ratio of Males per 100 Females in South Lancaster?
There are 74.50 Males per 100 Females in South Lancaster.
What is the Ratio of Females per 100 Males in South Lancaster?
There are 134.24 Females per 100 Males in South Lancaster.
What is the Median Population Age in South Lancaster?
Median Population Age in South Lancaster is 39.0 Years.
What is the Average Family Size in South Lancaster
Average Family Size in South Lancaster is 3.3 People.
What is the Average Household Size in South Lancaster
Average Household Size in South Lancaster is 2.2 People.
What is Per Capita Income in South Lancaster?
Per Capita income in South Lancaster is $45,354.
What is the Median Family Income in South Lancaster?
Median Family Income in South Lancaster is $109,667.
What is the Median Household income in South Lancaster?
Median Household Income in South Lancaster is $101,250.
What is Income or Wage Gap in South Lancaster?
Income or Wage Gap in South Lancaster is 6.0%.
Women in South Lancaster earn 94.0 cents for every dollar earned by a man.
What is Inequality or Gini Index in South Lancaster?
Inequality or Gini Index in South Lancaster is 0.34.
How Large is the Labor Force in South Lancaster?
There are 931 People in the Labor Forcein in South Lancaster.
What is the Percentage of People in the Labor Force in South Lancaster?
69.6% of People are in the Labor Force in South Lancaster.
What is the Unemployment Rate in South Lancaster?
Unemployment Rate in South Lancaster is 19.0%.