Cities with the Highest Percentage of Immigrants from South America in Montana
RELATED REPORTS & OPTIONS
South America
Montana
Compare Cities
Map of Cities with the Highest Percentage of Immigrants from South America in Montana
0.00%
30.00%
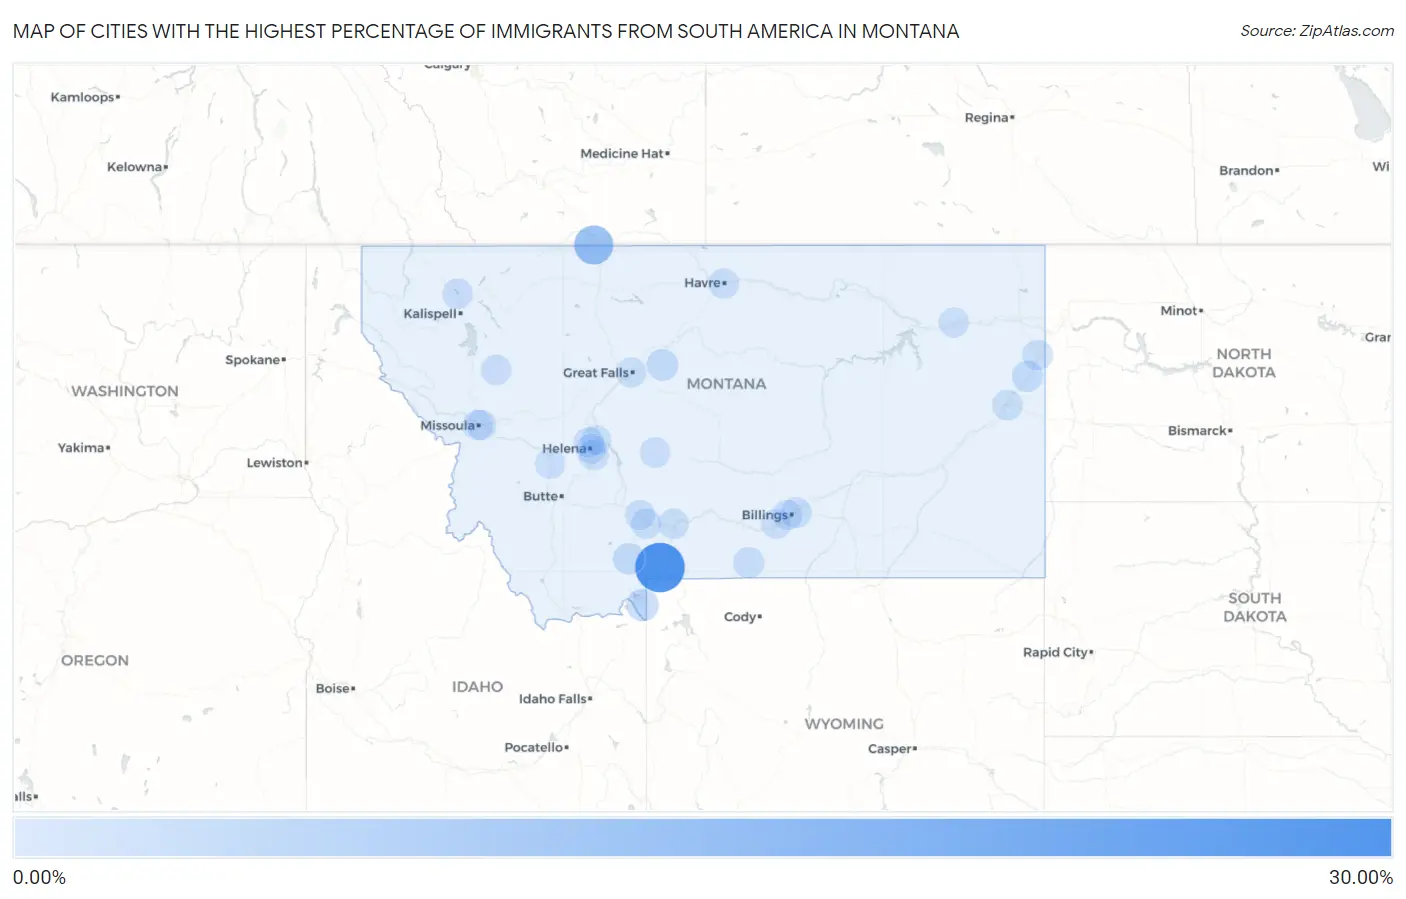
Cities with the Highest Percentage of Immigrants from South America in Montana
| City | South America | vs State | vs National | |
| 1. | Corwin Springs | 28.39% | 0.13%(+28.3)#5 | 1.10%(+27.3)#4,134 |
| 2. | Sweet Grass | 12.86% | 0.13%(+12.7)#6 | 1.10%(+11.8)#4,135 |
| 3. | West Yellowstone | 2.88% | 0.13%(+2.75)#7 | 1.10%(+1.78)#4,136 |
| 4. | Big Sky | 2.02% | 0.13%(+1.89)#8 | 1.10%(+0.919)#4,339 |
| 5. | Highwood | 1.68% | 0.13%(+1.55)#9 | 1.10%(+0.578)#4,340 |
| 6. | Savage | 1.36% | 0.13%(+1.23)#10 | 1.10%(+0.262)#4,341 |
| 7. | Red Lodge | 1.08% | 0.13%(+0.950)#11 | 1.10%(-0.021)#4,342 |
| 8. | Lockwood | 0.88% | 0.13%(+0.752)#45 | 1.10%(-0.219)#14,124 |
| 9. | Glendive | 0.66% | 0.13%(+0.531)#46 | 1.10%(-0.440)#14,125 |
| 10. | Condon | 0.65% | 0.13%(+0.525)#47 | 1.10%(-0.447)#14,126 |
| 11. | Sidney | 0.64% | 0.13%(+0.512)#48 | 1.10%(-0.459)#14,127 |
| 12. | Havre | 0.43% | 0.13%(+0.302)#49 | 1.10%(-0.670)#14,128 |
| 13. | Whitefish | 0.40% | 0.13%(+0.268)#50 | 1.10%(-0.703)#14,129 |
| 14. | Montana City | 0.37% | 0.13%(+0.241)#51 | 1.10%(-0.730)#14,130 |
| 15. | Helena Valley West Central | 0.30% | 0.13%(+0.178)#52 | 1.10%(-0.794)#14,131 |
| 16. | Livingston | 0.29% | 0.13%(+0.168)#53 | 1.10%(-0.804)#14,132 |
| 17. | White Sulphur Springs | 0.27% | 0.13%(+0.143)#54 | 1.10%(-0.828)#14,133 |
| 18. | Bozeman | 0.26% | 0.13%(+0.135)#55 | 1.10%(-0.837)#14,134 |
| 19. | Laurel | 0.24% | 0.13%(+0.110)#56 | 1.10%(-0.862)#14,135 |
| 20. | Helena Valley Northeast | 0.24% | 0.13%(+0.109)#57 | 1.10%(-0.863)#14,136 |
| 21. | Wolf Point | 0.23% | 0.13%(+0.101)#58 | 1.10%(-0.870)#14,137 |
| 22. | Missoula | 0.19% | 0.13%(+0.065)#59 | 1.10%(-0.907)#14,138 |
| 23. | Belgrade | 0.16% | 0.13%(+0.028)#60 | 1.10%(-0.943)#14,139 |
| 24. | Billings | 0.12% | 0.13%(-0.011)#61 | 1.10%(-0.982)#14,140 |
| 25. | Deer Lodge | 0.099% | 0.13%(-0.028)#62 | 1.10%(-0.999)#14,141 |
| 26. | East Missoula | 0.095% | 0.13%(-0.032)#63 | 1.10%(-1.00)#14,142 |
| 27. | Helena | 0.074% | 0.13%(-0.053)#64 | 1.10%(-1.02)#14,143 |
| 28. | Great Falls | 0.035% | 0.13%(-0.092)#65 | 1.10%(-1.06)#14,144 |
Common Questions
What are the Top 10 Cities with the Highest Percentage of Immigrants from South America in Montana?
Top 10 Cities with the Highest Percentage of Immigrants from South America in Montana are:
#1
28.39%
#2
12.86%
#3
2.88%
#4
2.02%
#5
1.68%
#6
1.36%
#7
1.08%
#8
0.88%
#9
0.66%
#10
0.65%
What city has the Highest Percentage of Immigrants from South America in Montana?
Corwin Springs has the Highest Percentage of Immigrants from South America in Montana with 28.39%.
What is the Percentage of Immigrants from South America in the State of Montana?
Percentage of Immigrants from South America in Montana is 0.13%.
What is the Percentage of Immigrants from South America in the United States?
Percentage of Immigrants from South America in the United States is 1.10%.