Cities with the Highest Percentage of Immigrants from South America in New York
RELATED REPORTS & OPTIONS
South America
New York
Compare Cities
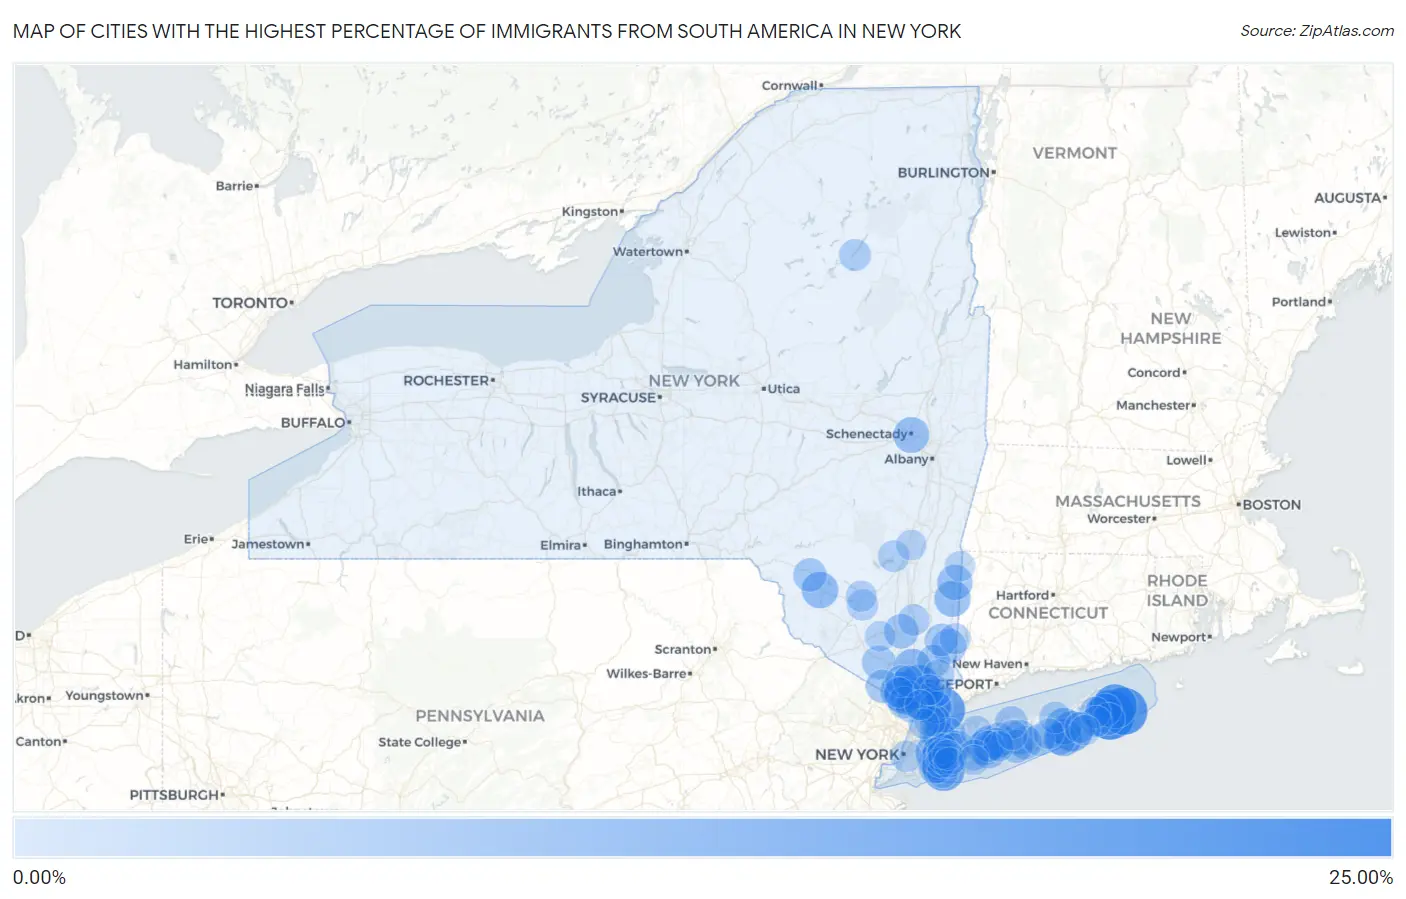
Map of Cities with the Highest Percentage of Immigrants from South America in New York
0.00%
25.00%
Cities with the Highest Percentage of Immigrants from South America in New York
| City | South America | vs State | vs National | |
| 1. | East Hampton North | 22.98% | 3.10%(+19.9)#49 | 1.10%(+21.9)#2,969 |
| 2. | Napeague | 20.78% | 3.10%(+17.7)#50 | 1.10%(+19.7)#2,970 |
| 3. | Port Chester | 18.41% | 3.10%(+15.3)#51 | 1.10%(+17.3)#2,971 |
| 4. | Springs | 17.46% | 3.10%(+14.4)#439 | 1.10%(+16.4)#12,259 |
| 5. | Ossining | 15.66% | 3.10%(+12.6)#440 | 1.10%(+14.6)#12,260 |
| 6. | Island Park | 15.32% | 3.10%(+12.2)#441 | 1.10%(+14.2)#12,261 |
| 7. | Sleepy Hollow | 15.06% | 3.10%(+12.0)#442 | 1.10%(+14.0)#12,262 |
| 8. | Hampton Bays | 13.80% | 3.10%(+10.7)#443 | 1.10%(+12.7)#12,263 |
| 9. | Bellerose Terrace | 12.08% | 3.10%(+8.98)#444 | 1.10%(+11.0)#12,264 |
| 10. | Elmsford | 11.92% | 3.10%(+8.82)#445 | 1.10%(+10.8)#12,265 |
| 11. | Hillcrest | 11.76% | 3.10%(+8.66)#446 | 1.10%(+10.7)#12,266 |
| 12. | Peekskill | 10.75% | 3.10%(+7.65)#447 | 1.10%(+9.65)#12,267 |
| 13. | Valley Stream | 10.73% | 3.10%(+7.63)#448 | 1.10%(+9.63)#12,268 |
| 14. | Quogue | 10.62% | 3.10%(+7.53)#449 | 1.10%(+9.53)#12,269 |
| 15. | Flanders | 10.15% | 3.10%(+7.05)#450 | 1.10%(+9.06)#12,270 |
| 16. | White Plains | 10.15% | 3.10%(+7.05)#451 | 1.10%(+9.05)#12,271 |
| 17. | Liberty | 9.92% | 3.10%(+6.82)#452 | 1.10%(+8.82)#12,272 |
| 18. | Nanuet | 9.91% | 3.10%(+6.81)#453 | 1.10%(+8.81)#12,273 |
| 19. | Dover Plains | 9.62% | 3.10%(+6.52)#454 | 1.10%(+8.52)#12,274 |
| 20. | Schenectady | 9.34% | 3.10%(+6.24)#455 | 1.10%(+8.25)#12,275 |
| 21. | Brentwood | 9.09% | 3.10%(+5.99)#456 | 1.10%(+7.99)#12,276 |
| 22. | Amenia | 8.78% | 3.10%(+5.69)#457 | 1.10%(+7.69)#12,277 |
| 23. | Baywood | 8.77% | 3.10%(+5.67)#458 | 1.10%(+7.67)#12,278 |
| 24. | Manorhaven | 8.76% | 3.10%(+5.66)#459 | 1.10%(+7.66)#12,279 |
| 25. | Elmont | 8.55% | 3.10%(+5.45)#460 | 1.10%(+7.45)#12,280 |
| 26. | Mountain Dale | 8.46% | 3.10%(+5.36)#461 | 1.10%(+7.36)#12,281 |
| 27. | Brewster Hill | 8.33% | 3.10%(+5.23)#462 | 1.10%(+7.24)#12,282 |
| 28. | Medford | 8.13% | 3.10%(+5.03)#463 | 1.10%(+7.03)#12,283 |
| 29. | Islandia | 7.96% | 3.10%(+4.86)#464 | 1.10%(+6.86)#12,284 |
| 30. | Balmville | 7.93% | 3.10%(+4.83)#465 | 1.10%(+6.84)#12,285 |
| 31. | Bay Shore | 7.74% | 3.10%(+4.64)#466 | 1.10%(+6.64)#12,286 |
| 32. | West Nyack | 7.72% | 3.10%(+4.62)#467 | 1.10%(+6.62)#12,287 |
| 33. | New Hyde Park | 7.44% | 3.10%(+4.34)#468 | 1.10%(+6.34)#12,288 |
| 34. | North Bellport | 7.28% | 3.10%(+4.18)#469 | 1.10%(+6.19)#12,289 |
| 35. | Fairview Cdp Westchester County | 7.23% | 3.10%(+4.13)#470 | 1.10%(+6.13)#12,290 |
| 36. | Walton Park | 7.05% | 3.10%(+3.96)#471 | 1.10%(+5.96)#12,291 |
| 37. | South Floral Park | 7.05% | 3.10%(+3.95)#472 | 1.10%(+5.96)#12,292 |
| 38. | Livingston Manor | 6.95% | 3.10%(+3.85)#473 | 1.10%(+5.85)#12,293 |
| 39. | Sloatsburg | 6.84% | 3.10%(+3.74)#474 | 1.10%(+5.75)#12,473 |
| 40. | Patchogue | 6.76% | 3.10%(+3.67)#475 | 1.10%(+5.67)#12,474 |
| 41. | Westbury | 6.56% | 3.10%(+3.46)#476 | 1.10%(+5.46)#12,475 |
| 42. | Shenorock | 6.48% | 3.10%(+3.38)#477 | 1.10%(+5.38)#12,476 |
| 43. | Northwest Harbor | 6.41% | 3.10%(+3.31)#478 | 1.10%(+5.32)#12,477 |
| 44. | Port Jefferson Station | 6.30% | 3.10%(+3.20)#479 | 1.10%(+5.20)#12,478 |
| 45. | North Valley Stream | 6.13% | 3.10%(+3.03)#480 | 1.10%(+5.03)#12,479 |
| 46. | Lake Carmel | 6.12% | 3.10%(+3.02)#481 | 1.10%(+5.02)#12,480 |
| 47. | Quiogue | 6.10% | 3.10%(+3.00)#482 | 1.10%(+5.00)#12,481 |
| 48. | Sparkill | 5.78% | 3.10%(+2.68)#483 | 1.10%(+4.68)#12,482 |
| 49. | Cedarhurst | 5.75% | 3.10%(+2.65)#484 | 1.10%(+4.65)#12,483 |
| 50. | East Hampton | 5.67% | 3.10%(+2.57)#485 | 1.10%(+4.57)#12,484 |
| 51. | Baxter Estates | 5.66% | 3.10%(+2.56)#486 | 1.10%(+4.56)#12,485 |
| 52. | Glen Head | 5.62% | 3.10%(+2.52)#487 | 1.10%(+4.53)#12,486 |
| 53. | Mount Ivy | 5.60% | 3.10%(+2.50)#488 | 1.10%(+4.50)#12,487 |
| 54. | Long Lake | 5.41% | 3.10%(+2.31)#489 | 1.10%(+4.31)#12,488 |
| 55. | Pearl River | 5.31% | 3.10%(+2.22)#490 | 1.10%(+4.22)#12,489 |
| 56. | Central Islip | 5.24% | 3.10%(+2.14)#491 | 1.10%(+4.14)#12,490 |
| 57. | Harrison | 5.19% | 3.10%(+2.10)#492 | 1.10%(+4.10)#12,491 |
| 58. | Moriches | 5.18% | 3.10%(+2.08)#493 | 1.10%(+4.08)#12,492 |
| 59. | Mamaroneck | 5.16% | 3.10%(+2.06)#494 | 1.10%(+4.06)#12,493 |
| 60. | Riverhead | 5.15% | 3.10%(+2.05)#495 | 1.10%(+4.05)#12,494 |
| 61. | Zena | 5.10% | 3.10%(+2.00)#496 | 1.10%(+4.00)#12,495 |
| 62. | Hicksville | 5.09% | 3.10%(+1.99)#497 | 1.10%(+3.99)#12,496 |
| 63. | Haverstraw | 5.03% | 3.10%(+1.93)#498 | 1.10%(+3.93)#12,497 |
| 64. | New York | 4.99% | 3.10%(+1.89)#499 | 1.10%(+3.89)#12,498 |
| 65. | Salisbury | 4.98% | 3.10%(+1.88)#500 | 1.10%(+3.88)#12,499 |
| 66. | Wappingers Falls | 4.95% | 3.10%(+1.85)#501 | 1.10%(+3.85)#12,500 |
| 67. | Greenlawn | 4.87% | 3.10%(+1.77)#502 | 1.10%(+3.77)#12,501 |
| 68. | Armonk | 4.84% | 3.10%(+1.74)#503 | 1.10%(+3.74)#12,502 |
| 69. | Ellenville | 4.77% | 3.10%(+1.67)#504 | 1.10%(+3.67)#12,503 |
| 70. | Noyack | 4.75% | 3.10%(+1.65)#505 | 1.10%(+3.65)#12,504 |
| 71. | Woodsburgh | 4.74% | 3.10%(+1.64)#506 | 1.10%(+3.64)#12,505 |
| 72. | Bridgehampton | 4.72% | 3.10%(+1.63)#507 | 1.10%(+3.63)#12,506 |
| 73. | North Bay Shore | 4.71% | 3.10%(+1.61)#508 | 1.10%(+3.62)#12,507 |
| 74. | Bedford Hills | 4.69% | 3.10%(+1.59)#509 | 1.10%(+3.59)#12,508 |
| 75. | Putnam Lake | 4.65% | 3.10%(+1.55)#510 | 1.10%(+3.55)#12,509 |
| 76. | Franklin Square | 4.65% | 3.10%(+1.55)#511 | 1.10%(+3.55)#12,510 |
| 77. | Napanoch | 4.63% | 3.10%(+1.53)#512 | 1.10%(+3.53)#12,511 |
| 78. | Long Beach | 4.61% | 3.10%(+1.51)#513 | 1.10%(+3.51)#12,512 |
| 79. | Lakeview | 4.60% | 3.10%(+1.50)#514 | 1.10%(+3.50)#12,513 |
| 80. | North Lindenhurst | 4.57% | 3.10%(+1.47)#515 | 1.10%(+3.47)#12,514 |
| 81. | Pleasantville | 4.56% | 3.10%(+1.46)#516 | 1.10%(+3.46)#12,515 |
| 82. | Shinnecock Hills | 4.45% | 3.10%(+1.35)#517 | 1.10%(+3.35)#12,516 |
| 83. | Roosevelt | 4.40% | 3.10%(+1.30)#518 | 1.10%(+3.31)#12,517 |
| 84. | Garden City Park | 4.40% | 3.10%(+1.30)#519 | 1.10%(+3.30)#12,518 |
| 85. | New Rochelle | 4.29% | 3.10%(+1.19)#520 | 1.10%(+3.19)#12,519 |
| 86. | Eastport | 4.21% | 3.10%(+1.11)#521 | 1.10%(+3.12)#12,520 |
| 87. | North Great River | 4.16% | 3.10%(+1.06)#522 | 1.10%(+3.06)#12,521 |
| 88. | Lynbrook | 4.11% | 3.10%(+1.01)#523 | 1.10%(+3.01)#12,522 |
| 89. | Spring Valley | 4.07% | 3.10%(+0.972)#524 | 1.10%(+2.97)#12,523 |
| 90. | Maybrook | 4.05% | 3.10%(+0.952)#525 | 1.10%(+2.95)#12,524 |
| 91. | Malden On Hudson | 4.05% | 3.10%(+0.950)#526 | 1.10%(+2.95)#12,525 |
| 92. | Mount Vernon | 4.03% | 3.10%(+0.926)#527 | 1.10%(+2.93)#12,526 |
| 93. | Irvington | 4.01% | 3.10%(+0.907)#528 | 1.10%(+2.91)#12,527 |
| 94. | Farmingville | 3.98% | 3.10%(+0.885)#529 | 1.10%(+2.89)#12,528 |
| 95. | Southampton | 3.95% | 3.10%(+0.851)#530 | 1.10%(+2.85)#12,529 |
| 96. | Millerton | 3.94% | 3.10%(+0.845)#531 | 1.10%(+2.85)#12,530 |
| 97. | Garden City South | 3.94% | 3.10%(+0.839)#532 | 1.10%(+2.84)#12,531 |
| 98. | Hempstead | 3.94% | 3.10%(+0.839)#533 | 1.10%(+2.84)#12,532 |
| 99. | Baldwin | 3.88% | 3.10%(+0.776)#534 | 1.10%(+2.78)#12,533 |
| 100. | Copiague | 3.86% | 3.10%(+0.765)#535 | 1.10%(+2.77)#12,534 |
Common Questions
What are the Top 10 Cities with the Highest Percentage of Immigrants from South America in New York?
Top 10 Cities with the Highest Percentage of Immigrants from South America in New York are:
#1
22.98%
#2
20.78%
#3
18.41%
#4
17.46%
#5
15.66%
#6
15.32%
#7
15.06%
#8
13.80%
#9
12.08%
#10
11.92%
What city has the Highest Percentage of Immigrants from South America in New York?
East Hampton North has the Highest Percentage of Immigrants from South America in New York with 22.98%.
What is the Percentage of Immigrants from South America in the State of New York?
Percentage of Immigrants from South America in New York is 3.10%.
What is the Percentage of Immigrants from South America in the United States?
Percentage of Immigrants from South America in the United States is 1.10%.