Cities with the Highest Percentage of Immigrants from South America in Michigan
RELATED REPORTS & OPTIONS
South America
Michigan
Compare Cities
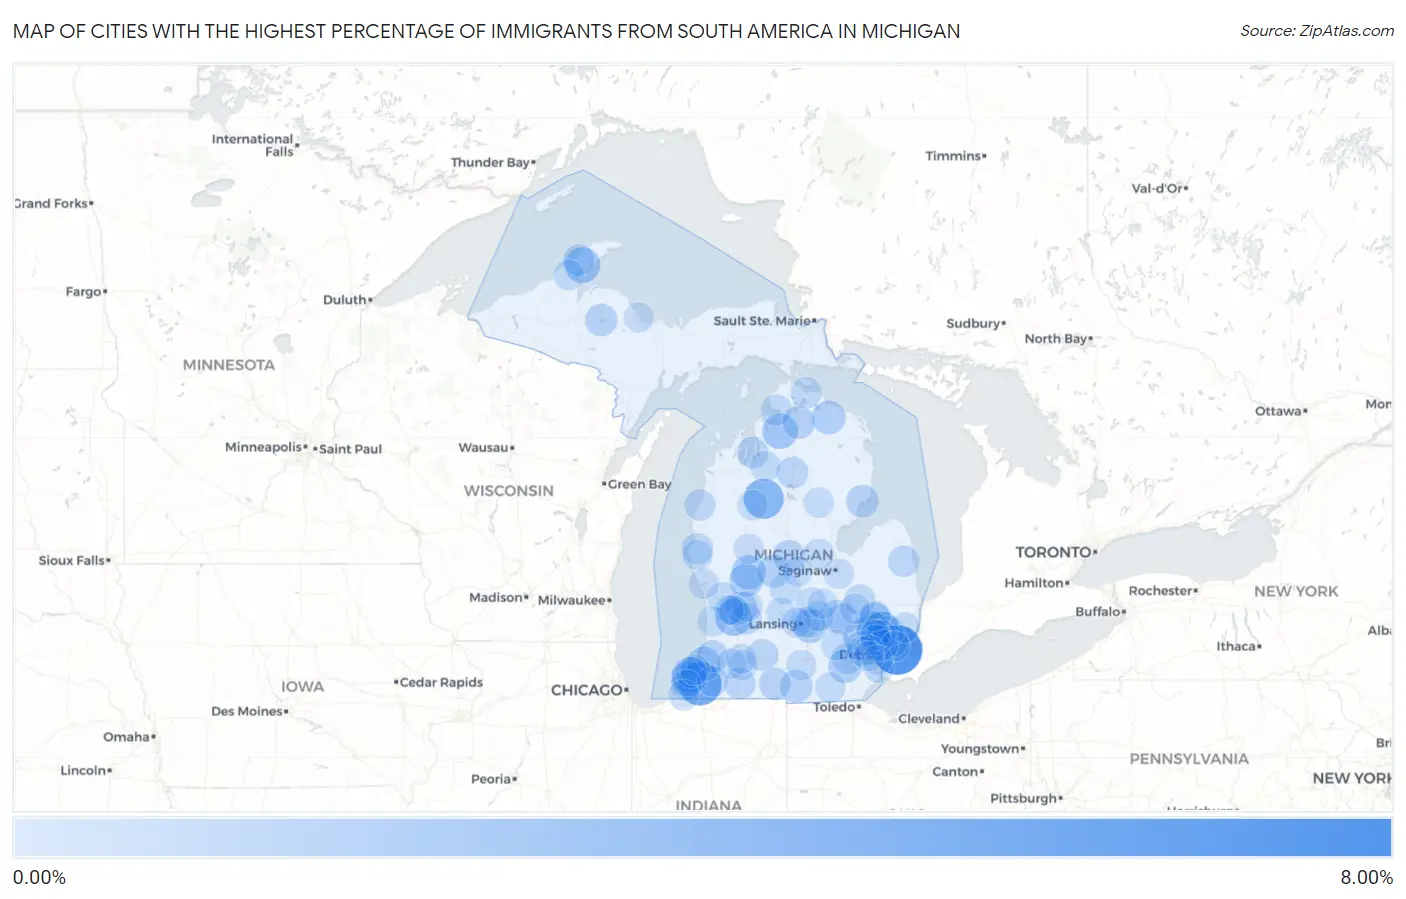
Map of Cities with the Highest Percentage of Immigrants from South America in Michigan
0.00%
8.00%
Cities with the Highest Percentage of Immigrants from South America in Michigan
| City | South America | vs State | vs National | |
| 1. | Grosse Pointe Farms | 6.02% | 0.19%(+5.83)#285 | 1.10%(+4.92)#14,015 |
| 2. | Berrien Springs | 4.10% | 0.19%(+3.92)#286 | 1.10%(+3.01)#14,016 |
| 3. | Ramsay | 3.68% | 0.19%(+3.49)#287 | 1.10%(+2.58)#14,017 |
| 4. | Lake City | 3.13% | 0.19%(+2.95)#288 | 1.10%(+2.04)#14,018 |
| 5. | Byron Center | 2.10% | 0.19%(+1.92)#289 | 1.10%(+1.01)#14,019 |
| 6. | Pleasant Ridge | 1.95% | 0.19%(+1.77)#290 | 1.10%(+0.856)#14,020 |
| 7. | Shoreham | 1.95% | 0.19%(+1.77)#291 | 1.10%(+0.856)#14,021 |
| 8. | Lake Linden | 1.86% | 0.19%(+1.67)#292 | 1.10%(+0.761)#14,022 |
| 9. | Wolverine Lake | 1.85% | 0.19%(+1.66)#293 | 1.10%(+0.749)#14,023 |
| 10. | Boyne Falls | 1.76% | 0.19%(+1.57)#294 | 1.10%(+0.661)#14,024 |
| 11. | Stevensville | 1.69% | 0.19%(+1.50)#295 | 1.10%(+0.589)#14,025 |
| 12. | Howard City | 1.47% | 0.19%(+1.28)#296 | 1.10%(+0.372)#14,121 |
| 13. | Rochester Hills | 1.41% | 0.19%(+1.22)#297 | 1.10%(+0.309)#14,122 |
| 14. | Paw Paw Lake | 1.37% | 0.19%(+1.18)#298 | 1.10%(+0.274)#14,123 |
| 15. | Lake Orion | 1.34% | 0.19%(+1.15)#299 | 1.10%(+0.240)#14,124 |
| 16. | Birmingham | 1.33% | 0.19%(+1.15)#300 | 1.10%(+0.236)#14,125 |
| 17. | Auburn Hills | 1.28% | 0.19%(+1.09)#301 | 1.10%(+0.183)#14,126 |
| 18. | Okemos | 1.27% | 0.19%(+1.08)#302 | 1.10%(+0.174)#14,127 |
| 19. | Millersburg | 1.23% | 0.19%(+1.05)#303 | 1.10%(+0.136)#14,128 |
| 20. | Sand Lake | 1.22% | 0.19%(+1.03)#304 | 1.10%(+0.121)#14,129 |
| 21. | Saline | 1.18% | 0.19%(+0.993)#305 | 1.10%(+0.083)#14,130 |
| 22. | Edmore | 1.02% | 0.19%(+0.829)#306 | 1.10%(-0.081)#14,131 |
| 23. | Wolverine | 0.98% | 0.19%(+0.787)#307 | 1.10%(-0.123)#14,132 |
| 24. | Hillsdale | 0.95% | 0.19%(+0.761)#308 | 1.10%(-0.149)#14,136 |
| 25. | East Tawas | 0.93% | 0.19%(+0.746)#309 | 1.10%(-0.164)#14,137 |
| 26. | Michigamme | 0.88% | 0.19%(+0.697)#310 | 1.10%(-0.213)#14,138 |
| 27. | Mount Pleasant | 0.87% | 0.19%(+0.678)#311 | 1.10%(-0.232)#14,139 |
| 28. | Rochester | 0.85% | 0.19%(+0.659)#312 | 1.10%(-0.251)#14,140 |
| 29. | Byron | 0.83% | 0.19%(+0.640)#313 | 1.10%(-0.270)#14,141 |
| 30. | Coldwater | 0.81% | 0.19%(+0.622)#314 | 1.10%(-0.288)#14,142 |
| 31. | East Grand Rapids | 0.79% | 0.19%(+0.602)#315 | 1.10%(-0.308)#14,143 |
| 32. | Bangor | 0.77% | 0.19%(+0.585)#316 | 1.10%(-0.325)#14,144 |
| 33. | Springfield | 0.74% | 0.19%(+0.552)#317 | 1.10%(-0.358)#14,145 |
| 34. | Lake Angelus | 0.70% | 0.19%(+0.509)#318 | 1.10%(-0.401)#14,146 |
| 35. | Grayling | 0.68% | 0.19%(+0.494)#319 | 1.10%(-0.416)#14,147 |
| 36. | Argentine | 0.61% | 0.19%(+0.424)#320 | 1.10%(-0.486)#14,148 |
| 37. | Caledonia | 0.61% | 0.19%(+0.420)#321 | 1.10%(-0.490)#14,149 |
| 38. | Three Rivers | 0.61% | 0.19%(+0.418)#322 | 1.10%(-0.492)#14,150 |
| 39. | Ann Arbor | 0.60% | 0.19%(+0.412)#323 | 1.10%(-0.498)#14,151 |
| 40. | Elk Rapids | 0.57% | 0.19%(+0.386)#324 | 1.10%(-0.524)#14,152 |
| 41. | Deckerville | 0.57% | 0.19%(+0.378)#325 | 1.10%(-0.532)#14,153 |
| 42. | Calumet | 0.56% | 0.19%(+0.368)#326 | 1.10%(-0.542)#14,154 |
| 43. | Hart | 0.55% | 0.19%(+0.364)#327 | 1.10%(-0.546)#14,155 |
| 44. | Manistee | 0.54% | 0.19%(+0.356)#328 | 1.10%(-0.554)#14,156 |
| 45. | Royal Oak | 0.52% | 0.19%(+0.330)#329 | 1.10%(-0.580)#14,157 |
| 46. | Davison | 0.49% | 0.19%(+0.301)#330 | 1.10%(-0.609)#14,158 |
| 47. | Roseville | 0.48% | 0.19%(+0.292)#331 | 1.10%(-0.618)#14,159 |
| 48. | Cheboygan | 0.46% | 0.19%(+0.272)#332 | 1.10%(-0.638)#14,160 |
| 49. | St Joseph | 0.46% | 0.19%(+0.270)#333 | 1.10%(-0.640)#14,161 |
| 50. | Harbor Springs | 0.46% | 0.19%(+0.270)#334 | 1.10%(-0.640)#14,162 |
| 51. | Dowagiac | 0.44% | 0.19%(+0.252)#335 | 1.10%(-0.658)#14,163 |
| 52. | Coopersville | 0.44% | 0.19%(+0.249)#336 | 1.10%(-0.661)#14,164 |
| 53. | Bridgman | 0.42% | 0.19%(+0.232)#337 | 1.10%(-0.678)#14,165 |
| 54. | Three Oaks | 0.41% | 0.19%(+0.226)#338 | 1.10%(-0.684)#14,166 |
| 55. | Carson City | 0.40% | 0.19%(+0.209)#339 | 1.10%(-0.701)#14,167 |
| 56. | South Range | 0.39% | 0.19%(+0.205)#340 | 1.10%(-0.705)#14,168 |
| 57. | Kalkaska | 0.39% | 0.19%(+0.202)#341 | 1.10%(-0.708)#14,169 |
| 58. | Riverview | 0.39% | 0.19%(+0.199)#342 | 1.10%(-0.711)#14,170 |
| 59. | Haslett | 0.36% | 0.19%(+0.173)#343 | 1.10%(-0.737)#14,171 |
| 60. | East Lansing | 0.35% | 0.19%(+0.166)#344 | 1.10%(-0.744)#14,172 |
| 61. | Perry | 0.35% | 0.19%(+0.162)#345 | 1.10%(-0.748)#14,173 |
| 62. | Utica | 0.35% | 0.19%(+0.158)#346 | 1.10%(-0.752)#14,174 |
| 63. | Oxford | 0.34% | 0.19%(+0.156)#347 | 1.10%(-0.754)#14,175 |
| 64. | Holland | 0.34% | 0.19%(+0.151)#348 | 1.10%(-0.759)#14,176 |
| 65. | Troy | 0.34% | 0.19%(+0.149)#349 | 1.10%(-0.761)#14,177 |
| 66. | Spring Arbor | 0.33% | 0.19%(+0.144)#350 | 1.10%(-0.766)#14,178 |
| 67. | Beverly Hills | 0.33% | 0.19%(+0.143)#351 | 1.10%(-0.767)#14,179 |
| 68. | Forest Hills | 0.32% | 0.19%(+0.132)#352 | 1.10%(-0.778)#14,180 |
| 69. | West Branch | 0.32% | 0.19%(+0.130)#353 | 1.10%(-0.780)#14,181 |
| 70. | Mattawan | 0.31% | 0.19%(+0.123)#354 | 1.10%(-0.787)#14,182 |
| 71. | Grand Blanc | 0.31% | 0.19%(+0.123)#355 | 1.10%(-0.787)#14,183 |
| 72. | Cadillac | 0.31% | 0.19%(+0.119)#356 | 1.10%(-0.791)#14,184 |
| 73. | Pinckney | 0.31% | 0.19%(+0.119)#357 | 1.10%(-0.791)#14,185 |
| 74. | Adrian | 0.31% | 0.19%(+0.117)#358 | 1.10%(-0.793)#14,186 |
| 75. | Big Rapids | 0.30% | 0.19%(+0.115)#359 | 1.10%(-0.795)#14,187 |
| 76. | Ferndale | 0.30% | 0.19%(+0.113)#360 | 1.10%(-0.797)#14,188 |
| 77. | Portage | 0.30% | 0.19%(+0.108)#361 | 1.10%(-0.802)#14,189 |
| 78. | Northville | 0.30% | 0.19%(+0.107)#362 | 1.10%(-0.803)#14,190 |
| 79. | North Muskegon | 0.29% | 0.19%(+0.106)#363 | 1.10%(-0.804)#14,191 |
| 80. | Wyoming | 0.29% | 0.19%(+0.097)#364 | 1.10%(-0.813)#14,192 |
| 81. | New Baltimore | 0.28% | 0.19%(+0.093)#365 | 1.10%(-0.817)#14,193 |
| 82. | Shelby | 0.28% | 0.19%(+0.089)#366 | 1.10%(-0.821)#14,194 |
| 83. | Ovid | 0.28% | 0.19%(+0.089)#367 | 1.10%(-0.821)#14,195 |
| 84. | Bloomfield Hills | 0.27% | 0.19%(+0.084)#368 | 1.10%(-0.826)#14,196 |
| 85. | Benton Heights | 0.27% | 0.19%(+0.077)#369 | 1.10%(-0.833)#14,197 |
| 86. | Portland | 0.26% | 0.19%(+0.074)#370 | 1.10%(-0.836)#14,198 |
| 87. | Bridgeport | 0.26% | 0.19%(+0.073)#371 | 1.10%(-0.837)#14,199 |
| 88. | Midland | 0.26% | 0.19%(+0.071)#372 | 1.10%(-0.839)#14,200 |
| 89. | Plymouth | 0.25% | 0.19%(+0.059)#373 | 1.10%(-0.851)#14,201 |
| 90. | Grosse Pointe Woods | 0.24% | 0.19%(+0.057)#374 | 1.10%(-0.853)#14,202 |
| 91. | Livonia | 0.24% | 0.19%(+0.056)#375 | 1.10%(-0.854)#14,203 |
| 92. | Kalamazoo | 0.24% | 0.19%(+0.056)#376 | 1.10%(-0.854)#14,204 |
| 93. | Grandville | 0.24% | 0.19%(+0.055)#377 | 1.10%(-0.855)#14,205 |
| 94. | Allen Park | 0.24% | 0.19%(+0.051)#378 | 1.10%(-0.859)#14,206 |
| 95. | Westland | 0.24% | 0.19%(+0.051)#379 | 1.10%(-0.859)#14,207 |
| 96. | Owosso | 0.23% | 0.19%(+0.043)#380 | 1.10%(-0.867)#14,208 |
| 97. | Jenison | 0.23% | 0.19%(+0.043)#381 | 1.10%(-0.867)#14,209 |
| 98. | St Louis | 0.23% | 0.19%(+0.043)#382 | 1.10%(-0.867)#14,210 |
| 99. | Waverly | 0.23% | 0.19%(+0.039)#383 | 1.10%(-0.871)#14,211 |
| 100. | Marquette | 0.23% | 0.19%(+0.039)#384 | 1.10%(-0.871)#14,212 |
Common Questions
What are the Top 10 Cities with the Highest Percentage of Immigrants from South America in Michigan?
Top 10 Cities with the Highest Percentage of Immigrants from South America in Michigan are:
#1
6.02%
#2
4.10%
#3
3.13%
#4
2.10%
#5
1.95%
#6
1.95%
#7
1.86%
#8
1.85%
#9
1.76%
#10
1.69%
What city has the Highest Percentage of Immigrants from South America in Michigan?
Grosse Pointe Farms has the Highest Percentage of Immigrants from South America in Michigan with 6.02%.
What is the Percentage of Immigrants from South America in the State of Michigan?
Percentage of Immigrants from South America in Michigan is 0.19%.
What is the Percentage of Immigrants from South America in the United States?
Percentage of Immigrants from South America in the United States is 1.10%.