Cities with the Highest Percentage of Immigrants from South America in Nebraska
RELATED REPORTS & OPTIONS
South America
Nebraska
Compare Cities
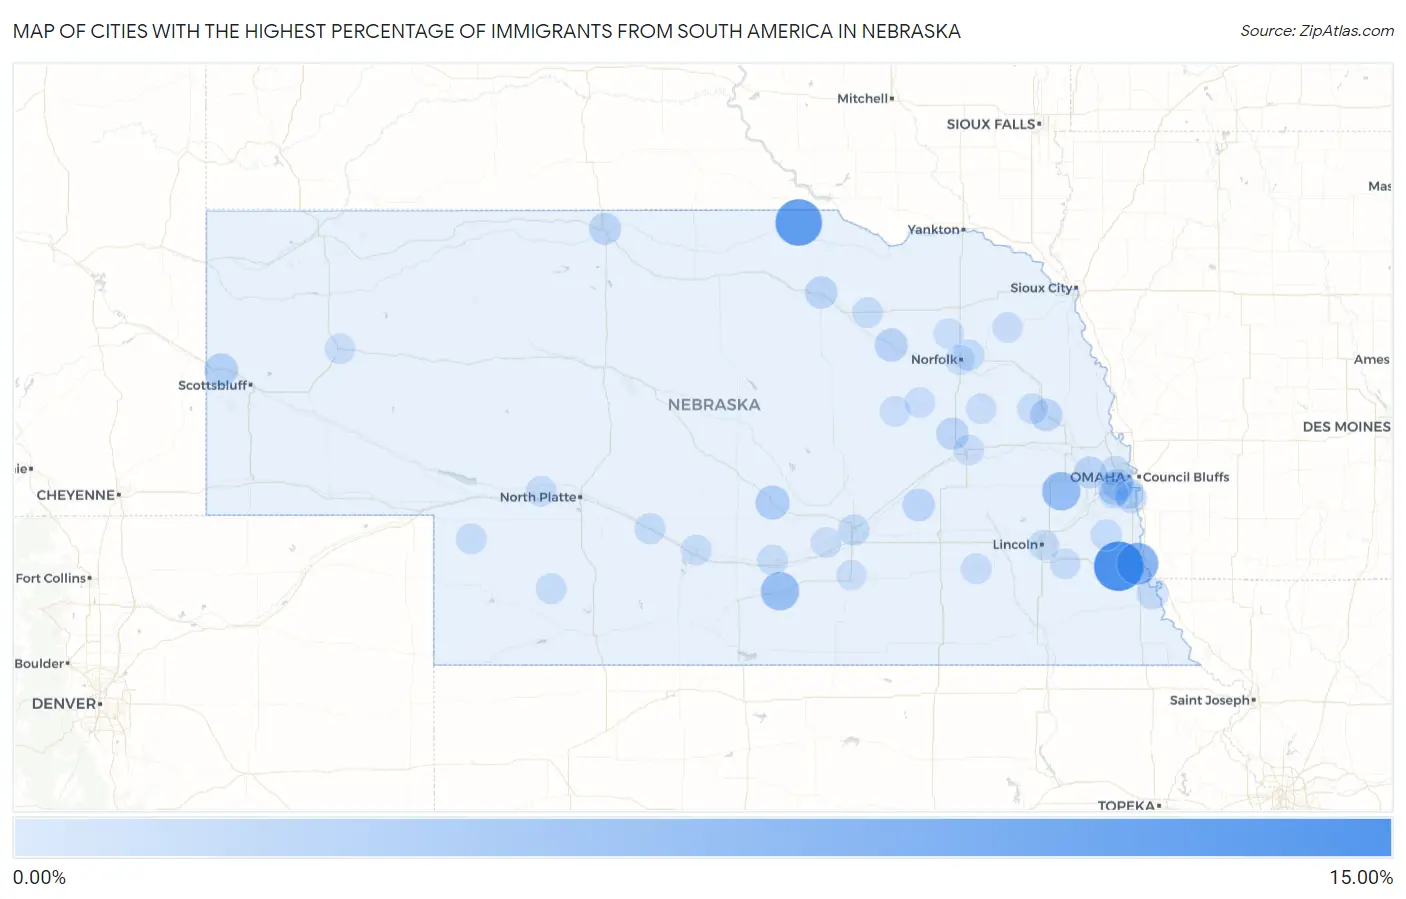
Map of Cities with the Highest Percentage of Immigrants from South America in Nebraska
0.00%
15.00%
Cities with the Highest Percentage of Immigrants from South America in Nebraska
| City | South America | vs State | vs National | |
| 1. | Dunbar | 10.45% | 0.24%(+10.2)#139 | 1.10%(+9.35)#9,303 |
| 2. | Butte | 8.84% | 0.24%(+8.60)#140 | 1.10%(+7.74)#9,304 |
| 3. | Nebraska City | 6.09% | 0.24%(+5.85)#141 | 1.10%(+4.99)#9,305 |
| 4. | Ithaca | 4.38% | 0.24%(+4.14)#142 | 1.10%(+3.28)#9,306 |
| 5. | Minden | 4.26% | 0.24%(+4.01)#143 | 1.10%(+3.16)#9,307 |
| 6. | Hazard | 2.04% | 0.24%(+1.80)#144 | 1.10%(+0.943)#9,308 |
| 7. | Morrill | 1.68% | 0.24%(+1.44)#145 | 1.10%(+0.583)#9,309 |
| 8. | La Vista | 1.54% | 0.24%(+1.30)#146 | 1.10%(+0.445)#9,310 |
| 9. | Neligh | 1.48% | 0.24%(+1.23)#147 | 1.10%(+0.380)#9,311 |
| 10. | Polk | 1.19% | 0.24%(+0.946)#148 | 1.10%(+0.092)#9,312 |
| 11. | O Neill | 1.17% | 0.24%(+0.927)#149 | 1.10%(+0.074)#9,313 |
| 12. | Platte Center | 1.12% | 0.24%(+0.873)#162 | 1.10%(+0.019)#11,121 |
| 13. | Valentine | 1.03% | 0.24%(+0.786)#163 | 1.10%(-0.068)#11,122 |
| 14. | Scribner | 1.03% | 0.24%(+0.782)#195 | 1.10%(-0.071)#12,926 |
| 15. | Waterloo | 0.97% | 0.24%(+0.722)#196 | 1.10%(-0.132)#12,927 |
| 16. | Ralston | 0.91% | 0.24%(+0.669)#197 | 1.10%(-0.185)#12,928 |
| 17. | Offutt Afb | 0.71% | 0.24%(+0.466)#198 | 1.10%(-0.387)#12,929 |
| 18. | Peru | 0.69% | 0.24%(+0.443)#199 | 1.10%(-0.411)#12,930 |
| 19. | Grand Island | 0.62% | 0.24%(+0.375)#200 | 1.10%(-0.479)#12,931 |
| 20. | Woodland Park | 0.54% | 0.24%(+0.299)#201 | 1.10%(-0.554)#12,932 |
| 21. | Gothenburg | 0.52% | 0.24%(+0.275)#202 | 1.10%(-0.578)#12,933 |
| 22. | Weeping Water | 0.50% | 0.24%(+0.255)#203 | 1.10%(-0.599)#12,934 |
| 23. | Friend | 0.36% | 0.24%(+0.114)#204 | 1.10%(-0.740)#12,935 |
| 24. | Hayes Center | 0.35% | 0.24%(+0.108)#205 | 1.10%(-0.746)#12,936 |
| 25. | Sutherland | 0.34% | 0.24%(+0.093)#206 | 1.10%(-0.760)#12,937 |
| 26. | Omaha | 0.34% | 0.24%(+0.091)#207 | 1.10%(-0.763)#12,938 |
| 27. | Kearney | 0.33% | 0.24%(+0.087)#208 | 1.10%(-0.767)#12,939 |
| 28. | Lexington | 0.33% | 0.24%(+0.084)#209 | 1.10%(-0.770)#12,940 |
| 29. | Snyder | 0.30% | 0.24%(+0.060)#210 | 1.10%(-0.793)#12,941 |
| 30. | Grant | 0.29% | 0.24%(+0.042)#211 | 1.10%(-0.812)#12,942 |
| 31. | Lincoln | 0.28% | 0.24%(+0.038)#212 | 1.10%(-0.815)#12,943 |
| 32. | Bennet | 0.27% | 0.24%(+0.029)#213 | 1.10%(-0.825)#12,944 |
| 33. | Bellevue | 0.27% | 0.24%(+0.022)#214 | 1.10%(-0.831)#12,945 |
| 34. | Orchard | 0.26% | 0.24%(+0.017)#215 | 1.10%(-0.836)#12,946 |
| 35. | Pierce | 0.24% | 0.24%(-0.000)#216 | 1.10%(-0.854)#12,947 |
| 36. | Albion | 0.24% | 0.24%(-0.001)#217 | 1.10%(-0.855)#12,948 |
| 37. | Columbus | 0.24% | 0.24%(-0.003)#218 | 1.10%(-0.857)#12,949 |
| 38. | Leigh | 0.23% | 0.24%(-0.011)#219 | 1.10%(-0.865)#12,950 |
| 39. | Wood River | 0.21% | 0.24%(-0.031)#220 | 1.10%(-0.885)#12,951 |
| 40. | Newman Grove | 0.21% | 0.24%(-0.033)#221 | 1.10%(-0.887)#12,952 |
| 41. | Alliance | 0.18% | 0.24%(-0.060)#222 | 1.10%(-0.914)#12,994 |
| 42. | Wayne | 0.13% | 0.24%(-0.111)#223 | 1.10%(-0.964)#12,995 |
| 43. | Papillion | 0.075% | 0.24%(-0.170)#224 | 1.10%(-1.02)#12,996 |
| 44. | Norfolk | 0.042% | 0.24%(-0.202)#225 | 1.10%(-1.06)#12,997 |
| 45. | Hastings | 0.028% | 0.24%(-0.217)#226 | 1.10%(-1.07)#12,998 |
Common Questions
What are the Top 10 Cities with the Highest Percentage of Immigrants from South America in Nebraska?
Top 10 Cities with the Highest Percentage of Immigrants from South America in Nebraska are:
What city has the Highest Percentage of Immigrants from South America in Nebraska?
Dunbar has the Highest Percentage of Immigrants from South America in Nebraska with 10.45%.
What is the Percentage of Immigrants from South America in the State of Nebraska?
Percentage of Immigrants from South America in Nebraska is 0.24%.
What is the Percentage of Immigrants from South America in the United States?
Percentage of Immigrants from South America in the United States is 1.10%.