Zip Codes with the Highest Percentage of Population with a Degree in Visual and Performing Arts in Danville, IL
RELATED REPORTS & OPTIONS
Visual and Performing Arts
Danville
Compare Zip Codes
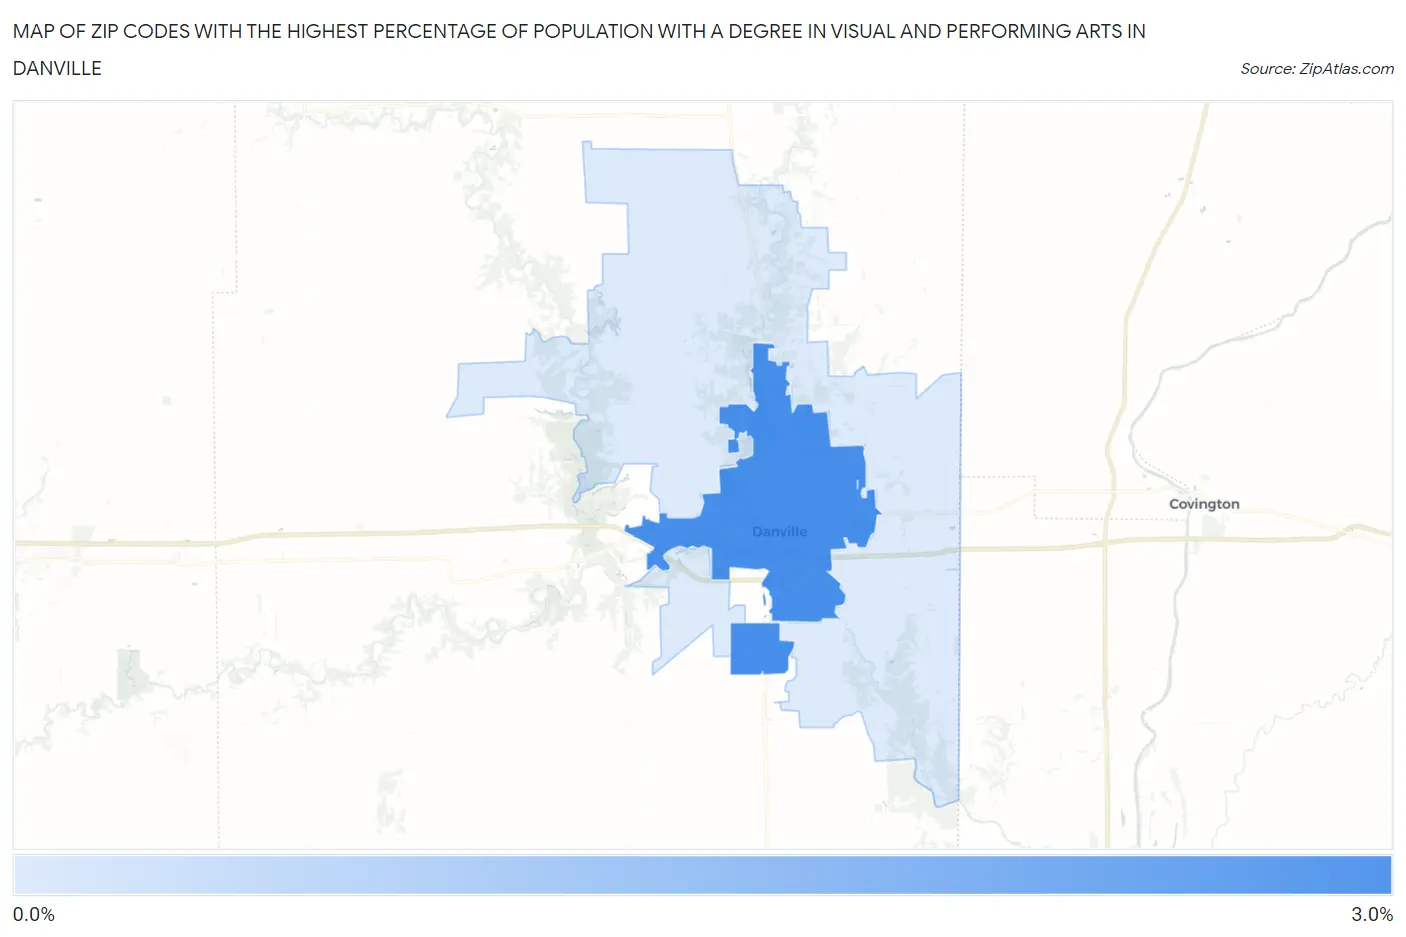
Map of Zip Codes with the Highest Percentage of Population with a Degree in Visual and Performing Arts in Danville
0.0%
3.0%
Zip Codes with the Highest Percentage of Population with a Degree in Visual and Performing Arts in Danville, IL
| Zip Code | % Graduates | vs State | vs National | |
| 1. | 61832 | 2.8% | 4.4%(-1.67)#557 | 4.3%(-1.47)#13,573 |
| 2. | 61834 | 0.99% | 4.4%(-3.46)#801 | 4.3%(-3.26)#19,684 |
1
Common Questions
What are the Top Zip Codes with the Highest Percentage of Population with a Degree in Visual and Performing Arts in Danville, IL?
Top Zip Codes with the Highest Percentage of Population with a Degree in Visual and Performing Arts in Danville, IL are:
What zip code has the Highest Percentage of Population with a Degree in Visual and Performing Arts in Danville, IL?
61832 has the Highest Percentage of Population with a Degree in Visual and Performing Arts in Danville, IL with 2.8%.
What is the Percentage of Population with a Degree in Visual and Performing Arts in Danville, IL?
Percentage of Population with a Degree in Visual and Performing Arts in Danville is 1.7%.
What is the Percentage of Population with a Degree in Visual and Performing Arts in Illinois?
Percentage of Population with a Degree in Visual and Performing Arts in Illinois is 4.4%.
What is the Percentage of Population with a Degree in Visual and Performing Arts in the United States?
Percentage of Population with a Degree in Visual and Performing Arts in the United States is 4.3%.