Zip Codes with the Highest Percentage of Population with a Degree in Visual and Performing Arts in Wheaton, IL
RELATED REPORTS & OPTIONS
Visual and Performing Arts
Wheaton
Compare Zip Codes
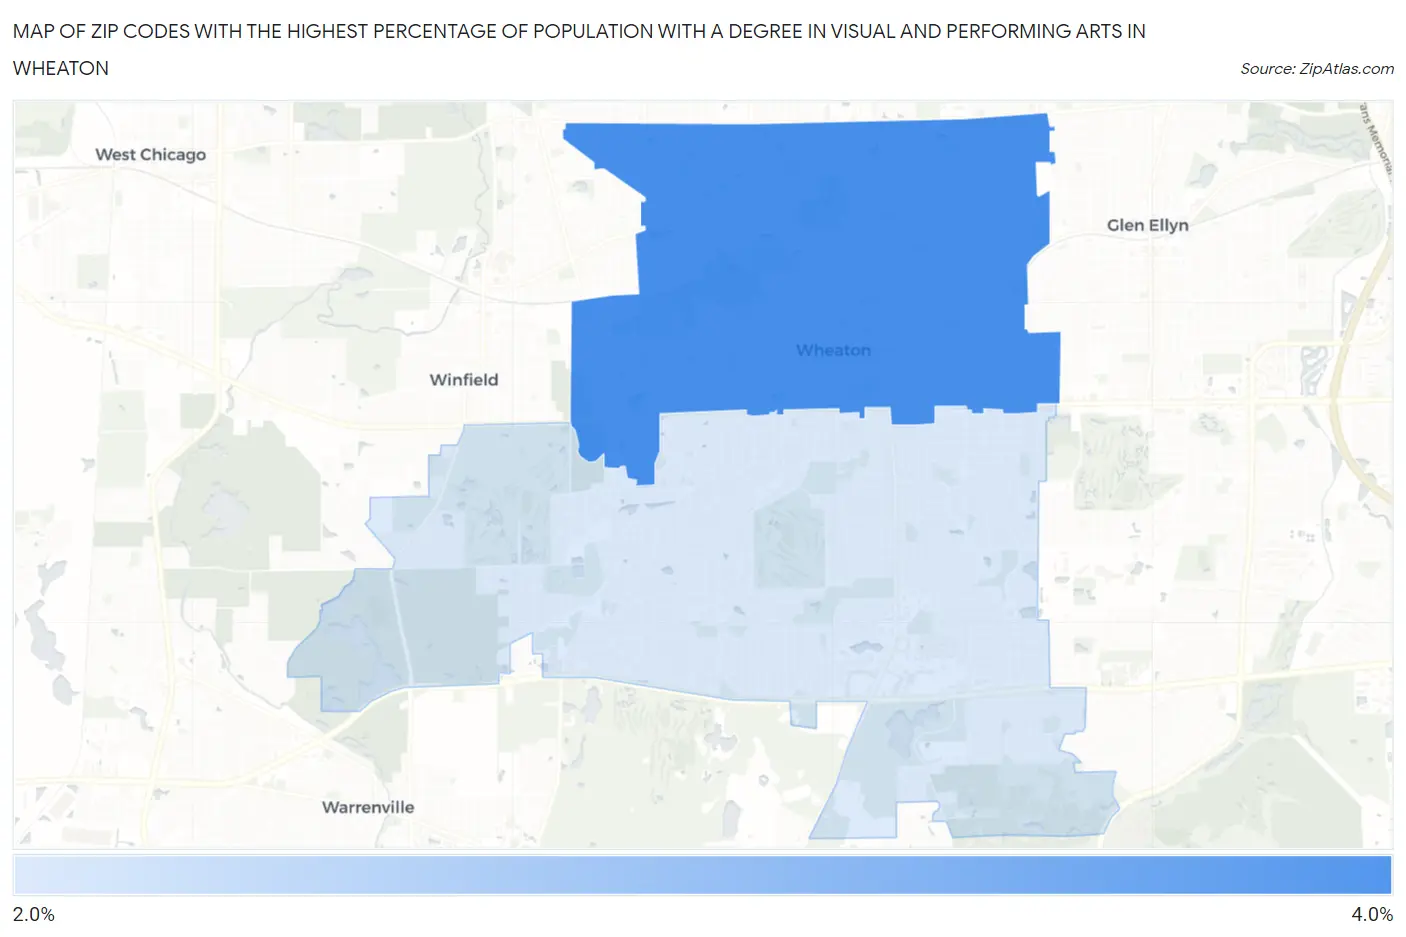
Map of Zip Codes with the Highest Percentage of Population with a Degree in Visual and Performing Arts in Wheaton
0.0%
4.0%
Zip Codes with the Highest Percentage of Population with a Degree in Visual and Performing Arts in Wheaton, IL
| Zip Code | % Graduates | vs State | vs National | |
| 1. | 60187 | 3.9% | 4.4%(-0.540)#375 | 4.3%(-0.342)#9,546 |
| 2. | 60189 | 2.8% | 4.4%(-1.69)#560 | 4.3%(-1.50)#13,678 |
1
Common Questions
What are the Top Zip Codes with the Highest Percentage of Population with a Degree in Visual and Performing Arts in Wheaton, IL?
Top Zip Codes with the Highest Percentage of Population with a Degree in Visual and Performing Arts in Wheaton, IL are:
What zip code has the Highest Percentage of Population with a Degree in Visual and Performing Arts in Wheaton, IL?
60187 has the Highest Percentage of Population with a Degree in Visual and Performing Arts in Wheaton, IL with 3.9%.
What is the Percentage of Population with a Degree in Visual and Performing Arts in Wheaton, IL?
Percentage of Population with a Degree in Visual and Performing Arts in Wheaton is 3.3%.
What is the Percentage of Population with a Degree in Visual and Performing Arts in Illinois?
Percentage of Population with a Degree in Visual and Performing Arts in Illinois is 4.4%.
What is the Percentage of Population with a Degree in Visual and Performing Arts in the United States?
Percentage of Population with a Degree in Visual and Performing Arts in the United States is 4.3%.