Elkhart, IL
Elkhart Map
Elkhart Overview
488
TOTAL POPULATION
229
MALE POPULATION
259
FEMALE POPULATION
88.42
MALES / 100 FEMALES
113.10
FEMALES / 100 MALES
40.8
MEDIAN AGE
3.1
AVG FAMILY SIZE
2.3
AVG HOUSEHOLD SIZE
$37,936
PER CAPITA INCOME
$106,875
AVG FAMILY INCOME
$89,792
AVG HOUSEHOLD INCOME
33.8%
WAGE / INCOME GAP [ % ]
66.2¢/ $1
WAGE / INCOME GAP [ $ ]
0.32
INEQUALITY / GINI INDEX
238
LABOR FORCE [ PEOPLE ]
67.6%
PERCENT IN LABOR FORCE
0.8%
UNEMPLOYMENT RATE
Elkhart Zip Codes
Elkhart Area Codes
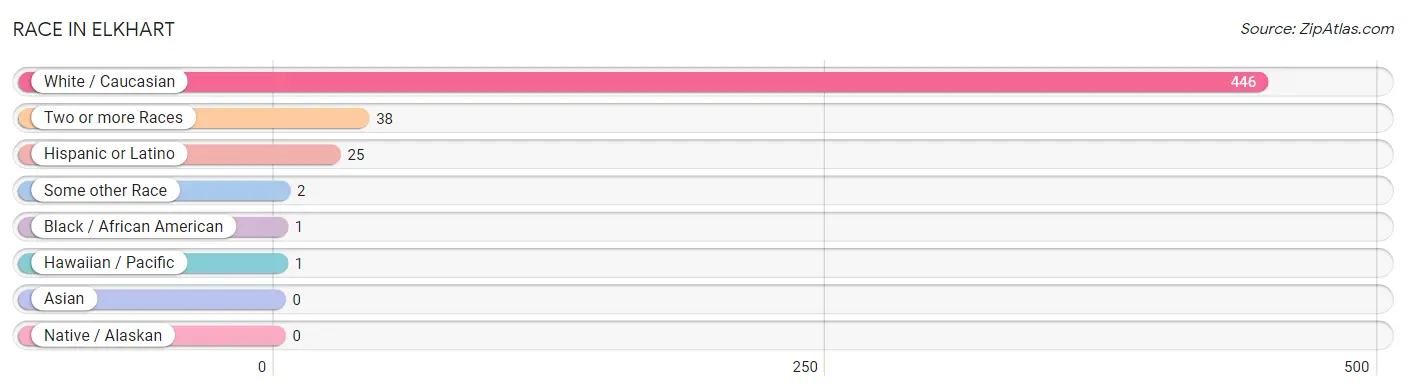
Race in Elkhart
The most populous races in Elkhart are White / Caucasian (446 | 91.4%), Two or more Races (38 | 7.8%), and Hispanic or Latino (25 | 5.1%).
| Race | # Population | % Population |
| Asian | 0 | 0.0% |
| Black / African American | 1 | 0.2% |
| Hawaiian / Pacific | 1 | 0.2% |
| Hispanic or Latino | 25 | 5.1% |
| Native / Alaskan | 0 | 0.0% |
| White / Caucasian | 446 | 91.4% |
| Two or more Races | 38 | 7.8% |
| Some other Race | 2 | 0.4% |
| Total | 488 | 100.0% |
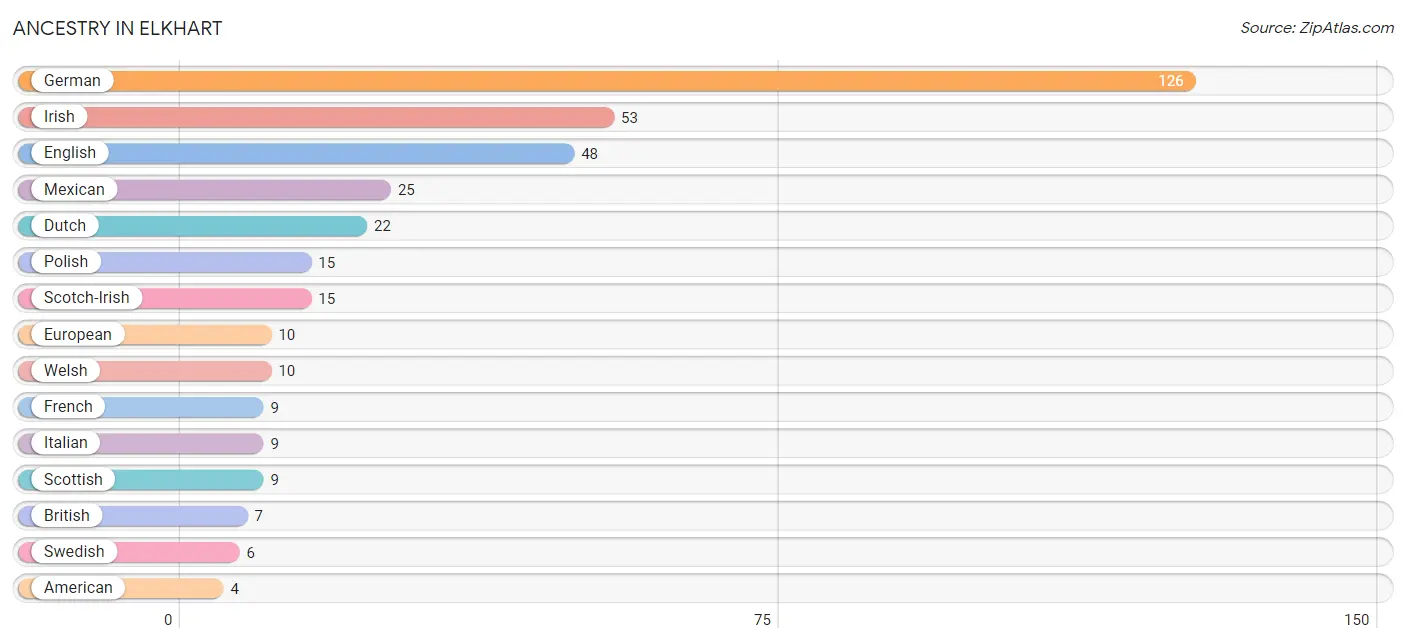
Ancestry in Elkhart
The most populous ancestries reported in Elkhart are German (126 | 25.8%), Irish (53 | 10.9%), English (48 | 9.8%), Mexican (25 | 5.1%), and Dutch (22 | 4.5%), together accounting for 56.1% of all Elkhart residents.
| Ancestry | # Population | % Population |
| American | 4 | 0.8% |
| Apache | 2 | 0.4% |
| Austrian | 2 | 0.4% |
| Belgian | 2 | 0.4% |
| British | 7 | 1.4% |
| Cherokee | 3 | 0.6% |
| Czech | 2 | 0.4% |
| Danish | 2 | 0.4% |
| Dutch | 22 | 4.5% |
| English | 48 | 9.8% |
| European | 10 | 2.1% |
| French | 9 | 1.8% |
| German | 126 | 25.8% |
| Indian (Asian) | 1 | 0.2% |
| Irish | 53 | 10.9% |
| Italian | 9 | 1.8% |
| Korean | 4 | 0.8% |
| Lithuanian | 3 | 0.6% |
| Mexican | 25 | 5.1% |
| Native Hawaiian | 1 | 0.2% |
| Northern European | 2 | 0.4% |
| Norwegian | 2 | 0.4% |
| Polish | 15 | 3.1% |
| Portuguese | 2 | 0.4% |
| Scotch-Irish | 15 | 3.1% |
| Scottish | 9 | 1.8% |
| Slovak | 2 | 0.4% |
| Swedish | 6 | 1.2% |
| Swiss | 4 | 0.8% |
| Welsh | 10 | 2.1% |
| Yugoslavian | 2 | 0.4% | View All 31 Rows |
Immigrants in Elkhart

| Immigration Origin | # Population | % Population | View All 0 Rows |
Sex and Age in Elkhart
Sex and Age in Elkhart
The most populous age groups in Elkhart are 10 to 14 Years (40 | 17.5%) for men and 45 to 49 Years (44 | 17.0%) for women.

| Age Bracket | Male | Female |
| Under 5 Years | 12 (5.2%) | 8 (3.1%) |
| 5 to 9 Years | 26 (11.4%) | 21 (8.1%) |
| 10 to 14 Years | 40 (17.5%) | 20 (7.7%) |
| 15 to 19 Years | 6 (2.6%) | 13 (5.0%) |
| 20 to 24 Years | 6 (2.6%) | 3 (1.2%) |
| 25 to 29 Years | 4 (1.8%) | 11 (4.3%) |
| 30 to 34 Years | 9 (3.9%) | 12 (4.6%) |
| 35 to 39 Years | 26 (11.4%) | 21 (8.1%) |
| 40 to 44 Years | 20 (8.7%) | 5 (1.9%) |
| 45 to 49 Years | 14 (6.1%) | 44 (17.0%) |
| 50 to 54 Years | 18 (7.9%) | 2 (0.8%) |
| 55 to 59 Years | 12 (5.2%) | 22 (8.5%) |
| 60 to 64 Years | 9 (3.9%) | 16 (6.2%) |
| 65 to 69 Years | 15 (6.6%) | 25 (9.7%) |
| 70 to 74 Years | 5 (2.2%) | 9 (3.5%) |
| 75 to 79 Years | 6 (2.6%) | 7 (2.7%) |
| 80 to 84 Years | 0 (0.0%) | 8 (3.1%) |
| 85 Years and over | 1 (0.4%) | 12 (4.6%) |
| Total | 229 (100.0%) | 259 (100.0%) |
Families and Households in Elkhart
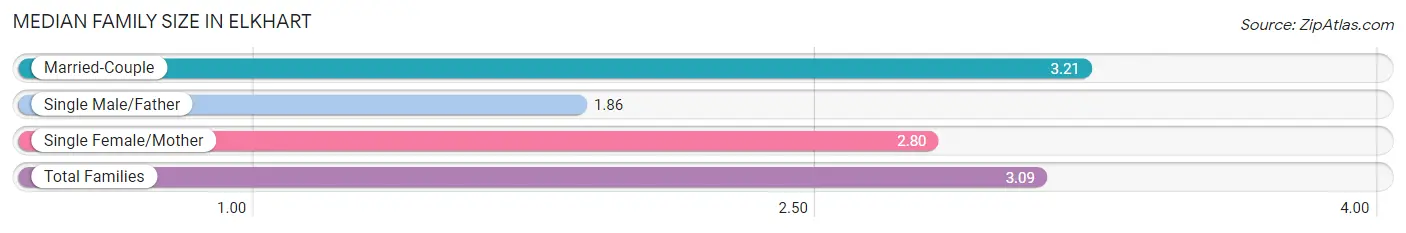
Median Family Size in Elkhart
The median family size in Elkhart is 3.09 persons per family, with married-couple families (105 | 82.7%) accounting for the largest median family size of 3.21 persons per family. On the other hand, single male/father families (7 | 5.5%) represent the smallest median family size with 1.86 persons per family.
| Family Type | # Families | Family Size |
| Married-Couple | 105 (82.7%) | 3.21 |
| Single Male/Father | 7 (5.5%) | 1.86 |
| Single Female/Mother | 15 (11.8%) | 2.80 |
| Total Families | 127 (100.0%) | 3.09 |
Median Household Size in Elkhart
The median household size in Elkhart is 2.29 persons per household, with married-couple households (105 | 49.3%) accounting for the largest median household size of 3.21 persons per household. non-family households (86 | 40.4%) represent the smallest median household size with 1.10 persons per household.
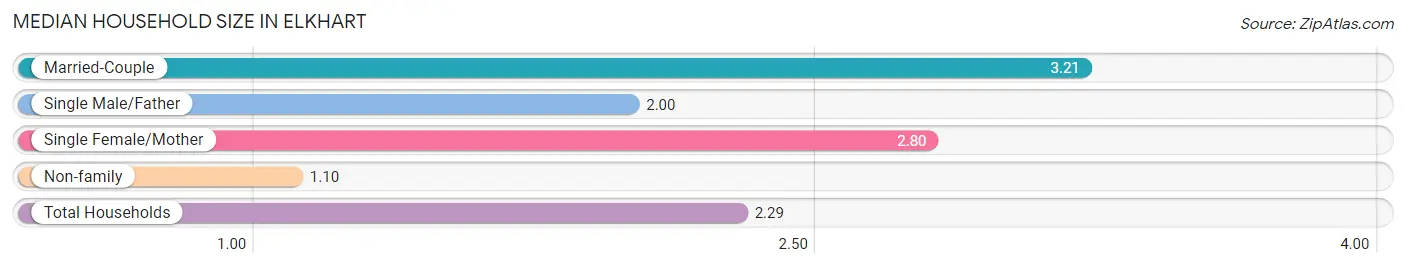
| Household Type | # Households | Household Size |
| Married-Couple | 105 (49.3%) | 3.21 |
| Single Male/Father | 7 (3.3%) | 2.00 |
| Single Female/Mother | 15 (7.0%) | 2.80 |
| Non-family | 86 (40.4%) | 1.10 |
| Total Households | 213 (100.0%) | 2.29 |
Household Size by Marriage Status in Elkhart
Out of a total of 213 households in Elkhart, 127 (59.6%) are family households, while 86 (40.4%) are nonfamily households. The most numerous type of family households are 2-person households, comprising 55, and the most common type of nonfamily households are 1-person households, comprising 77.
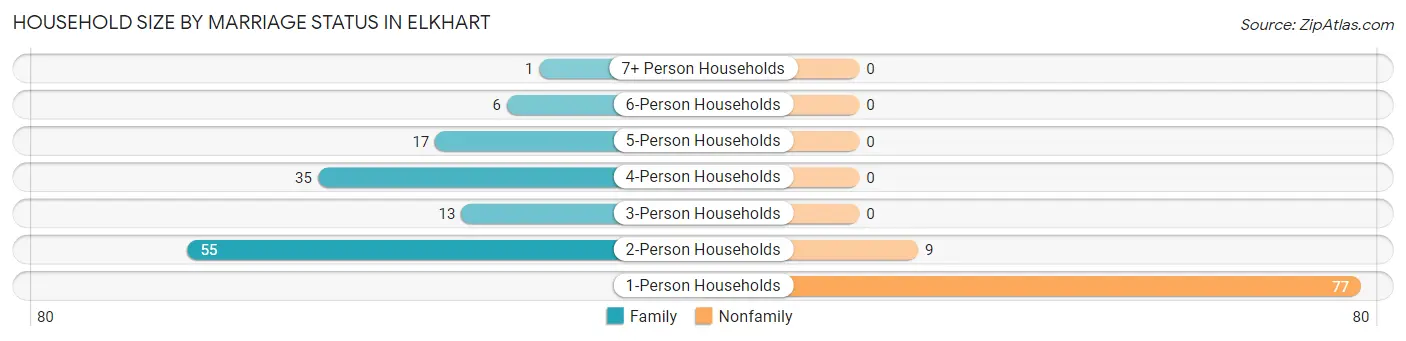
| Household Size | Family Households | Nonfamily Households |
| 1-Person Households | - | 77 (36.1%) |
| 2-Person Households | 55 (25.8%) | 9 (4.2%) |
| 3-Person Households | 13 (6.1%) | 0 (0.0%) |
| 4-Person Households | 35 (16.4%) | 0 (0.0%) |
| 5-Person Households | 17 (8.0%) | 0 (0.0%) |
| 6-Person Households | 6 (2.8%) | 0 (0.0%) |
| 7+ Person Households | 1 (0.5%) | 0 (0.0%) |
| Total | 127 (59.6%) | 86 (40.4%) |
Female Fertility in Elkhart
Fertility by Age in Elkhart
Average fertility rate in Elkhart is 37.0 births per 1,000 women. Women in the age bracket of 20 to 34 years have the highest fertility rate with 115.0 births per 1,000 women. Women in the age bracket of 20 to 34 years acount for 75.0% of all women with births.
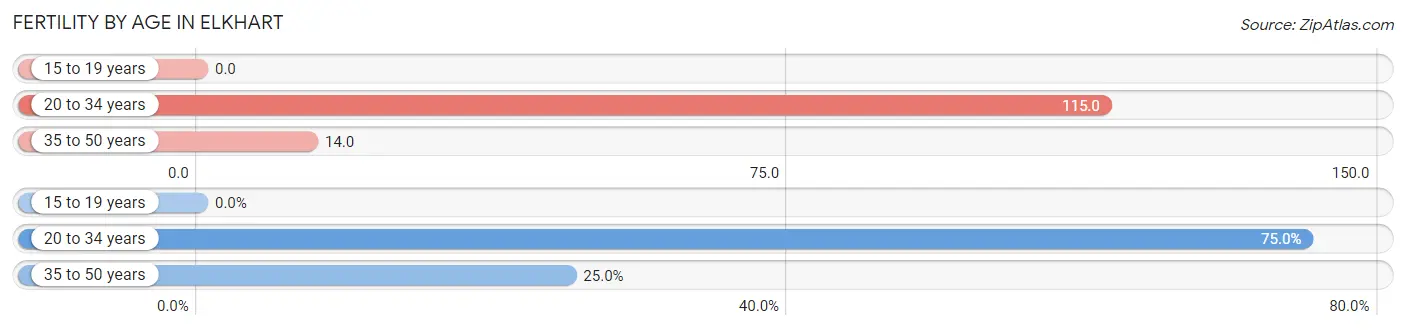
| Age Bracket | Women with Births | Births / 1,000 Women |
| 15 to 19 years | 0 (0.0%) | 0.0 |
| 20 to 34 years | 3 (75.0%) | 115.0 |
| 35 to 50 years | 1 (25.0%) | 14.0 |
| Total | 4 (100.0%) | 37.0 |
Fertility by Age by Marriage Status in Elkhart

| Age Bracket | Married | Unmarried |
| 15 to 19 years | 0 (0.0%) | 0 (0.0%) |
| 20 to 34 years | 3 (100.0%) | 0 (0.0%) |
| 35 to 50 years | 1 (100.0%) | 0 (0.0%) |
| Total | 4 (100.0%) | 0 (0.0%) |
Fertility by Education in Elkhart
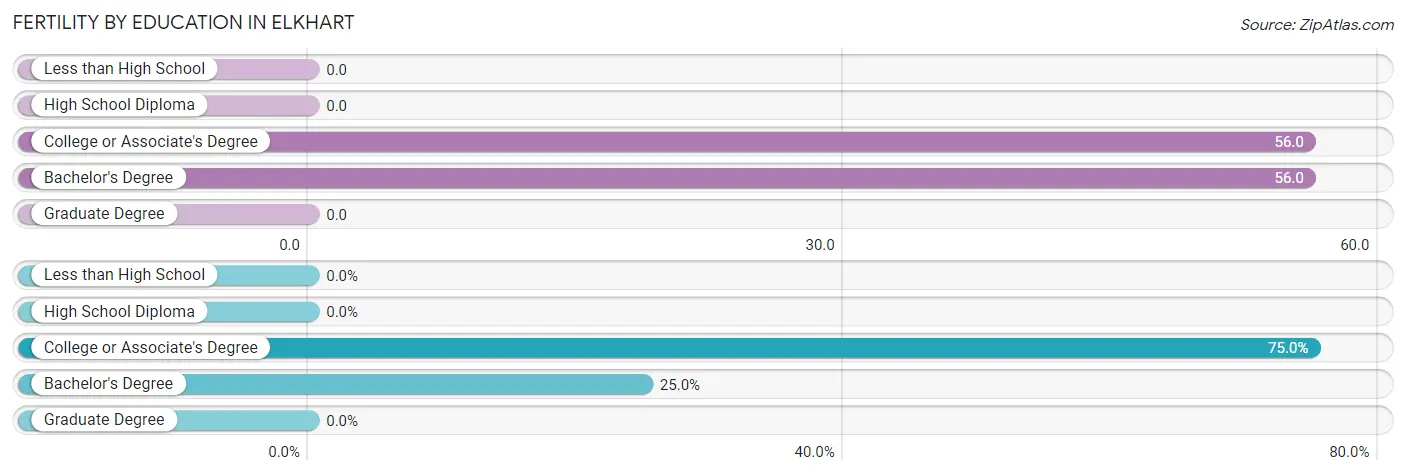
| Educational Attainment | Women with Births | Births / 1,000 Women |
| Less than High School | 0 (0.0%) | 0.0 |
| High School Diploma | 0 (0.0%) | 0.0 |
| College or Associate's Degree | 3 (75.0%) | 56.0 |
| Bachelor's Degree | 1 (25.0%) | 56.0 |
| Graduate Degree | 0 (0.0%) | 0.0 |
| Total | 4 (100.0%) | 37.0 |
Fertility by Education by Marriage Status in Elkhart
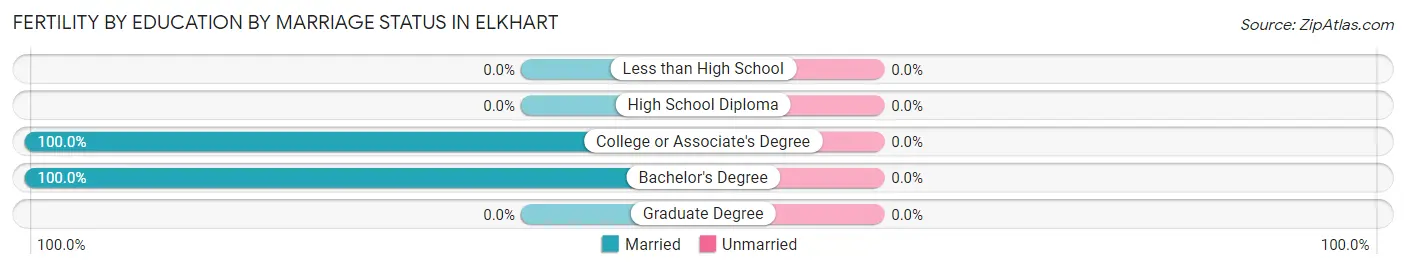
| Educational Attainment | Married | Unmarried |
| Less than High School | 0 (0.0%) | 0 (0.0%) |
| High School Diploma | 0 (0.0%) | 0 (0.0%) |
| College or Associate's Degree | 3 (100.0%) | 0 (0.0%) |
| Bachelor's Degree | 1 (100.0%) | 0 (0.0%) |
| Graduate Degree | 0 (0.0%) | 0 (0.0%) |
| Total | 4 (100.0%) | 0 (0.0%) |
Income in Elkhart
Income Overview in Elkhart
Per Capita Income in Elkhart is $37,936, while median incomes of families and households are $106,875 and $89,792 respectively.
| Characteristic | Number | Measure |
| Per Capita Income | 488 | $37,936 |
| Median Family Income | 127 | $106,875 |
| Mean Family Income | 127 | $110,117 |
| Median Household Income | 213 | $89,792 |
| Mean Household Income | 213 | $89,115 |
| Income Deficit | 127 | $0 |
| Wage / Income Gap (%) | 488 | 33.77% |
| Wage / Income Gap ($) | 488 | 66.23¢ per $1 |
| Gini / Inequality Index | 488 | 0.32 |
Earnings by Sex in Elkhart
Average Earnings in Elkhart are $52,833, $70,000 for men and $46,364 for women, a difference of 33.8%.
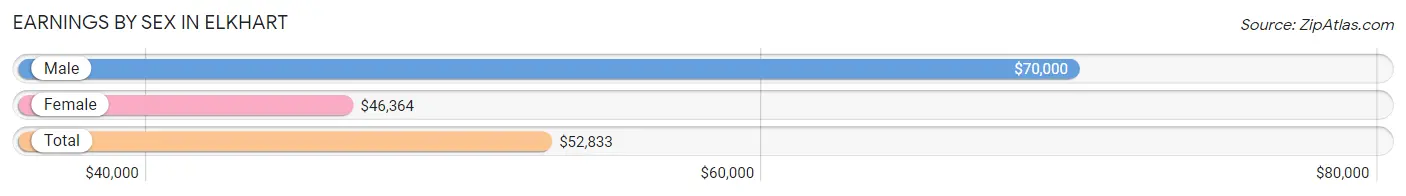
| Sex | Number | Average Earnings |
| Male | 122 (49.2%) | $70,000 |
| Female | 126 (50.8%) | $46,364 |
| Total | 248 (100.0%) | $52,833 |
Earnings by Sex by Income Bracket in Elkhart
The most common earnings brackets in Elkhart are $100,000+ for men (39 | 32.0%) and $55,000 to $64,999 for women (26 | 20.6%).
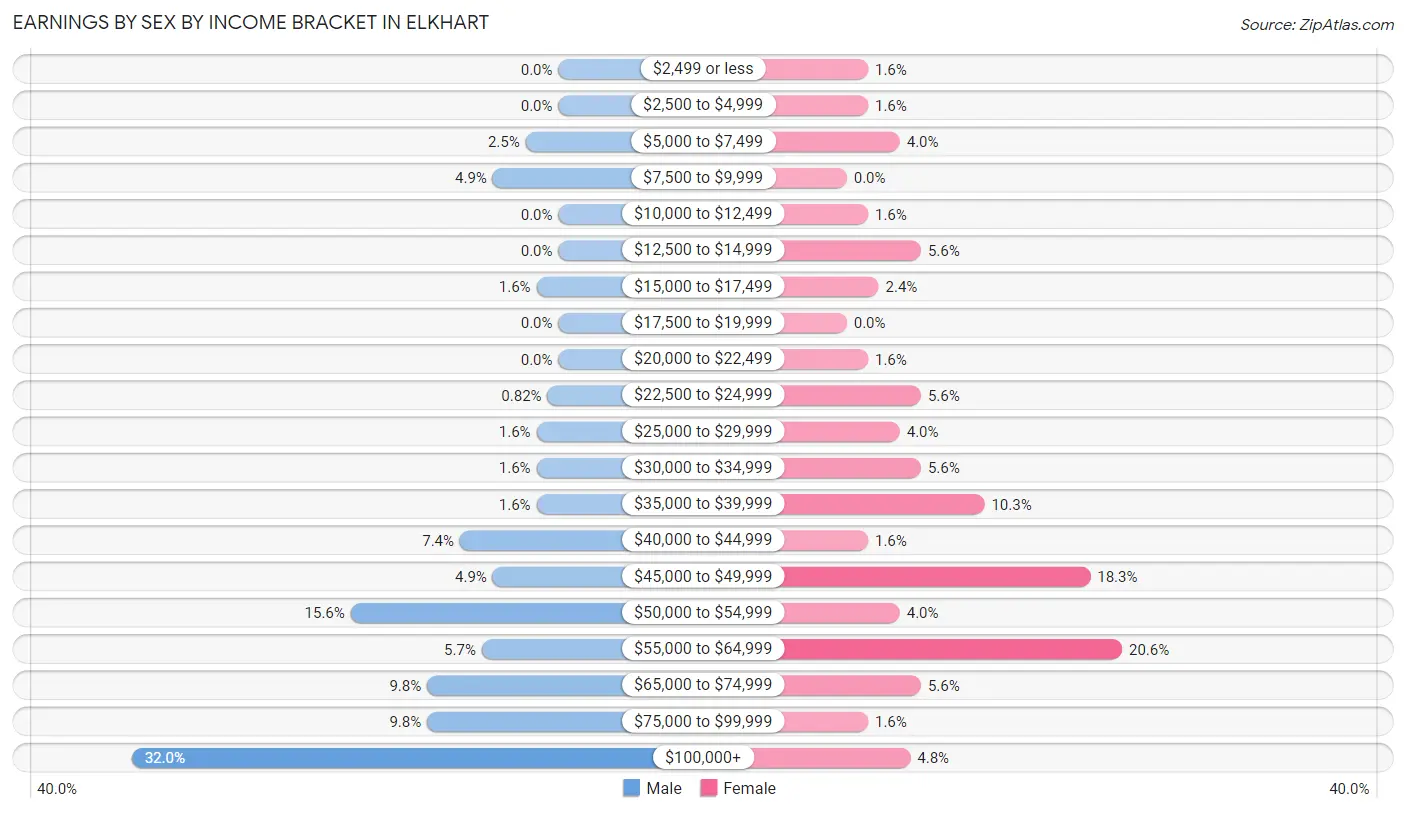
| Income | Male | Female |
| $2,499 or less | 0 (0.0%) | 2 (1.6%) |
| $2,500 to $4,999 | 0 (0.0%) | 2 (1.6%) |
| $5,000 to $7,499 | 3 (2.5%) | 5 (4.0%) |
| $7,500 to $9,999 | 6 (4.9%) | 0 (0.0%) |
| $10,000 to $12,499 | 0 (0.0%) | 2 (1.6%) |
| $12,500 to $14,999 | 0 (0.0%) | 7 (5.6%) |
| $15,000 to $17,499 | 2 (1.6%) | 3 (2.4%) |
| $17,500 to $19,999 | 0 (0.0%) | 0 (0.0%) |
| $20,000 to $22,499 | 0 (0.0%) | 2 (1.6%) |
| $22,500 to $24,999 | 1 (0.8%) | 7 (5.6%) |
| $25,000 to $29,999 | 2 (1.6%) | 5 (4.0%) |
| $30,000 to $34,999 | 2 (1.6%) | 7 (5.6%) |
| $35,000 to $39,999 | 2 (1.6%) | 13 (10.3%) |
| $40,000 to $44,999 | 9 (7.4%) | 2 (1.6%) |
| $45,000 to $49,999 | 6 (4.9%) | 23 (18.2%) |
| $50,000 to $54,999 | 19 (15.6%) | 5 (4.0%) |
| $55,000 to $64,999 | 7 (5.7%) | 26 (20.6%) |
| $65,000 to $74,999 | 12 (9.8%) | 7 (5.6%) |
| $75,000 to $99,999 | 12 (9.8%) | 2 (1.6%) |
| $100,000+ | 39 (32.0%) | 6 (4.8%) |
| Total | 122 (100.0%) | 126 (100.0%) |
Earnings by Sex by Educational Attainment in Elkhart
Average earnings in Elkhart are $70,536 for men and $46,591 for women, a difference of 34.0%. Men with an educational attainment of graduate degree enjoy the highest average annual earnings of $107,813, while those with college or associate's degree education earn the least with $51,806. Women with an educational attainment of college or associate's degree earn the most with the average annual earnings of $48,375, while those with graduate degree education have the smallest earnings of $35,938.

| Educational Attainment | Male Income | Female Income |
| Less than High School | - | - |
| High School Diploma | $70,417 | $40,000 |
| College or Associate's Degree | $51,806 | $48,375 |
| Bachelor's Degree | $103,906 | $48,125 |
| Graduate Degree | $107,813 | $35,938 |
| Total | $70,536 | $46,591 |
Family Income in Elkhart
Family Income Brackets in Elkhart
According to the Elkhart family income data, there are 45 families falling into the $100,000 to $149,999 income range, which is the most common income bracket and makes up 35.4% of all families.
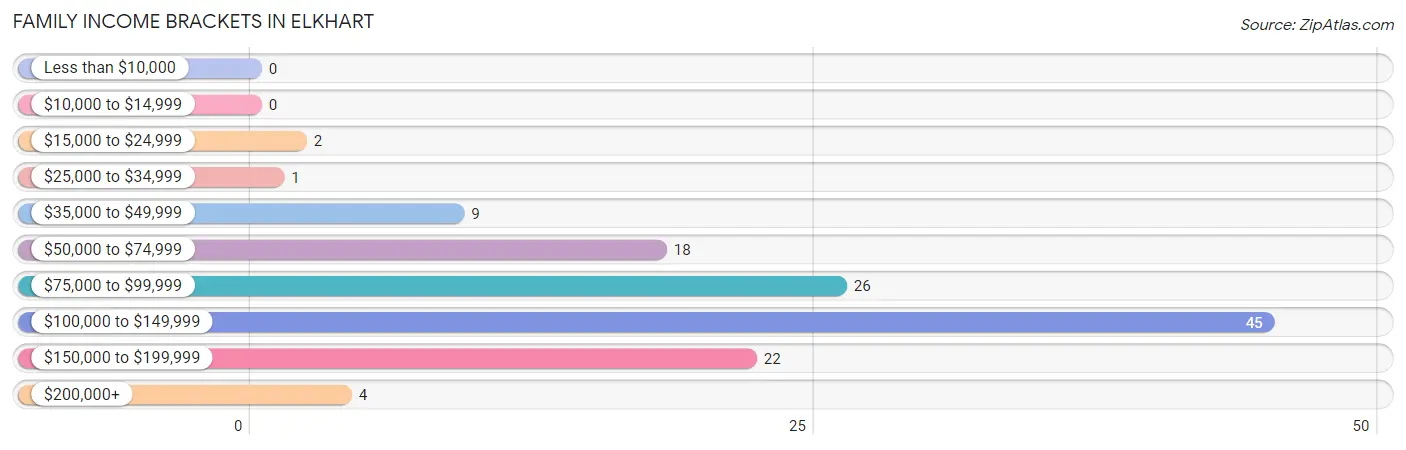
| Income Bracket | # Families | % Families |
| Less than $10,000 | 0 | 0.0% |
| $10,000 to $14,999 | 0 | 0.0% |
| $15,000 to $24,999 | 2 | 1.6% |
| $25,000 to $34,999 | 1 | 0.8% |
| $35,000 to $49,999 | 9 | 7.1% |
| $50,000 to $74,999 | 18 | 14.2% |
| $75,000 to $99,999 | 26 | 20.5% |
| $100,000 to $149,999 | 45 | 35.4% |
| $150,000 to $199,999 | 22 | 17.3% |
| $200,000+ | 4 | 3.1% |
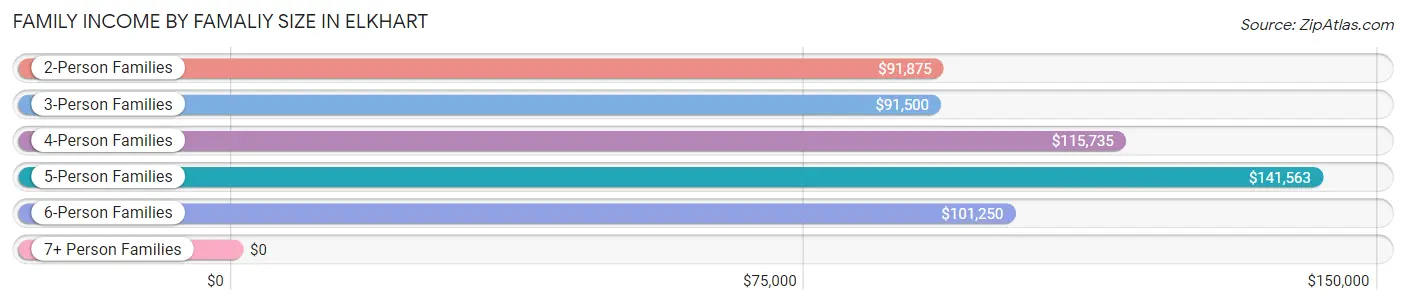
Family Income by Famaliy Size in Elkhart
5-person families (17 | 13.4%) account for the highest median family income in Elkhart with $141,563 per family, while 2-person families (55 | 43.3%) have the highest median income of $45,938 per family member.
| Income Bracket | # Families | Median Income |
| 2-Person Families | 55 (43.3%) | $91,875 |
| 3-Person Families | 14 (11.0%) | $91,500 |
| 4-Person Families | 34 (26.8%) | $115,735 |
| 5-Person Families | 17 (13.4%) | $141,563 |
| 6-Person Families | 6 (4.7%) | $101,250 |
| 7+ Person Families | 1 (0.8%) | $0 |
| Total | 127 (100.0%) | $106,875 |
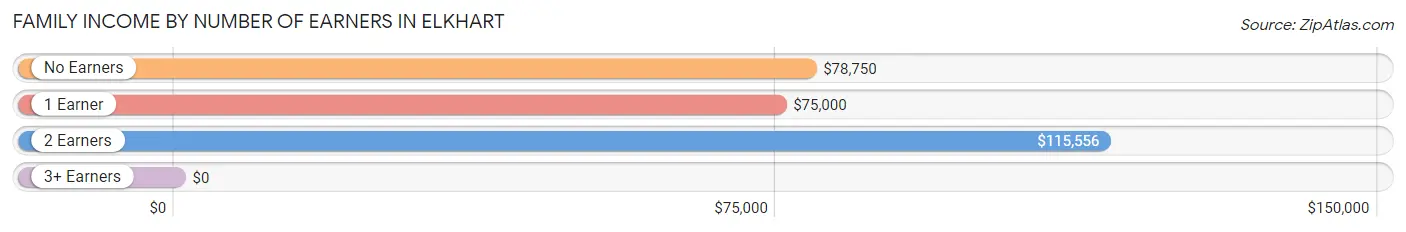
Family Income by Number of Earners in Elkhart
| Number of Earners | # Families | Median Income |
| No Earners | 10 (7.9%) | $78,750 |
| 1 Earner | 40 (31.5%) | $75,000 |
| 2 Earners | 74 (58.3%) | $115,556 |
| 3+ Earners | 3 (2.4%) | $0 |
| Total | 127 (100.0%) | $106,875 |
Household Income in Elkhart
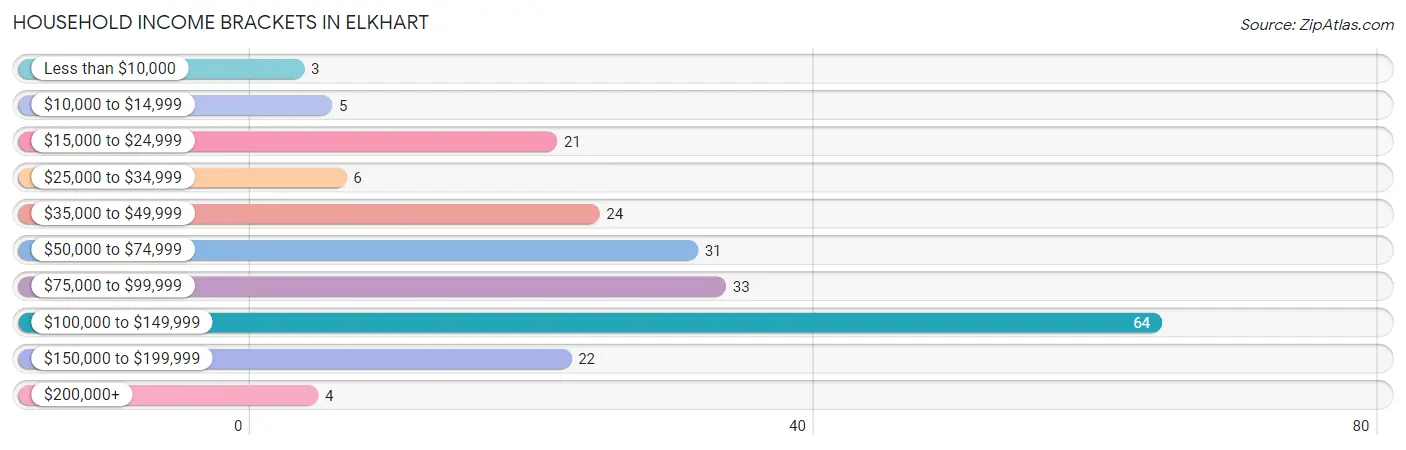
Household Income Brackets in Elkhart
With 64 households falling in the category, the $100,000 to $149,999 income range is the most frequent in Elkhart, accounting for 30.0% of all households. In contrast, only 3 households (1.4%) fall into the less than $10,000 income bracket, making it the least populous group.
| Income Bracket | # Households | % Households |
| Less than $10,000 | 3 | 1.4% |
| $10,000 to $14,999 | 5 | 2.3% |
| $15,000 to $24,999 | 21 | 9.9% |
| $25,000 to $34,999 | 6 | 2.8% |
| $35,000 to $49,999 | 24 | 11.3% |
| $50,000 to $74,999 | 31 | 14.6% |
| $75,000 to $99,999 | 33 | 15.5% |
| $100,000 to $149,999 | 64 | 30.0% |
| $150,000 to $199,999 | 22 | 10.3% |
| $200,000+ | 4 | 1.9% |
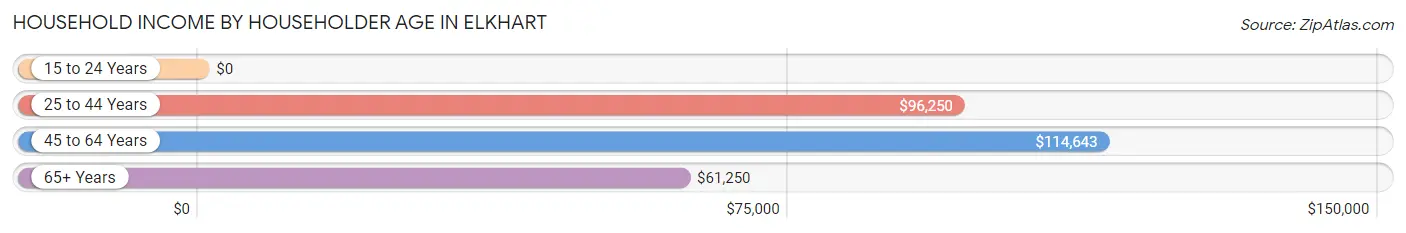
Household Income by Householder Age in Elkhart
The median household income in Elkhart is $89,792, with the highest median household income of $114,643 found in the 45 to 64 years age bracket for the primary householder. A total of 90 households (42.2%) fall into this category.
| Income Bracket | # Households | Median Income |
| 15 to 24 Years | 0 (0.0%) | $0 |
| 25 to 44 Years | 55 (25.8%) | $96,250 |
| 45 to 64 Years | 90 (42.2%) | $114,643 |
| 65+ Years | 68 (31.9%) | $61,250 |
| Total | 213 (100.0%) | $89,792 |
Poverty in Elkhart
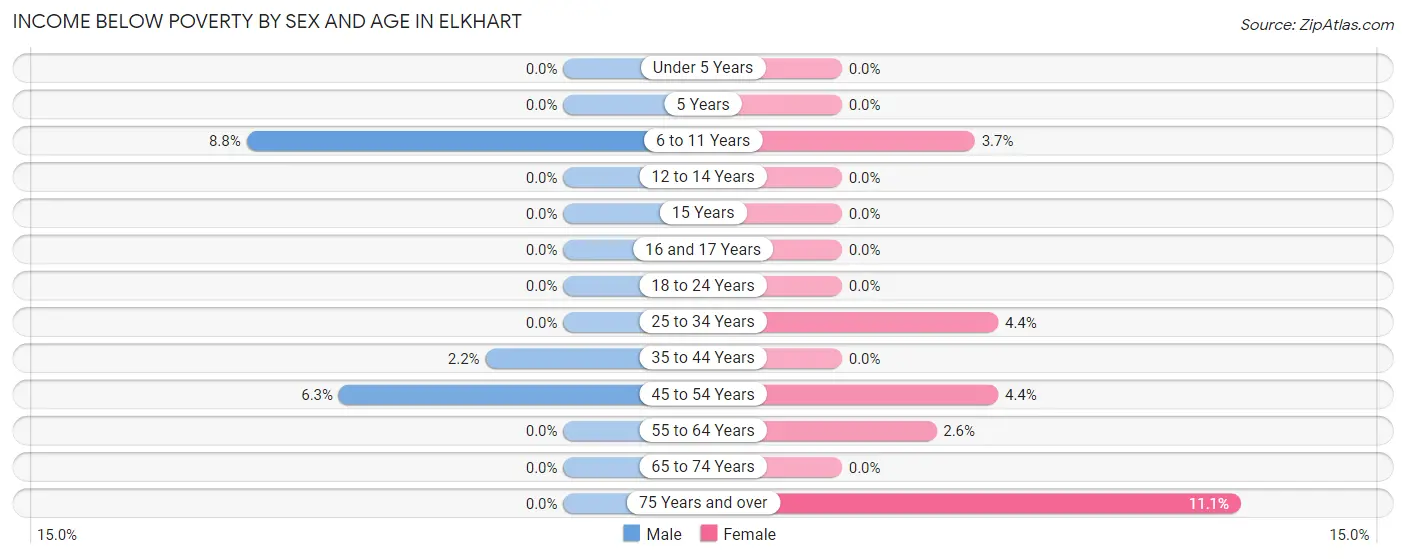
Income Below Poverty by Sex and Age in Elkhart
With 2.6% poverty level for males and 3.1% for females among the residents of Elkhart, 6 to 11 year old males and 75 year old and over females are the most vulnerable to poverty, with 3 males (8.8%) and 3 females (11.1%) in their respective age groups living below the poverty level.
| Age Bracket | Male | Female |
| Under 5 Years | 0 (0.0%) | 0 (0.0%) |
| 5 Years | 0 (0.0%) | 0 (0.0%) |
| 6 to 11 Years | 3 (8.8%) | 1 (3.7%) |
| 12 to 14 Years | 0 (0.0%) | 0 (0.0%) |
| 15 Years | 0 (0.0%) | 0 (0.0%) |
| 16 and 17 Years | 0 (0.0%) | 0 (0.0%) |
| 18 to 24 Years | 0 (0.0%) | 0 (0.0%) |
| 25 to 34 Years | 0 (0.0%) | 1 (4.3%) |
| 35 to 44 Years | 1 (2.2%) | 0 (0.0%) |
| 45 to 54 Years | 2 (6.2%) | 2 (4.3%) |
| 55 to 64 Years | 0 (0.0%) | 1 (2.6%) |
| 65 to 74 Years | 0 (0.0%) | 0 (0.0%) |
| 75 Years and over | 0 (0.0%) | 3 (11.1%) |
| Total | 6 (2.6%) | 8 (3.1%) |
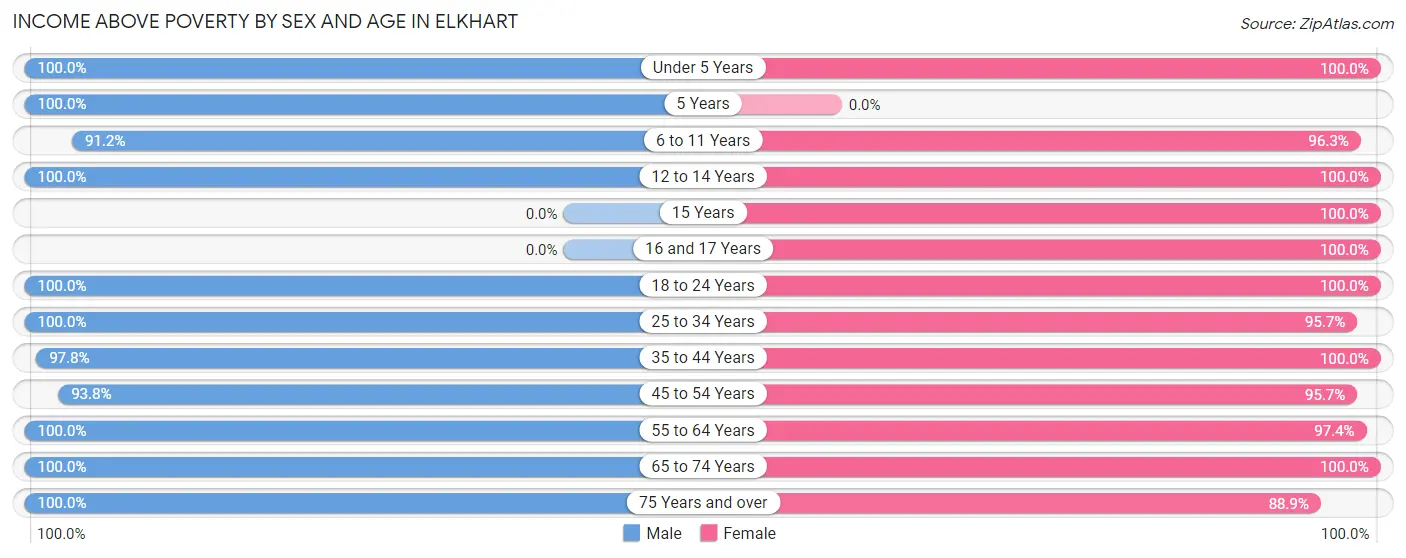
Income Above Poverty by Sex and Age in Elkhart
According to the poverty statistics in Elkhart, males aged under 5 years and females aged under 5 years are the age groups that are most secure financially, with 100.0% of males and 100.0% of females in these age groups living above the poverty line.
| Age Bracket | Male | Female |
| Under 5 Years | 12 (100.0%) | 8 (100.0%) |
| 5 Years | 6 (100.0%) | 0 (0.0%) |
| 6 to 11 Years | 31 (91.2%) | 26 (96.3%) |
| 12 to 14 Years | 26 (100.0%) | 14 (100.0%) |
| 15 Years | 0 (0.0%) | 9 (100.0%) |
| 16 and 17 Years | 0 (0.0%) | 4 (100.0%) |
| 18 to 24 Years | 12 (100.0%) | 3 (100.0%) |
| 25 to 34 Years | 13 (100.0%) | 22 (95.7%) |
| 35 to 44 Years | 45 (97.8%) | 26 (100.0%) |
| 45 to 54 Years | 30 (93.8%) | 44 (95.7%) |
| 55 to 64 Years | 21 (100.0%) | 37 (97.4%) |
| 65 to 74 Years | 20 (100.0%) | 34 (100.0%) |
| 75 Years and over | 7 (100.0%) | 24 (88.9%) |
| Total | 223 (97.4%) | 251 (96.9%) |
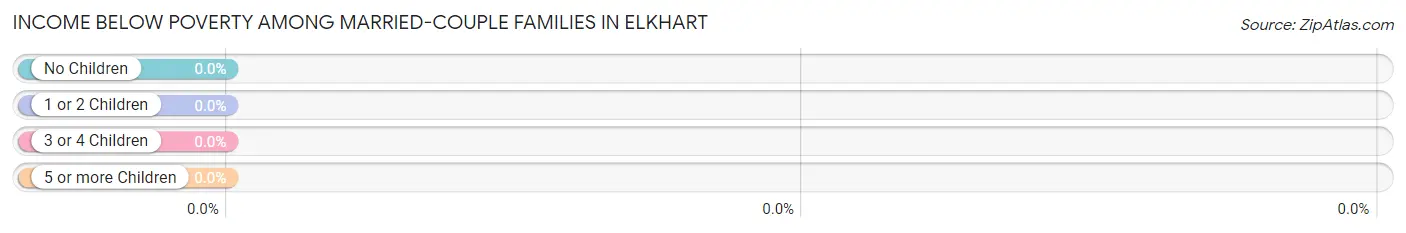
Income Below Poverty Among Married-Couple Families in Elkhart
| Children | Above Poverty | Below Poverty |
| No Children | 48 (100.0%) | 0 (0.0%) |
| 1 or 2 Children | 35 (100.0%) | 0 (0.0%) |
| 3 or 4 Children | 21 (100.0%) | 0 (0.0%) |
| 5 or more Children | 1 (100.0%) | 0 (0.0%) |
| Total | 105 (100.0%) | 0 (0.0%) |
Income Below Poverty Among Single-Parent Households in Elkhart

| Children | Single Father | Single Mother |
| No Children | 0 (0.0%) | 0 (0.0%) |
| 1 or 2 Children | 0 (0.0%) | 1 (20.0%) |
| 3 or 4 Children | 0 (0.0%) | 0 (0.0%) |
| 5 or more Children | 0 (0.0%) | 0 (0.0%) |
| Total | 0 (0.0%) | 1 (6.7%) |
Income Below Poverty Among Married-Couple vs Single-Parent Households in Elkhart
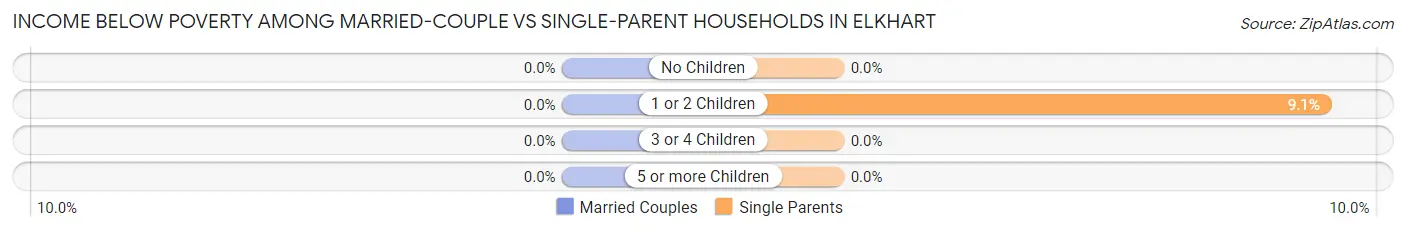
| Children | Married-Couple Families | Single-Parent Households |
| No Children | 0 (0.0%) | 0 (0.0%) |
| 1 or 2 Children | 0 (0.0%) | 1 (9.1%) |
| 3 or 4 Children | 0 (0.0%) | 0 (0.0%) |
| 5 or more Children | 0 (0.0%) | 0 (0.0%) |
| Total | 0 (0.0%) | 1 (4.5%) |
Employment Characteristics in Elkhart
Employment by Class of Employer in Elkhart
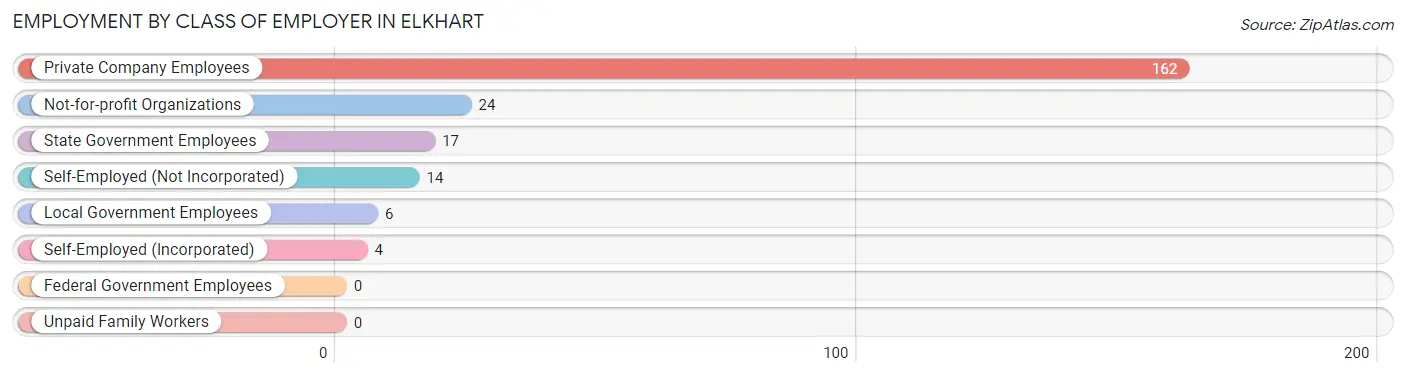
Among the 227 employed individuals in Elkhart, private company employees (162 | 71.4%), not-for-profit organizations (24 | 10.6%), and state government employees (17 | 7.5%) make up the most common classes of employment.
| Employer Class | # Employees | % Employees |
| Private Company Employees | 162 | 71.4% |
| Self-Employed (Incorporated) | 4 | 1.8% |
| Self-Employed (Not Incorporated) | 14 | 6.2% |
| Not-for-profit Organizations | 24 | 10.6% |
| Local Government Employees | 6 | 2.6% |
| State Government Employees | 17 | 7.5% |
| Federal Government Employees | 0 | 0.0% |
| Unpaid Family Workers | 0 | 0.0% |
| Total | 227 | 100.0% |
Employment Status by Age in Elkhart
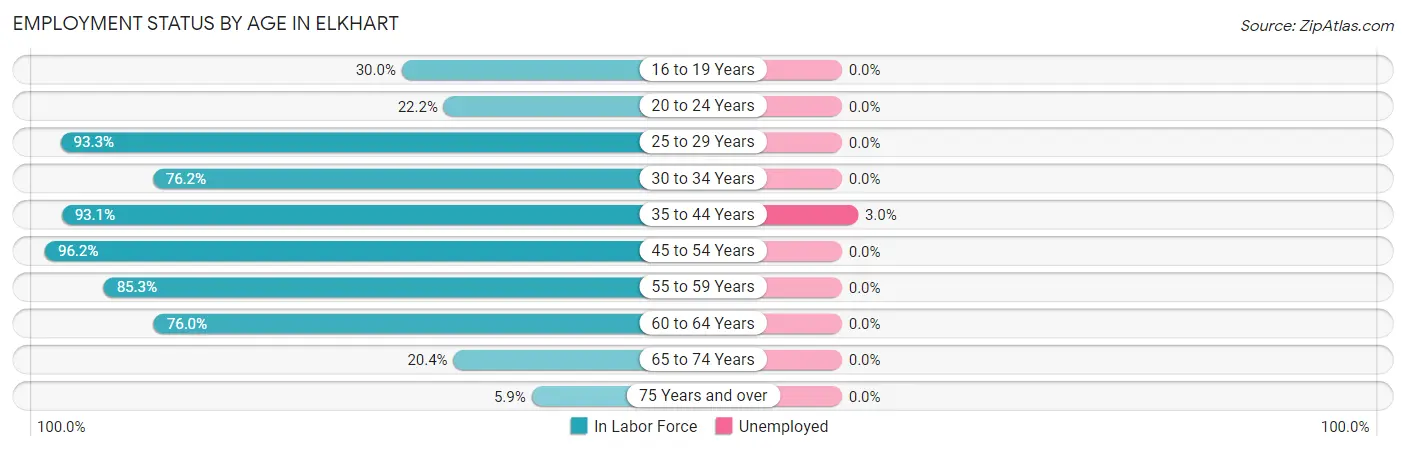
According to the labor force statistics for Elkhart, out of the total population over 16 years of age (352), 67.6% or 238 individuals are in the labor force, with 0.8% or 2 of them unemployed. The age group with the highest labor force participation rate is 45 to 54 years, with 96.2% or 75 individuals in the labor force. Within the labor force, the 35 to 44 years age range has the highest percentage of unemployed individuals, with 3.0% or 2 of them being unemployed.
| Age Bracket | In Labor Force | Unemployed |
| 16 to 19 Years | 3 (30.0%) | 0 (0.0%) |
| 20 to 24 Years | 2 (22.2%) | 0 (0.0%) |
| 25 to 29 Years | 14 (93.3%) | 0 (0.0%) |
| 30 to 34 Years | 16 (76.2%) | 0 (0.0%) |
| 35 to 44 Years | 67 (93.1%) | 2 (3.0%) |
| 45 to 54 Years | 75 (96.2%) | 0 (0.0%) |
| 55 to 59 Years | 29 (85.3%) | 0 (0.0%) |
| 60 to 64 Years | 19 (76.0%) | 0 (0.0%) |
| 65 to 74 Years | 11 (20.4%) | 0 (0.0%) |
| 75 Years and over | 2 (5.9%) | 0 (0.0%) |
| Total | 238 (67.6%) | 2 (0.8%) |
Employment Status by Educational Attainment in Elkhart
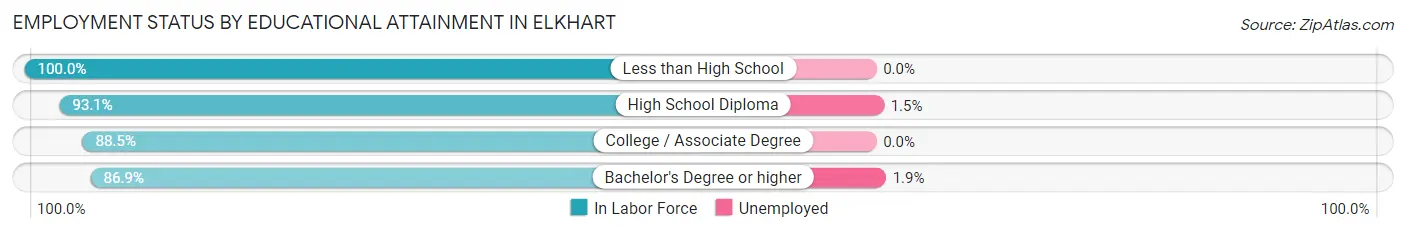
According to labor force statistics for Elkhart, 89.8% of individuals (220) out of the total population between 25 and 64 years of age (245) are in the labor force, with 0.9% or 2 of them being unemployed. The group with the highest labor force participation rate are those with the educational attainment of less than high school, with 100.0% or 8 individuals in the labor force. Within the labor force, individuals with bachelor's degree or higher education have the highest percentage of unemployment, with 1.9% or 1 of them being unemployed.
| Educational Attainment | In Labor Force | Unemployed |
| Less than High School | 8 (100.0%) | 0 (0.0%) |
| High School Diploma | 67 (93.1%) | 1 (1.5%) |
| College / Associate Degree | 92 (88.5%) | 0 (0.0%) |
| Bachelor's Degree or higher | 53 (86.9%) | 1 (1.9%) |
| Total | 220 (89.8%) | 2 (0.9%) |
Employment Occupations by Sex in Elkhart
Management, Business, Science and Arts Occupations
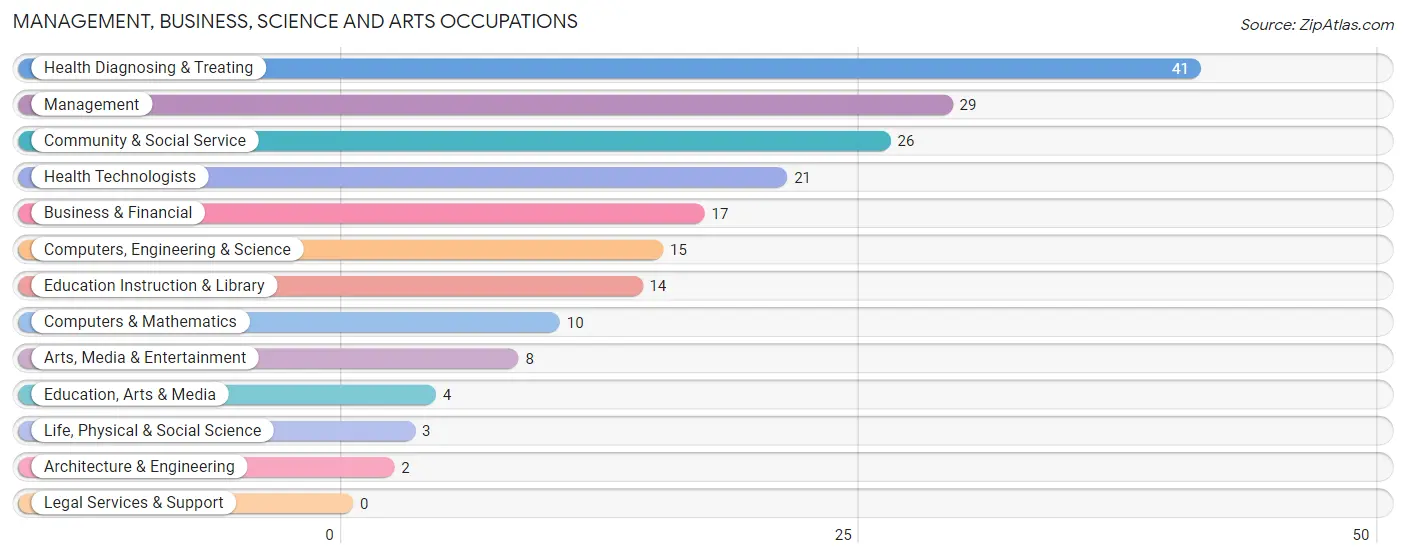
The most common Management, Business, Science and Arts occupations in Elkhart are Health Diagnosing & Treating (41 | 17.4%), Management (29 | 12.3%), Community & Social Service (26 | 11.0%), Health Technologists (21 | 8.9%), and Business & Financial (17 | 7.2%).
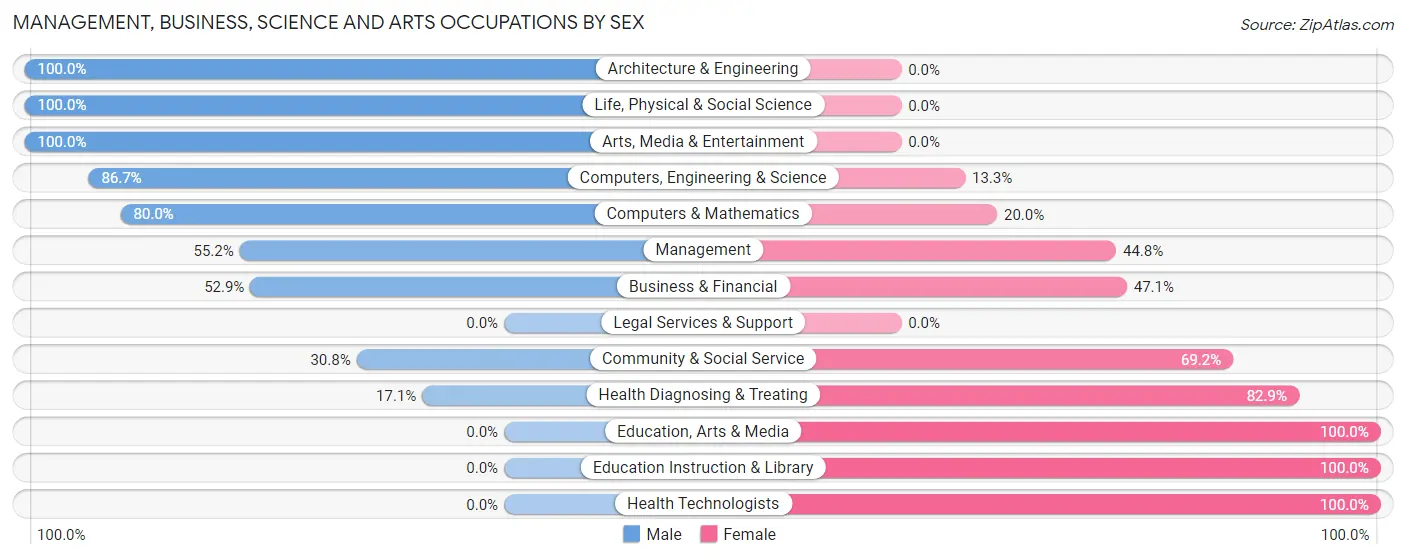
Management, Business, Science and Arts Occupations by Sex
Within the Management, Business, Science and Arts occupations in Elkhart, the most male-oriented occupations are Architecture & Engineering (100.0%), Life, Physical & Social Science (100.0%), and Arts, Media & Entertainment (100.0%), while the most female-oriented occupations are Education, Arts & Media (100.0%), Education Instruction & Library (100.0%), and Health Technologists (100.0%).
| Occupation | Male | Female |
| Management | 16 (55.2%) | 13 (44.8%) |
| Business & Financial | 9 (52.9%) | 8 (47.1%) |
| Computers, Engineering & Science | 13 (86.7%) | 2 (13.3%) |
| Computers & Mathematics | 8 (80.0%) | 2 (20.0%) |
| Architecture & Engineering | 2 (100.0%) | 0 (0.0%) |
| Life, Physical & Social Science | 3 (100.0%) | 0 (0.0%) |
| Community & Social Service | 8 (30.8%) | 18 (69.2%) |
| Education, Arts & Media | 0 (0.0%) | 4 (100.0%) |
| Legal Services & Support | 0 (0.0%) | 0 (0.0%) |
| Education Instruction & Library | 0 (0.0%) | 14 (100.0%) |
| Arts, Media & Entertainment | 8 (100.0%) | 0 (0.0%) |
| Health Diagnosing & Treating | 7 (17.1%) | 34 (82.9%) |
| Health Technologists | 0 (0.0%) | 21 (100.0%) |
| Total (Category) | 53 (41.4%) | 75 (58.6%) |
| Total (Overall) | 118 (50.0%) | 118 (50.0%) |
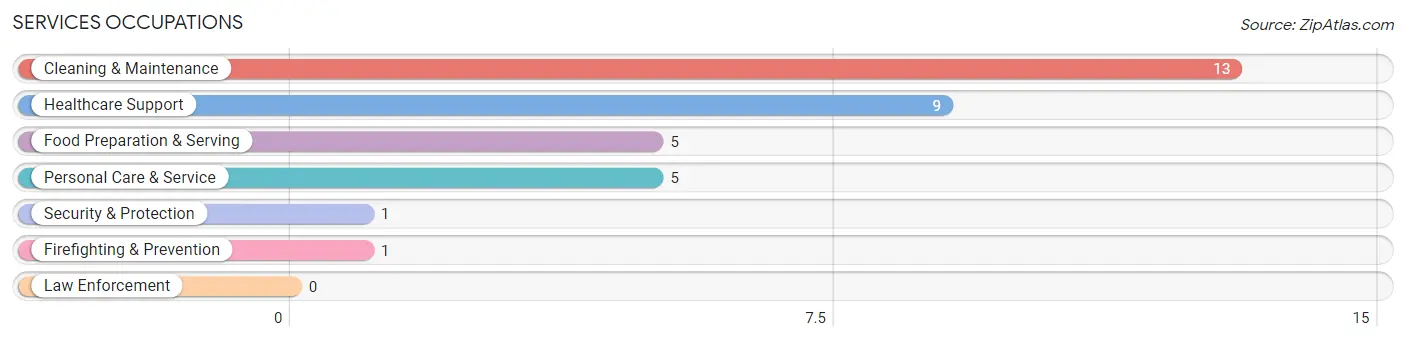
Services Occupations
The most common Services occupations in Elkhart are Cleaning & Maintenance (13 | 5.5%), Healthcare Support (9 | 3.8%), Food Preparation & Serving (5 | 2.1%), Personal Care & Service (5 | 2.1%), and Security & Protection (1 | 0.4%).
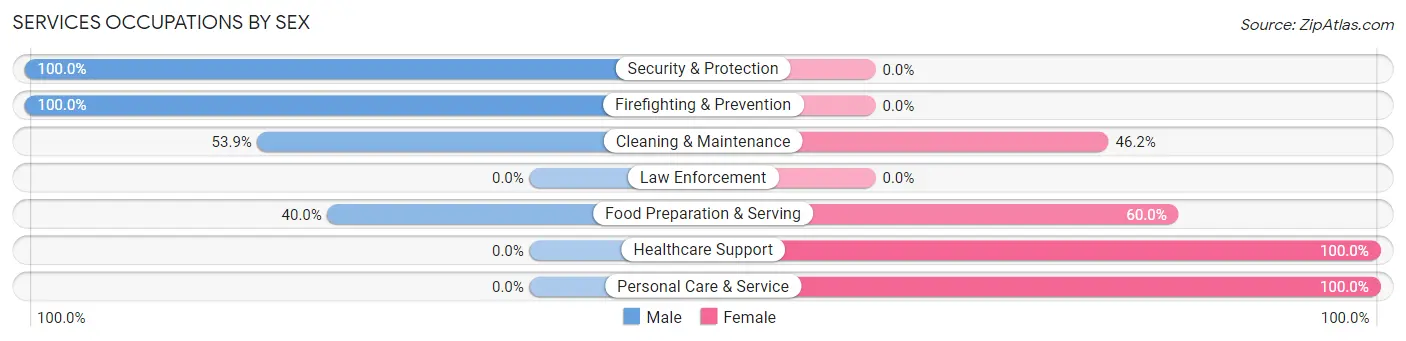
Services Occupations by Sex
Within the Services occupations in Elkhart, the most male-oriented occupations are Security & Protection (100.0%), Firefighting & Prevention (100.0%), and Cleaning & Maintenance (53.8%), while the most female-oriented occupations are Healthcare Support (100.0%), Personal Care & Service (100.0%), and Food Preparation & Serving (60.0%).
| Occupation | Male | Female |
| Healthcare Support | 0 (0.0%) | 9 (100.0%) |
| Security & Protection | 1 (100.0%) | 0 (0.0%) |
| Firefighting & Prevention | 1 (100.0%) | 0 (0.0%) |
| Law Enforcement | 0 (0.0%) | 0 (0.0%) |
| Food Preparation & Serving | 2 (40.0%) | 3 (60.0%) |
| Cleaning & Maintenance | 7 (53.8%) | 6 (46.2%) |
| Personal Care & Service | 0 (0.0%) | 5 (100.0%) |
| Total (Category) | 10 (30.3%) | 23 (69.7%) |
| Total (Overall) | 118 (50.0%) | 118 (50.0%) |
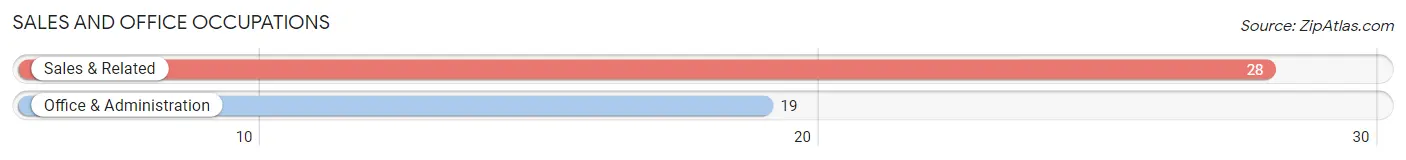
Sales and Office Occupations
The most common Sales and Office occupations in Elkhart are Sales & Related (28 | 11.9%), and Office & Administration (19 | 8.1%).
Sales and Office Occupations by Sex
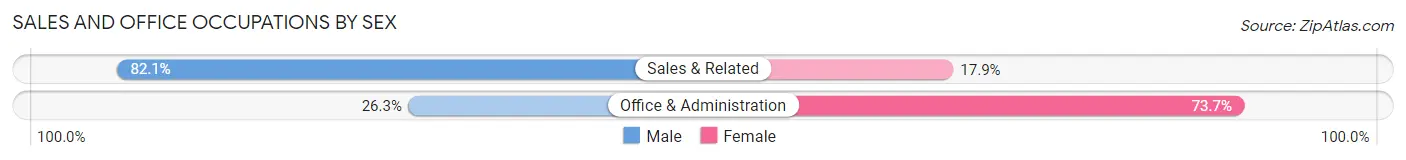
| Occupation | Male | Female |
| Sales & Related | 23 (82.1%) | 5 (17.9%) |
| Office & Administration | 5 (26.3%) | 14 (73.7%) |
| Total (Category) | 28 (59.6%) | 19 (40.4%) |
| Total (Overall) | 118 (50.0%) | 118 (50.0%) |
Natural Resources, Construction and Maintenance Occupations
The most common Natural Resources, Construction and Maintenance occupations in Elkhart are Construction & Extraction (8 | 3.4%), and Installation, Maintenance & Repair (2 | 0.9%).
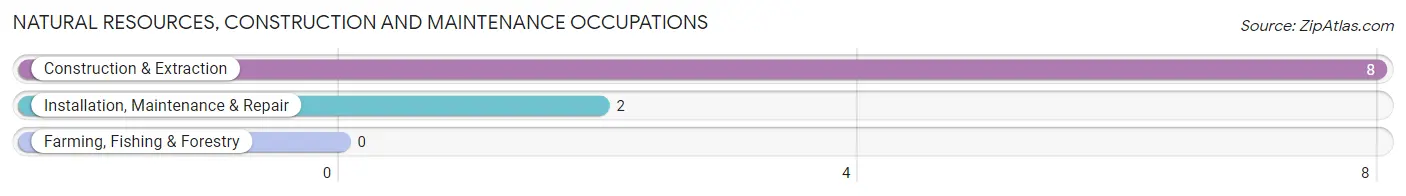
Natural Resources, Construction and Maintenance Occupations by Sex

| Occupation | Male | Female |
| Farming, Fishing & Forestry | 0 (0.0%) | 0 (0.0%) |
| Construction & Extraction | 8 (100.0%) | 0 (0.0%) |
| Installation, Maintenance & Repair | 2 (100.0%) | 0 (0.0%) |
| Total (Category) | 10 (100.0%) | 0 (0.0%) |
| Total (Overall) | 118 (50.0%) | 118 (50.0%) |
Production, Transportation and Moving Occupations
The most common Production, Transportation and Moving occupations in Elkhart are Transportation (8 | 3.4%), Production (6 | 2.5%), and Material Moving (4 | 1.7%).
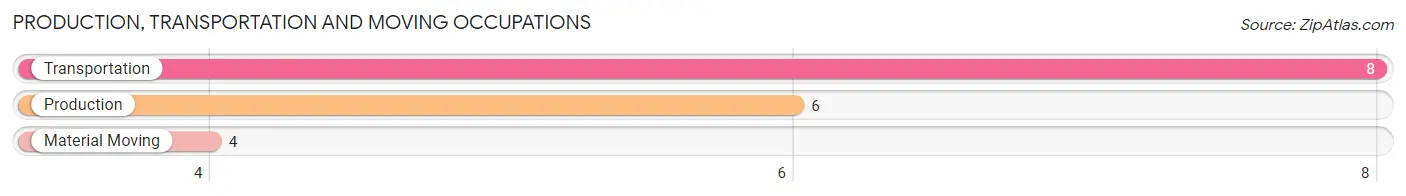
Production, Transportation and Moving Occupations by Sex
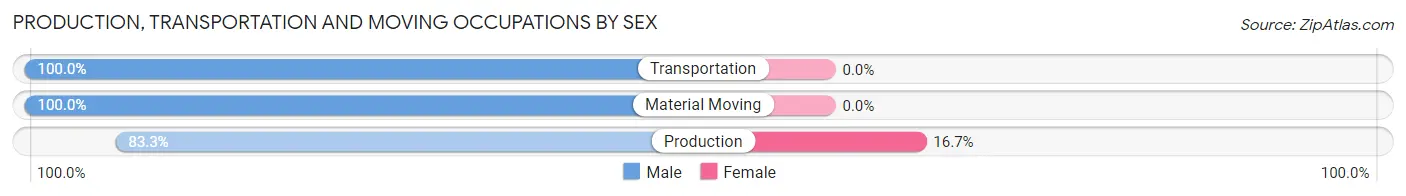
| Occupation | Male | Female |
| Production | 5 (83.3%) | 1 (16.7%) |
| Transportation | 8 (100.0%) | 0 (0.0%) |
| Material Moving | 4 (100.0%) | 0 (0.0%) |
| Total (Category) | 17 (94.4%) | 1 (5.6%) |
| Total (Overall) | 118 (50.0%) | 118 (50.0%) |
Employment Industries by Sex in Elkhart
Employment Industries in Elkhart
The major employment industries in Elkhart include Health Care & Social Assistance (69 | 29.2%), Retail Trade (32 | 13.6%), Finance & Insurance (20 | 8.5%), Construction (18 | 7.6%), and Educational Services (17 | 7.2%).

Employment Industries by Sex in Elkhart
The Elkhart industries that see more men than women are Transportation & Warehousing (100.0%), Utilities (100.0%), and Public Administration (100.0%), whereas the industries that tend to have a higher number of women are Information (100.0%), Real Estate, Rental & Leasing (100.0%), and Educational Services (100.0%).
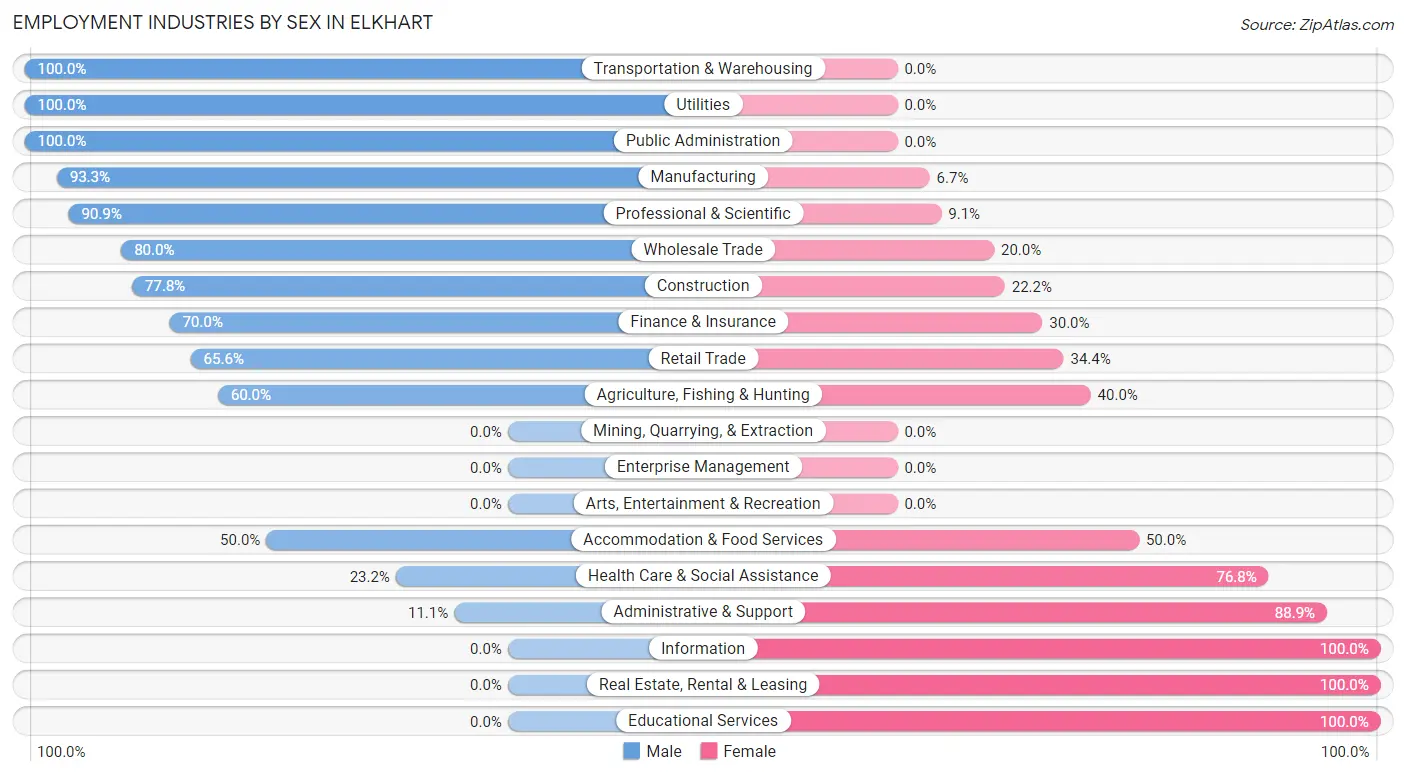
| Industry | Male | Female |
| Agriculture, Fishing & Hunting | 3 (60.0%) | 2 (40.0%) |
| Mining, Quarrying, & Extraction | 0 (0.0%) | 0 (0.0%) |
| Construction | 14 (77.8%) | 4 (22.2%) |
| Manufacturing | 14 (93.3%) | 1 (6.7%) |
| Wholesale Trade | 4 (80.0%) | 1 (20.0%) |
| Retail Trade | 21 (65.6%) | 11 (34.4%) |
| Transportation & Warehousing | 6 (100.0%) | 0 (0.0%) |
| Utilities | 3 (100.0%) | 0 (0.0%) |
| Information | 0 (0.0%) | 3 (100.0%) |
| Finance & Insurance | 14 (70.0%) | 6 (30.0%) |
| Real Estate, Rental & Leasing | 0 (0.0%) | 2 (100.0%) |
| Professional & Scientific | 10 (90.9%) | 1 (9.1%) |
| Enterprise Management | 0 (0.0%) | 0 (0.0%) |
| Administrative & Support | 1 (11.1%) | 8 (88.9%) |
| Educational Services | 0 (0.0%) | 17 (100.0%) |
| Health Care & Social Assistance | 16 (23.2%) | 53 (76.8%) |
| Arts, Entertainment & Recreation | 0 (0.0%) | 0 (0.0%) |
| Accommodation & Food Services | 3 (50.0%) | 3 (50.0%) |
| Public Administration | 9 (100.0%) | 0 (0.0%) |
| Total | 118 (50.0%) | 118 (50.0%) |
Education in Elkhart
School Enrollment in Elkhart
The most common levels of schooling among the 146 students in Elkhart are middle school (45 | 30.8%), elementary school (44 | 30.1%), and high school (20 | 13.7%).
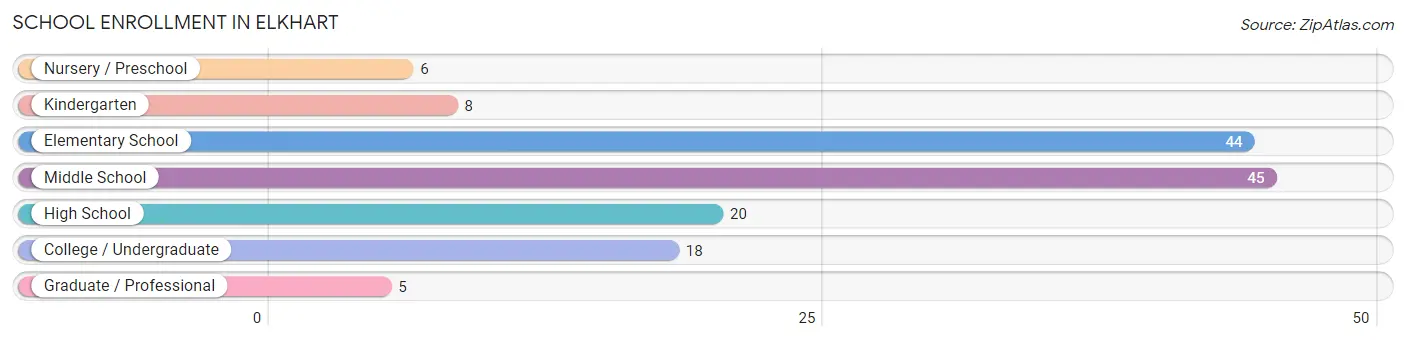
| School Level | # Students | % Students |
| Nursery / Preschool | 6 | 4.1% |
| Kindergarten | 8 | 5.5% |
| Elementary School | 44 | 30.1% |
| Middle School | 45 | 30.8% |
| High School | 20 | 13.7% |
| College / Undergraduate | 18 | 12.3% |
| Graduate / Professional | 5 | 3.4% |
| Total | 146 | 100.0% |
School Enrollment by Age by Funding Source in Elkhart
Out of a total of 146 students who are enrolled in schools in Elkhart, 18 (12.3%) attend a private institution, while the remaining 128 (87.7%) are enrolled in public schools. The age group of 3 to 4 year olds has the highest likelihood of being enrolled in private schools, with 2 (50.0% in the age bracket) enrolled. Conversely, the age group of 15 to 17 year olds has the lowest likelihood of being enrolled in a private school, with 13 (100.0% in the age bracket) attending a public institution.
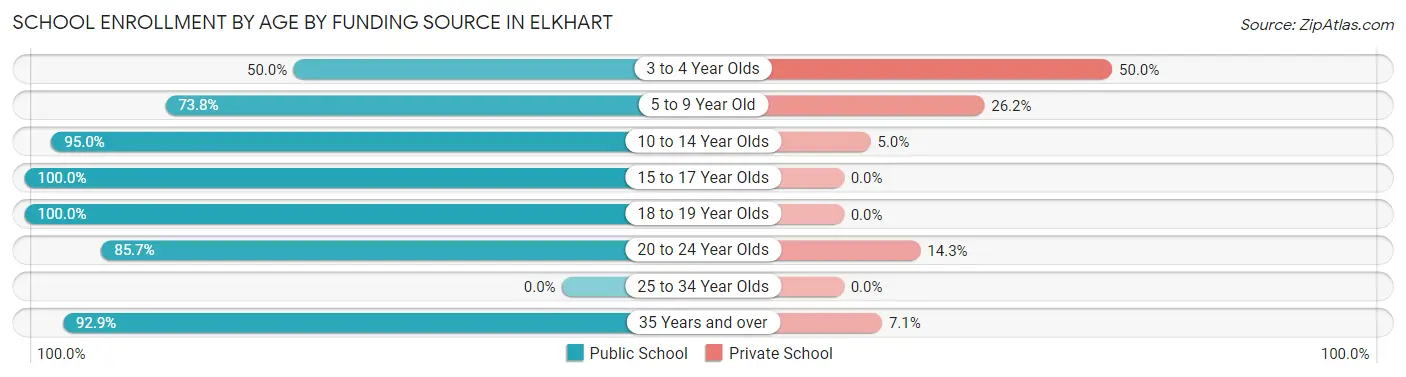
| Age Bracket | Public School | Private School |
| 3 to 4 Year Olds | 2 (50.0%) | 2 (50.0%) |
| 5 to 9 Year Old | 31 (73.8%) | 11 (26.2%) |
| 10 to 14 Year Olds | 57 (95.0%) | 3 (5.0%) |
| 15 to 17 Year Olds | 13 (100.0%) | 0 (0.0%) |
| 18 to 19 Year Olds | 6 (100.0%) | 0 (0.0%) |
| 20 to 24 Year Olds | 6 (85.7%) | 1 (14.3%) |
| 25 to 34 Year Olds | 0 (0.0%) | 0 (0.0%) |
| 35 Years and over | 13 (92.9%) | 1 (7.1%) |
| Total | 128 (87.7%) | 18 (12.3%) |
Educational Attainment by Field of Study in Elkhart
Education (27 | 26.5%), visual & performing arts (21 | 20.6%), business (9 | 8.8%), science & technology (7 | 6.9%), and engineering (6 | 5.9%) are the most common fields of study among 102 individuals in Elkhart who have obtained a bachelor's degree or higher.
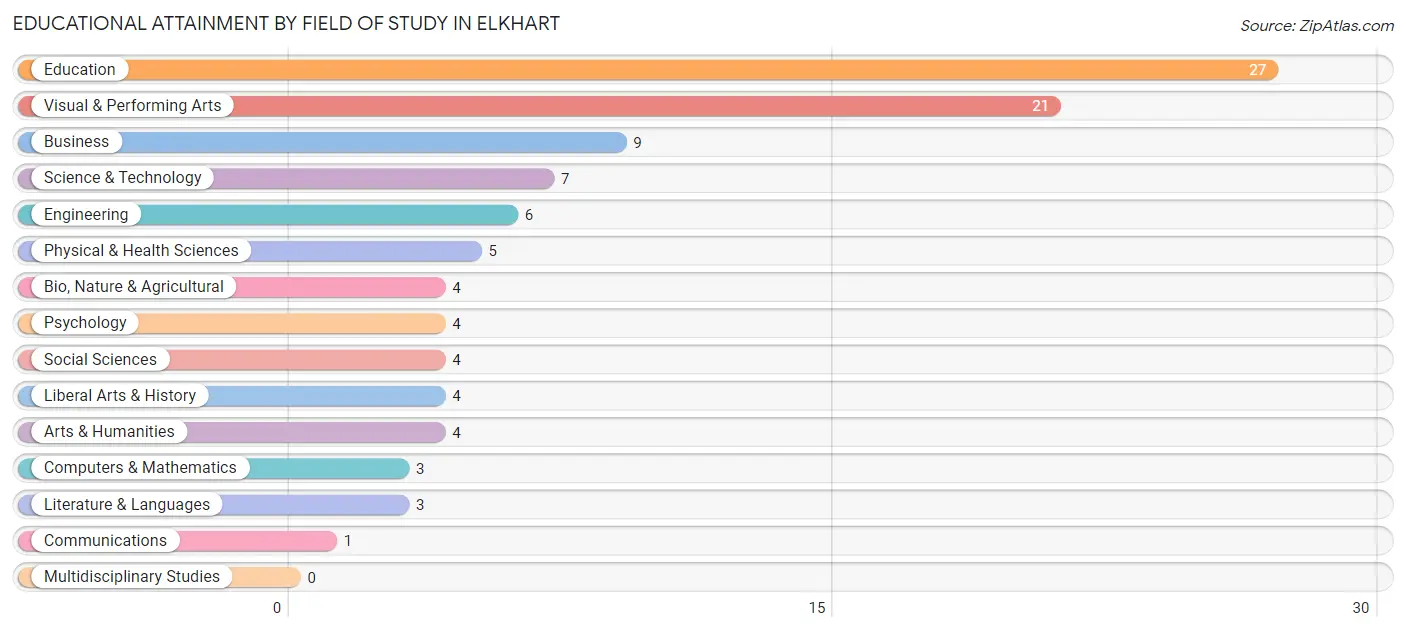
| Field of Study | # Graduates | % Graduates |
| Computers & Mathematics | 3 | 2.9% |
| Bio, Nature & Agricultural | 4 | 3.9% |
| Physical & Health Sciences | 5 | 4.9% |
| Psychology | 4 | 3.9% |
| Social Sciences | 4 | 3.9% |
| Engineering | 6 | 5.9% |
| Multidisciplinary Studies | 0 | 0.0% |
| Science & Technology | 7 | 6.9% |
| Business | 9 | 8.8% |
| Education | 27 | 26.5% |
| Literature & Languages | 3 | 2.9% |
| Liberal Arts & History | 4 | 3.9% |
| Visual & Performing Arts | 21 | 20.6% |
| Communications | 1 | 1.0% |
| Arts & Humanities | 4 | 3.9% |
| Total | 102 | 100.0% |
Transportation & Commute in Elkhart
Vehicle Availability by Sex in Elkhart
The most prevalent vehicle ownership categories in Elkhart are males with 2 vehicles (45, accounting for 39.8%) and females with 2 vehicles (37, making up 39.5%).
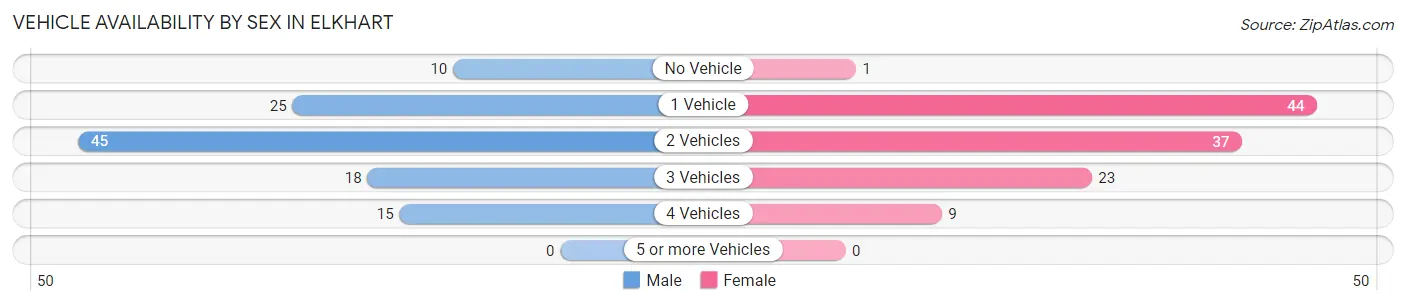
| Vehicles Available | Male | Female |
| No Vehicle | 10 (8.8%) | 1 (0.9%) |
| 1 Vehicle | 25 (22.1%) | 44 (38.6%) |
| 2 Vehicles | 45 (39.8%) | 37 (32.5%) |
| 3 Vehicles | 18 (15.9%) | 23 (20.2%) |
| 4 Vehicles | 15 (13.3%) | 9 (7.9%) |
| 5 or more Vehicles | 0 (0.0%) | 0 (0.0%) |
| Total | 113 (100.0%) | 114 (100.0%) |
Commute Time in Elkhart
The most frequently occuring commute durations in Elkhart are 30 to 34 minutes (38 commuters, 18.4%), 15 to 19 minutes (37 commuters, 17.9%), and 25 to 29 minutes (27 commuters, 13.0%).
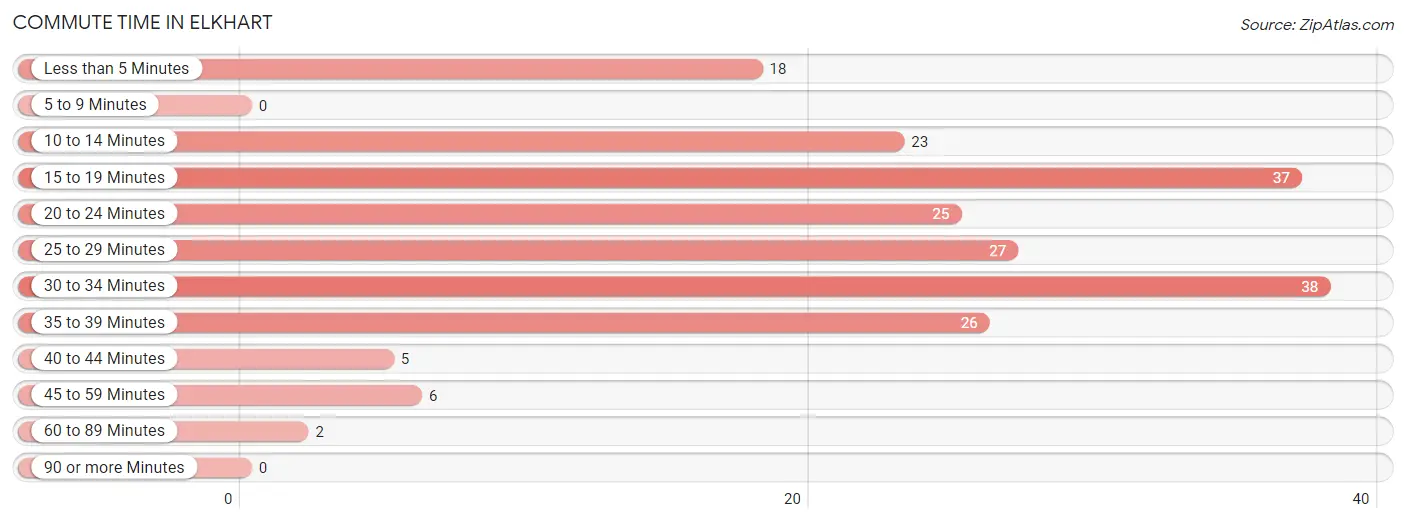
| Commute Time | # Commuters | % Commuters |
| Less than 5 Minutes | 18 | 8.7% |
| 5 to 9 Minutes | 0 | 0.0% |
| 10 to 14 Minutes | 23 | 11.1% |
| 15 to 19 Minutes | 37 | 17.9% |
| 20 to 24 Minutes | 25 | 12.1% |
| 25 to 29 Minutes | 27 | 13.0% |
| 30 to 34 Minutes | 38 | 18.4% |
| 35 to 39 Minutes | 26 | 12.6% |
| 40 to 44 Minutes | 5 | 2.4% |
| 45 to 59 Minutes | 6 | 2.9% |
| 60 to 89 Minutes | 2 | 1.0% |
| 90 or more Minutes | 0 | 0.0% |
Commute Time by Sex in Elkhart
The most common commute times in Elkhart are 15 to 19 minutes (18 commuters, 18.6%) for males and 10 to 14 minutes (22 commuters, 20.0%) for females.
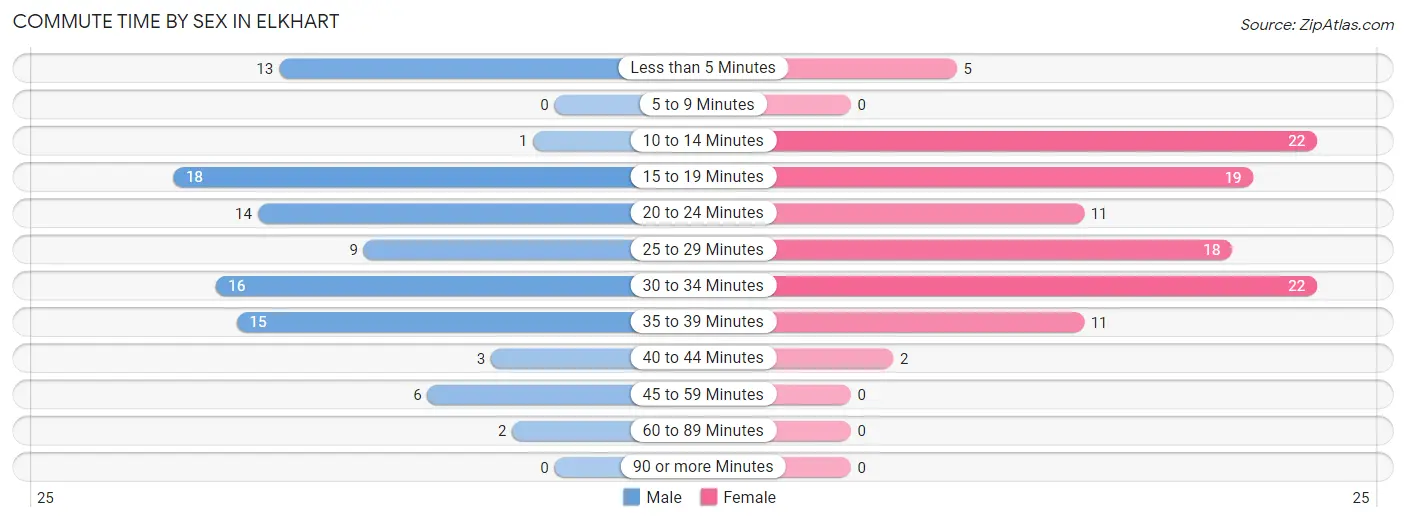
| Commute Time | Male | Female |
| Less than 5 Minutes | 13 (13.4%) | 5 (4.5%) |
| 5 to 9 Minutes | 0 (0.0%) | 0 (0.0%) |
| 10 to 14 Minutes | 1 (1.0%) | 22 (20.0%) |
| 15 to 19 Minutes | 18 (18.6%) | 19 (17.3%) |
| 20 to 24 Minutes | 14 (14.4%) | 11 (10.0%) |
| 25 to 29 Minutes | 9 (9.3%) | 18 (16.4%) |
| 30 to 34 Minutes | 16 (16.5%) | 22 (20.0%) |
| 35 to 39 Minutes | 15 (15.5%) | 11 (10.0%) |
| 40 to 44 Minutes | 3 (3.1%) | 2 (1.8%) |
| 45 to 59 Minutes | 6 (6.2%) | 0 (0.0%) |
| 60 to 89 Minutes | 2 (2.1%) | 0 (0.0%) |
| 90 or more Minutes | 0 (0.0%) | 0 (0.0%) |
Time of Departure to Work by Sex in Elkhart
The most frequent times of departure to work in Elkhart are 6:00 AM to 6:29 AM (24, 24.7%) for males and 7:30 AM to 7:59 AM (46, 41.8%) for females.
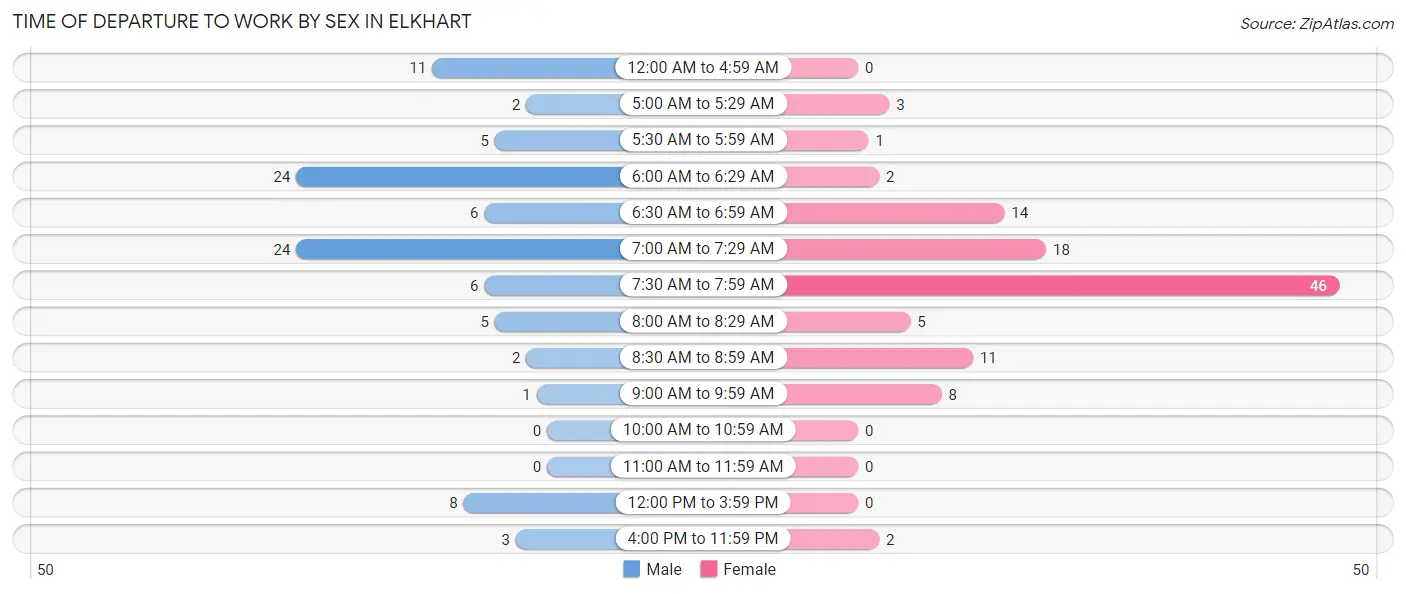
| Time of Departure | Male | Female |
| 12:00 AM to 4:59 AM | 11 (11.3%) | 0 (0.0%) |
| 5:00 AM to 5:29 AM | 2 (2.1%) | 3 (2.7%) |
| 5:30 AM to 5:59 AM | 5 (5.1%) | 1 (0.9%) |
| 6:00 AM to 6:29 AM | 24 (24.7%) | 2 (1.8%) |
| 6:30 AM to 6:59 AM | 6 (6.2%) | 14 (12.7%) |
| 7:00 AM to 7:29 AM | 24 (24.7%) | 18 (16.4%) |
| 7:30 AM to 7:59 AM | 6 (6.2%) | 46 (41.8%) |
| 8:00 AM to 8:29 AM | 5 (5.1%) | 5 (4.5%) |
| 8:30 AM to 8:59 AM | 2 (2.1%) | 11 (10.0%) |
| 9:00 AM to 9:59 AM | 1 (1.0%) | 8 (7.3%) |
| 10:00 AM to 10:59 AM | 0 (0.0%) | 0 (0.0%) |
| 11:00 AM to 11:59 AM | 0 (0.0%) | 0 (0.0%) |
| 12:00 PM to 3:59 PM | 8 (8.3%) | 0 (0.0%) |
| 4:00 PM to 11:59 PM | 3 (3.1%) | 2 (1.8%) |
| Total | 97 (100.0%) | 110 (100.0%) |
Housing Occupancy in Elkhart
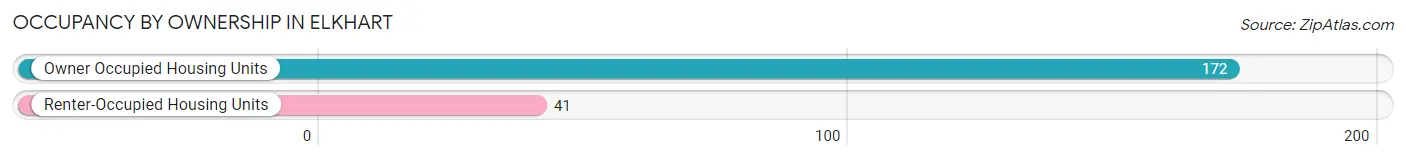
Occupancy by Ownership in Elkhart
Of the total 213 dwellings in Elkhart, owner-occupied units account for 172 (80.7%), while renter-occupied units make up 41 (19.3%).
| Occupancy | # Housing Units | % Housing Units |
| Owner Occupied Housing Units | 172 | 80.7% |
| Renter-Occupied Housing Units | 41 | 19.3% |
| Total Occupied Housing Units | 213 | 100.0% |
Occupancy by Household Size in Elkhart

| Household Size | # Housing Units | % Housing Units |
| 1-Person Household | 77 | 36.1% |
| 2-Person Household | 64 | 30.0% |
| 3-Person Household | 13 | 6.1% |
| 4+ Person Household | 59 | 27.7% |
| Total Housing Units | 213 | 100.0% |
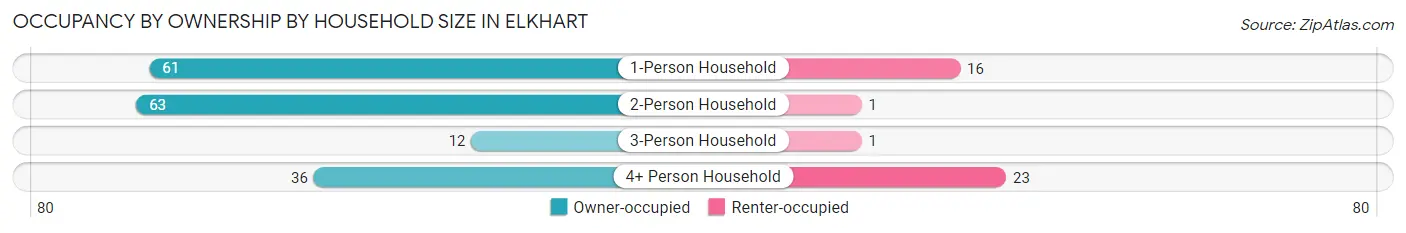
Occupancy by Ownership by Household Size in Elkhart
| Household Size | Owner-occupied | Renter-occupied |
| 1-Person Household | 61 (79.2%) | 16 (20.8%) |
| 2-Person Household | 63 (98.4%) | 1 (1.6%) |
| 3-Person Household | 12 (92.3%) | 1 (7.7%) |
| 4+ Person Household | 36 (61.0%) | 23 (39.0%) |
| Total Housing Units | 172 (80.7%) | 41 (19.3%) |
Occupancy by Educational Attainment in Elkhart

| Household Size | Owner-occupied | Renter-occupied |
| Less than High School | 7 (100.0%) | 0 (0.0%) |
| High School Diploma | 41 (75.9%) | 13 (24.1%) |
| College/Associate Degree | 56 (67.5%) | 27 (32.5%) |
| Bachelor's Degree or higher | 68 (98.6%) | 1 (1.5%) |
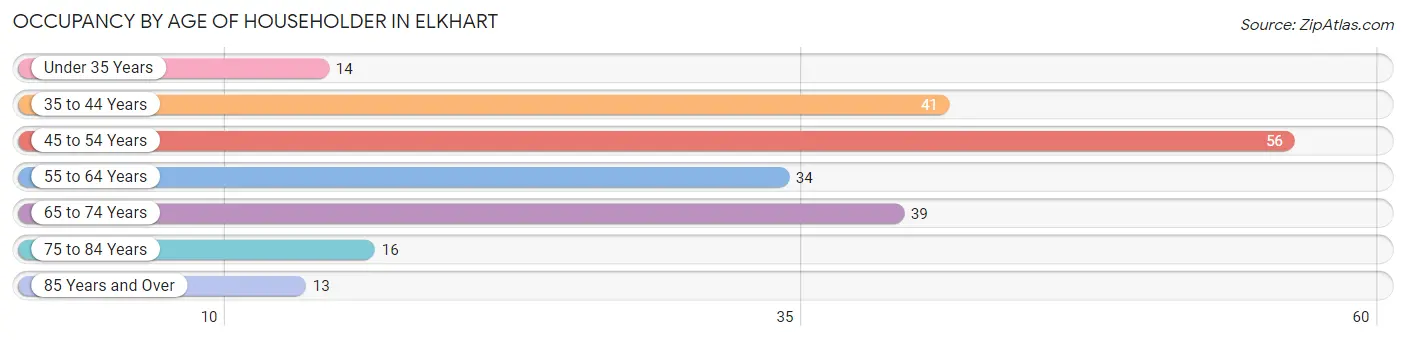
Occupancy by Age of Householder in Elkhart
| Age Bracket | # Households | % Households |
| Under 35 Years | 14 | 6.6% |
| 35 to 44 Years | 41 | 19.3% |
| 45 to 54 Years | 56 | 26.3% |
| 55 to 64 Years | 34 | 16.0% |
| 65 to 74 Years | 39 | 18.3% |
| 75 to 84 Years | 16 | 7.5% |
| 85 Years and Over | 13 | 6.1% |
| Total | 213 | 100.0% |
Housing Finances in Elkhart
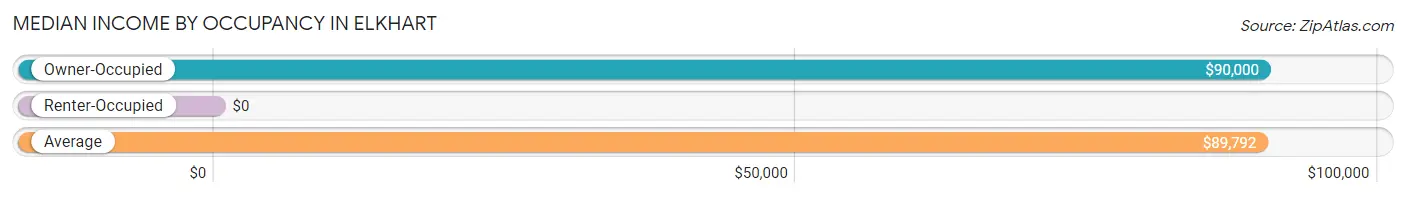
Median Income by Occupancy in Elkhart
| Occupancy Type | # Households | Median Income |
| Owner-Occupied | 172 (80.7%) | $90,000 |
| Renter-Occupied | 41 (19.3%) | $0 |
| Average | 213 (100.0%) | $89,792 |
Occupancy by Householder Income Bracket in Elkhart
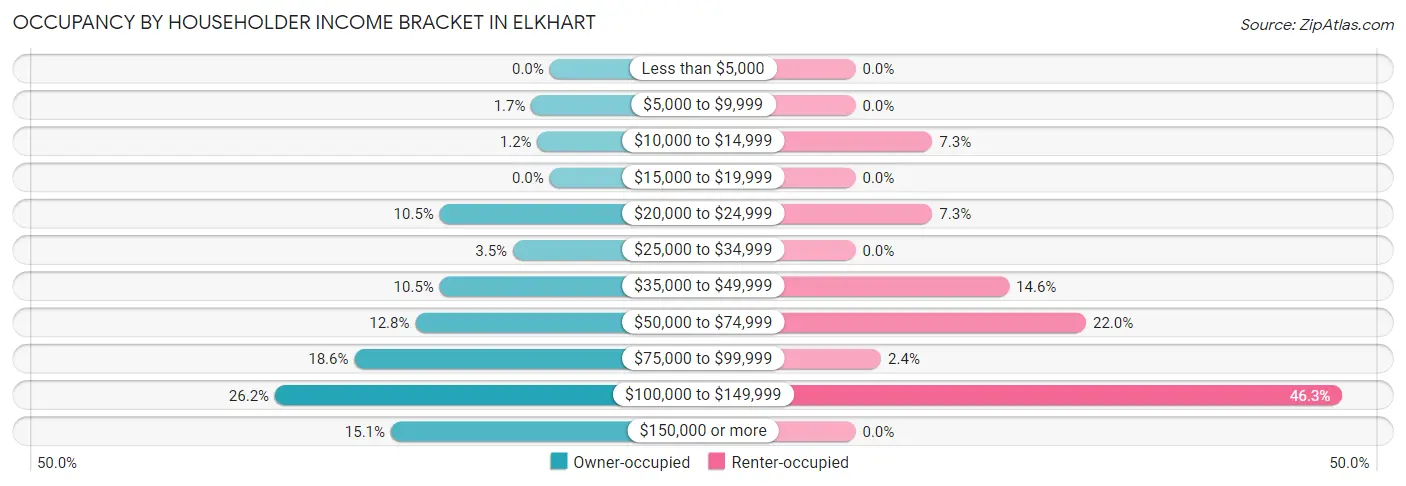
| Income Bracket | Owner-occupied | Renter-occupied |
| Less than $5,000 | 0 (0.0%) | 0 (0.0%) |
| $5,000 to $9,999 | 3 (1.7%) | 0 (0.0%) |
| $10,000 to $14,999 | 2 (1.2%) | 3 (7.3%) |
| $15,000 to $19,999 | 0 (0.0%) | 0 (0.0%) |
| $20,000 to $24,999 | 18 (10.5%) | 3 (7.3%) |
| $25,000 to $34,999 | 6 (3.5%) | 0 (0.0%) |
| $35,000 to $49,999 | 18 (10.5%) | 6 (14.6%) |
| $50,000 to $74,999 | 22 (12.8%) | 9 (22.0%) |
| $75,000 to $99,999 | 32 (18.6%) | 1 (2.4%) |
| $100,000 to $149,999 | 45 (26.2%) | 19 (46.3%) |
| $150,000 or more | 26 (15.1%) | 0 (0.0%) |
| Total | 172 (100.0%) | 41 (100.0%) |
Monthly Housing Cost Tiers in Elkhart
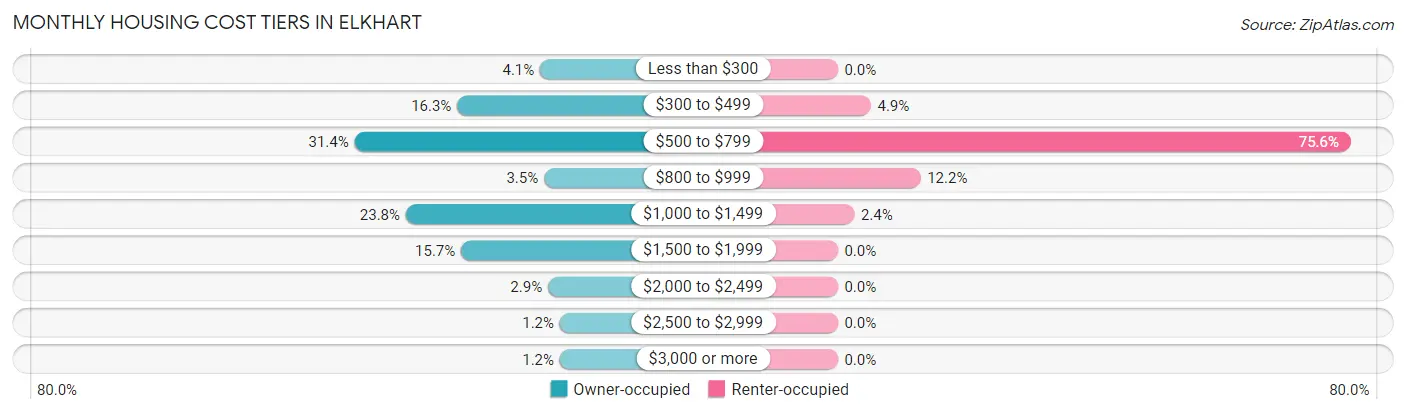
| Monthly Cost | Owner-occupied | Renter-occupied |
| Less than $300 | 7 (4.1%) | 0 (0.0%) |
| $300 to $499 | 28 (16.3%) | 2 (4.9%) |
| $500 to $799 | 54 (31.4%) | 31 (75.6%) |
| $800 to $999 | 6 (3.5%) | 5 (12.2%) |
| $1,000 to $1,499 | 41 (23.8%) | 1 (2.4%) |
| $1,500 to $1,999 | 27 (15.7%) | 0 (0.0%) |
| $2,000 to $2,499 | 5 (2.9%) | 0 (0.0%) |
| $2,500 to $2,999 | 2 (1.2%) | 0 (0.0%) |
| $3,000 or more | 2 (1.2%) | 0 (0.0%) |
| Total | 172 (100.0%) | 41 (100.0%) |
Physical Housing Characteristics in Elkhart
Housing Structures in Elkhart
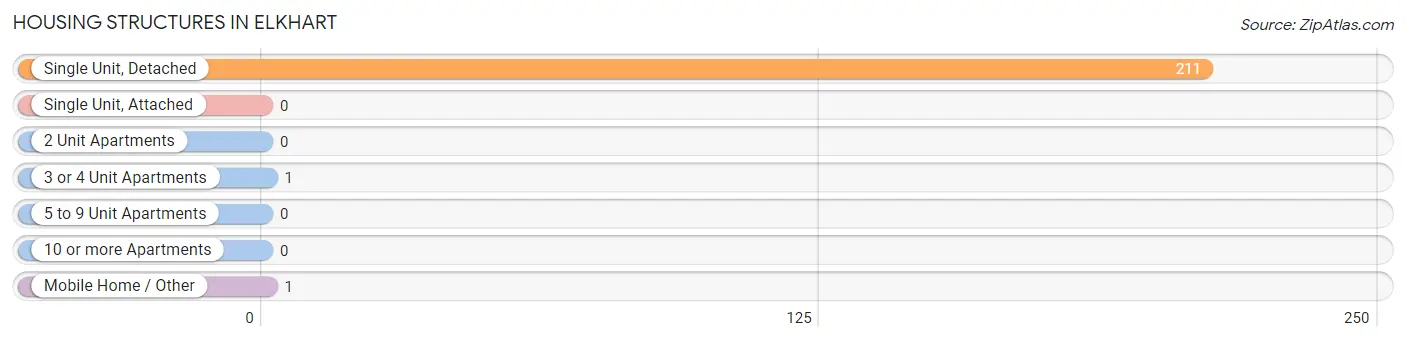
| Structure Type | # Housing Units | % Housing Units |
| Single Unit, Detached | 211 | 99.1% |
| Single Unit, Attached | 0 | 0.0% |
| 2 Unit Apartments | 0 | 0.0% |
| 3 or 4 Unit Apartments | 1 | 0.5% |
| 5 to 9 Unit Apartments | 0 | 0.0% |
| 10 or more Apartments | 0 | 0.0% |
| Mobile Home / Other | 1 | 0.5% |
| Total | 213 | 100.0% |
Housing Structures by Occupancy in Elkhart
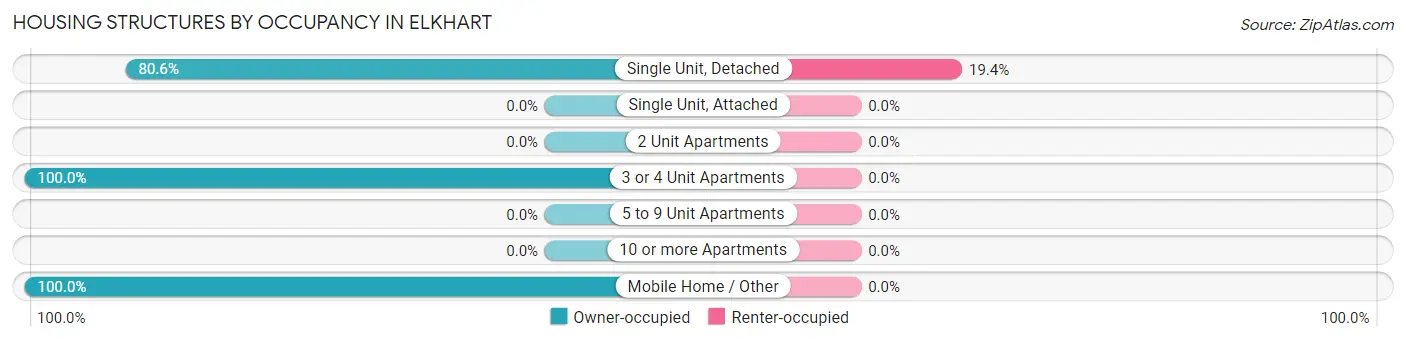
| Structure Type | Owner-occupied | Renter-occupied |
| Single Unit, Detached | 170 (80.6%) | 41 (19.4%) |
| Single Unit, Attached | 0 (0.0%) | 0 (0.0%) |
| 2 Unit Apartments | 0 (0.0%) | 0 (0.0%) |
| 3 or 4 Unit Apartments | 1 (100.0%) | 0 (0.0%) |
| 5 to 9 Unit Apartments | 0 (0.0%) | 0 (0.0%) |
| 10 or more Apartments | 0 (0.0%) | 0 (0.0%) |
| Mobile Home / Other | 1 (100.0%) | 0 (0.0%) |
| Total | 172 (80.7%) | 41 (19.3%) |
Housing Structures by Number of Rooms in Elkhart
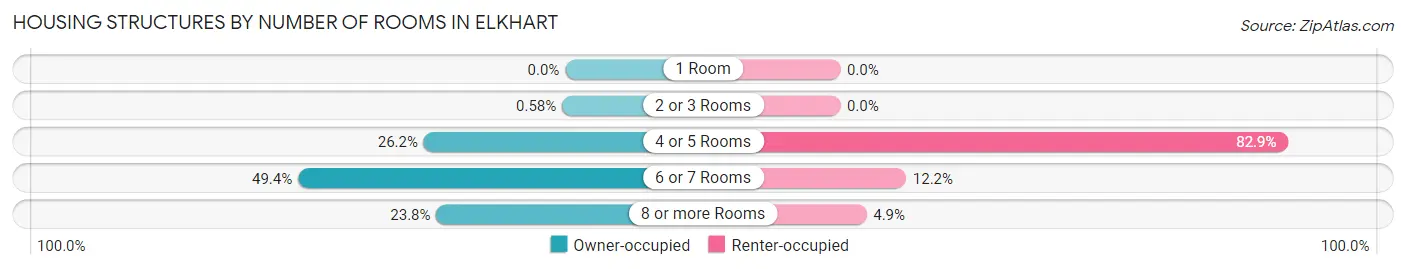
| Number of Rooms | Owner-occupied | Renter-occupied |
| 1 Room | 0 (0.0%) | 0 (0.0%) |
| 2 or 3 Rooms | 1 (0.6%) | 0 (0.0%) |
| 4 or 5 Rooms | 45 (26.2%) | 34 (82.9%) |
| 6 or 7 Rooms | 85 (49.4%) | 5 (12.2%) |
| 8 or more Rooms | 41 (23.8%) | 2 (4.9%) |
| Total | 172 (100.0%) | 41 (100.0%) |
Housing Structure by Heating Type in Elkhart
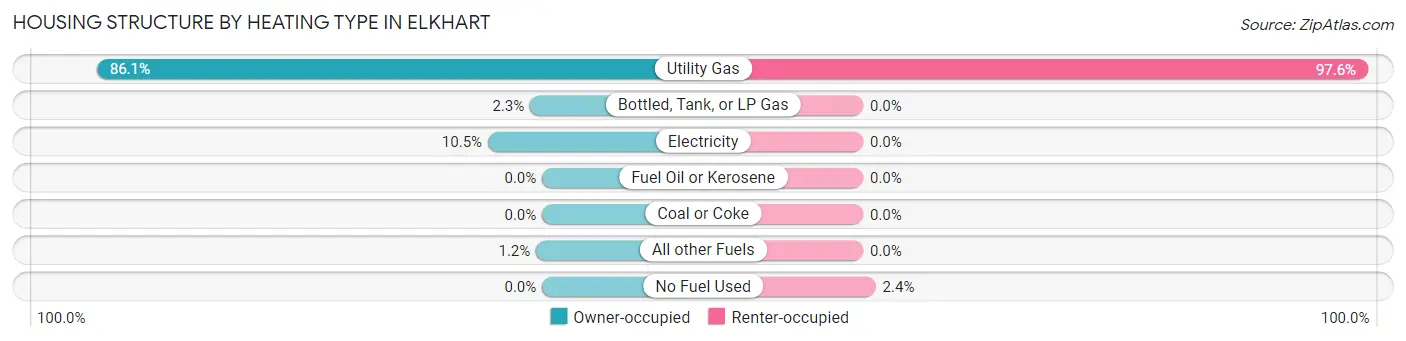
| Heating Type | Owner-occupied | Renter-occupied |
| Utility Gas | 148 (86.1%) | 40 (97.6%) |
| Bottled, Tank, or LP Gas | 4 (2.3%) | 0 (0.0%) |
| Electricity | 18 (10.5%) | 0 (0.0%) |
| Fuel Oil or Kerosene | 0 (0.0%) | 0 (0.0%) |
| Coal or Coke | 0 (0.0%) | 0 (0.0%) |
| All other Fuels | 2 (1.2%) | 0 (0.0%) |
| No Fuel Used | 0 (0.0%) | 1 (2.4%) |
| Total | 172 (100.0%) | 41 (100.0%) |
Household Vehicle Usage in Elkhart

| Vehicles per Household | Owner-occupied | Renter-occupied |
| No Vehicle | 12 (7.0%) | 2 (4.9%) |
| 1 Vehicle | 55 (32.0%) | 36 (87.8%) |
| 2 Vehicles | 67 (39.0%) | 2 (4.9%) |
| 3 or more Vehicles | 38 (22.1%) | 1 (2.4%) |
| Total | 172 (100.0%) | 41 (100.0%) |
Real Estate & Mortgages in Elkhart
Real Estate and Mortgage Overview in Elkhart
| Characteristic | Without Mortgage | With Mortgage |
| Housing Units | 60 | 112 |
| Median Property Value | $130,000 | $113,500 |
| Median Household Income | $61,250 | $22 |
| Monthly Housing Costs | $477 | $2 |
| Real Estate Taxes | $1,583 | $10 |
Property Value by Mortgage Status in Elkhart
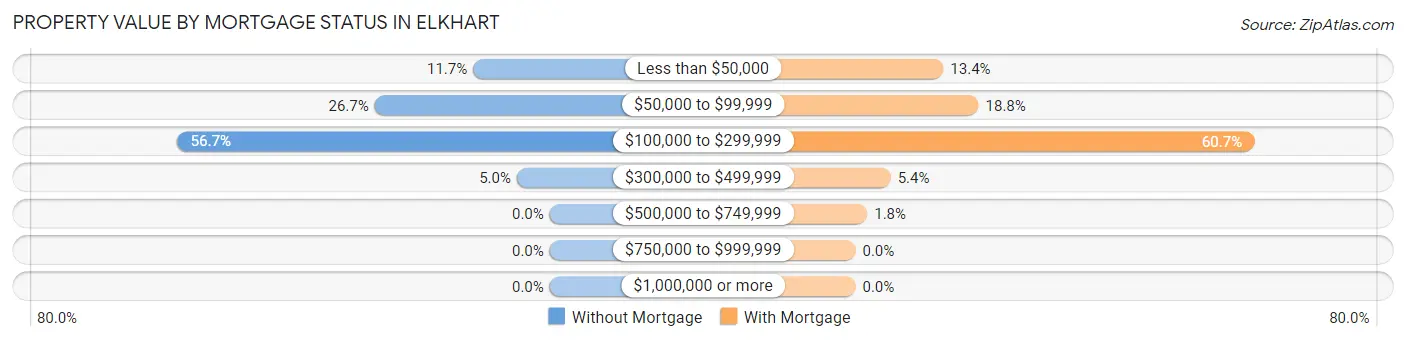
| Property Value | Without Mortgage | With Mortgage |
| Less than $50,000 | 7 (11.7%) | 15 (13.4%) |
| $50,000 to $99,999 | 16 (26.7%) | 21 (18.8%) |
| $100,000 to $299,999 | 34 (56.7%) | 68 (60.7%) |
| $300,000 to $499,999 | 3 (5.0%) | 6 (5.4%) |
| $500,000 to $749,999 | 0 (0.0%) | 2 (1.8%) |
| $750,000 to $999,999 | 0 (0.0%) | 0 (0.0%) |
| $1,000,000 or more | 0 (0.0%) | 0 (0.0%) |
| Total | 60 (100.0%) | 112 (100.0%) |
Household Income by Mortgage Status in Elkhart
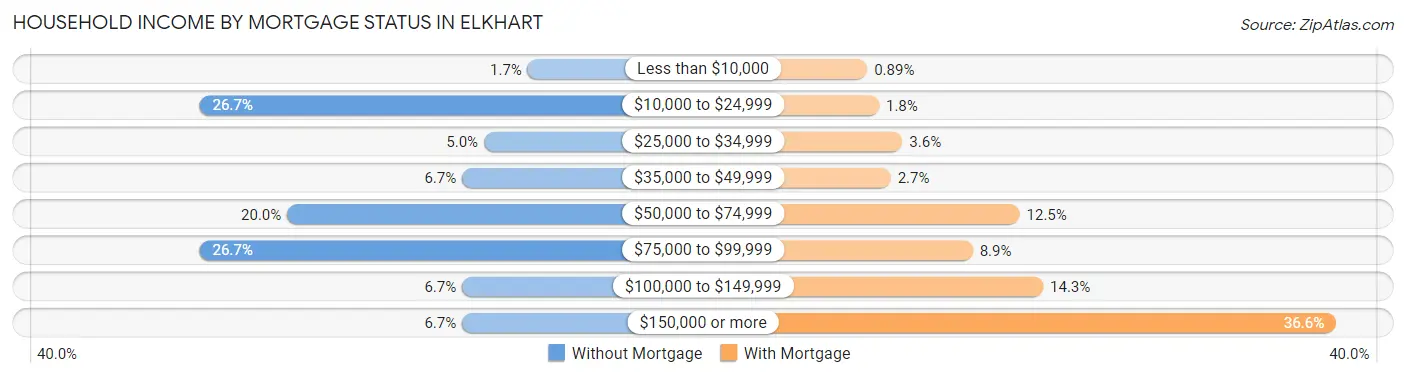
| Household Income | Without Mortgage | With Mortgage |
| Less than $10,000 | 1 (1.7%) | 1 (0.9%) |
| $10,000 to $24,999 | 16 (26.7%) | 2 (1.8%) |
| $25,000 to $34,999 | 3 (5.0%) | 4 (3.6%) |
| $35,000 to $49,999 | 4 (6.7%) | 3 (2.7%) |
| $50,000 to $74,999 | 12 (20.0%) | 14 (12.5%) |
| $75,000 to $99,999 | 16 (26.7%) | 10 (8.9%) |
| $100,000 to $149,999 | 4 (6.7%) | 16 (14.3%) |
| $150,000 or more | 4 (6.7%) | 41 (36.6%) |
| Total | 60 (100.0%) | 112 (100.0%) |
Property Value to Household Income Ratio in Elkhart
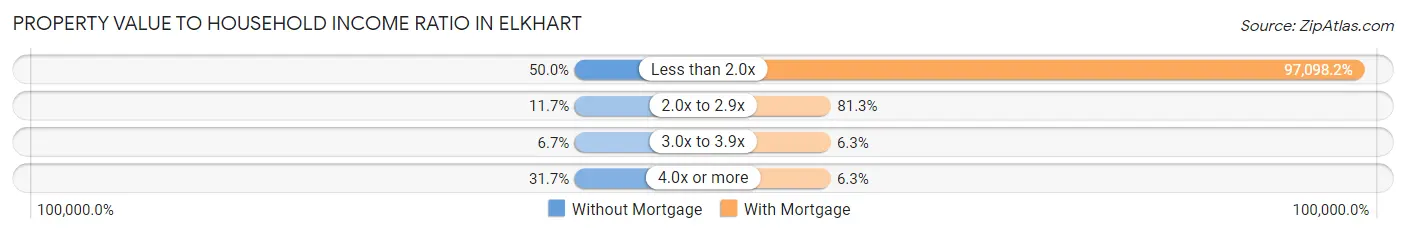
| Value-to-Income Ratio | Without Mortgage | With Mortgage |
| Less than 2.0x | 30 (50.0%) | 108,750 (97,098.2%) |
| 2.0x to 2.9x | 7 (11.7%) | 91 (81.2%) |
| 3.0x to 3.9x | 4 (6.7%) | 7 (6.2%) |
| 4.0x or more | 19 (31.7%) | 7 (6.2%) |
| Total | 60 (100.0%) | 112 (100.0%) |
Real Estate Taxes by Mortgage Status in Elkhart
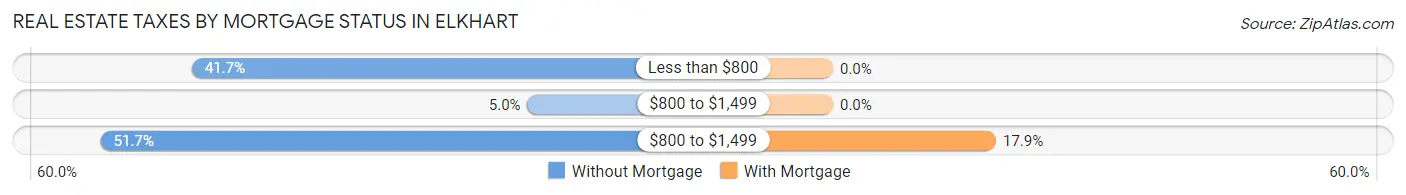
| Property Taxes | Without Mortgage | With Mortgage |
| Less than $800 | 25 (41.7%) | 0 (0.0%) |
| $800 to $1,499 | 3 (5.0%) | 0 (0.0%) |
| $800 to $1,499 | 31 (51.7%) | 20 (17.9%) |
| Total | 60 (100.0%) | 112 (100.0%) |
Health & Disability in Elkhart
Health Insurance Coverage by Age in Elkhart
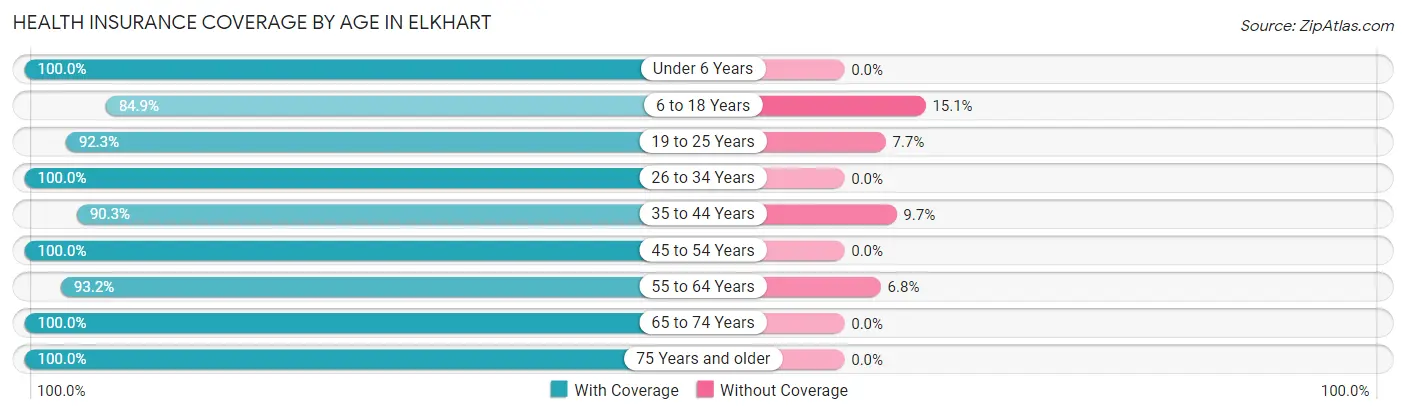
| Age Bracket | With Coverage | Without Coverage |
| Under 6 Years | 26 (100.0%) | 0 (0.0%) |
| 6 to 18 Years | 101 (84.9%) | 18 (15.1%) |
| 19 to 25 Years | 12 (92.3%) | 1 (7.7%) |
| 26 to 34 Years | 33 (100.0%) | 0 (0.0%) |
| 35 to 44 Years | 65 (90.3%) | 7 (9.7%) |
| 45 to 54 Years | 78 (100.0%) | 0 (0.0%) |
| 55 to 64 Years | 55 (93.2%) | 4 (6.8%) |
| 65 to 74 Years | 54 (100.0%) | 0 (0.0%) |
| 75 Years and older | 34 (100.0%) | 0 (0.0%) |
| Total | 458 (93.9%) | 30 (6.1%) |
Health Insurance Coverage by Citizenship Status in Elkhart
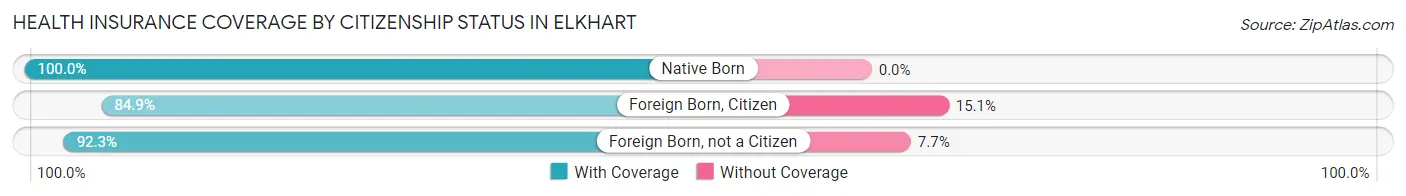
| Citizenship Status | With Coverage | Without Coverage |
| Native Born | 26 (100.0%) | 0 (0.0%) |
| Foreign Born, Citizen | 101 (84.9%) | 18 (15.1%) |
| Foreign Born, not a Citizen | 12 (92.3%) | 1 (7.7%) |
Health Insurance Coverage by Household Income in Elkhart
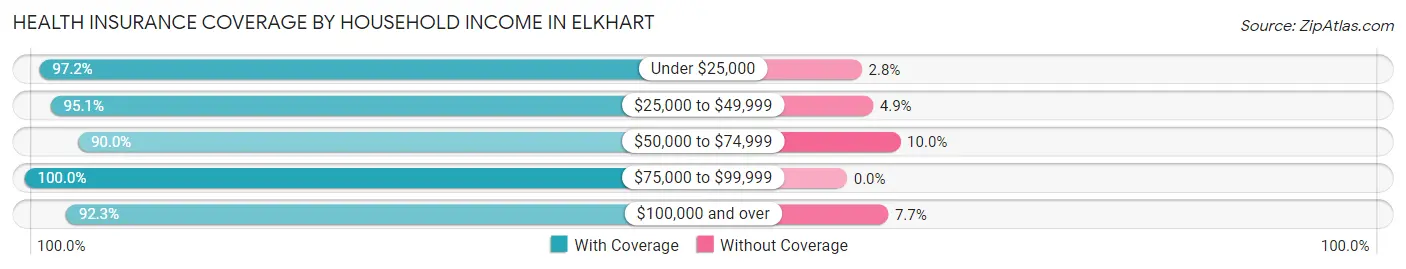
| Household Income | With Coverage | Without Coverage |
| Under $25,000 | 35 (97.2%) | 1 (2.8%) |
| $25,000 to $49,999 | 39 (95.1%) | 2 (4.9%) |
| $50,000 to $74,999 | 63 (90.0%) | 7 (10.0%) |
| $75,000 to $99,999 | 82 (100.0%) | 0 (0.0%) |
| $100,000 and over | 239 (92.3%) | 20 (7.7%) |
Public vs Private Health Insurance Coverage by Age in Elkhart
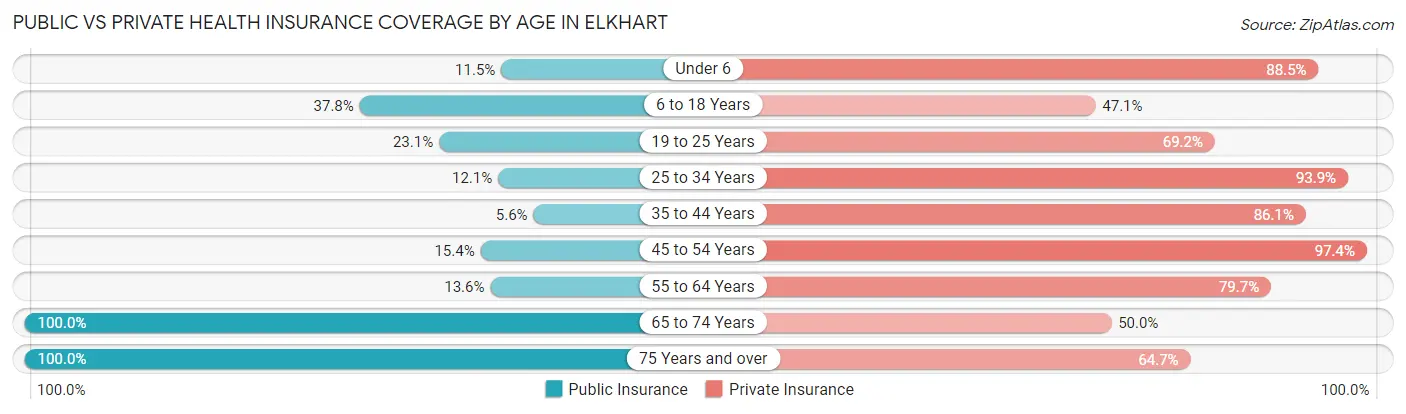
| Age Bracket | Public Insurance | Private Insurance |
| Under 6 | 3 (11.5%) | 23 (88.5%) |
| 6 to 18 Years | 45 (37.8%) | 56 (47.1%) |
| 19 to 25 Years | 3 (23.1%) | 9 (69.2%) |
| 25 to 34 Years | 4 (12.1%) | 31 (93.9%) |
| 35 to 44 Years | 4 (5.6%) | 62 (86.1%) |
| 45 to 54 Years | 12 (15.4%) | 76 (97.4%) |
| 55 to 64 Years | 8 (13.6%) | 47 (79.7%) |
| 65 to 74 Years | 54 (100.0%) | 27 (50.0%) |
| 75 Years and over | 34 (100.0%) | 22 (64.7%) |
| Total | 167 (34.2%) | 353 (72.3%) |
Disability Status by Sex by Age in Elkhart
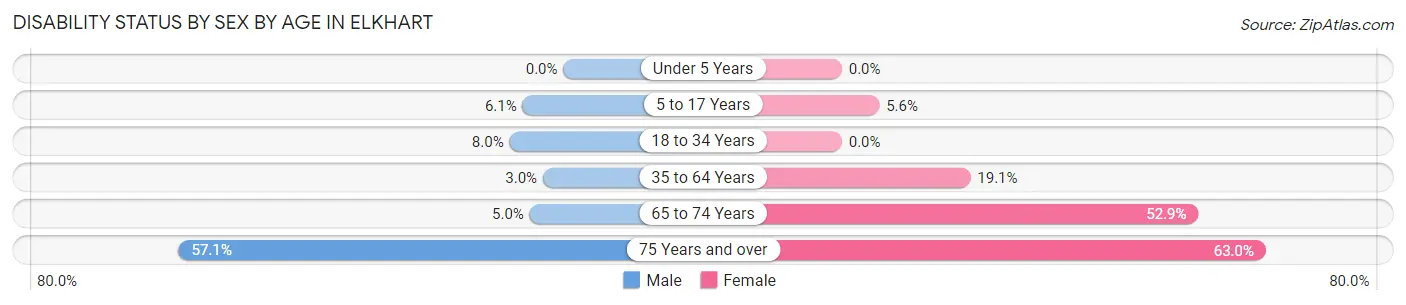
| Age Bracket | Male | Female |
| Under 5 Years | 0 (0.0%) | 0 (0.0%) |
| 5 to 17 Years | 4 (6.1%) | 3 (5.6%) |
| 18 to 34 Years | 2 (8.0%) | 0 (0.0%) |
| 35 to 64 Years | 3 (3.0%) | 21 (19.1%) |
| 65 to 74 Years | 1 (5.0%) | 18 (52.9%) |
| 75 Years and over | 4 (57.1%) | 17 (63.0%) |
Disability Class by Sex by Age in Elkhart
Disability Class: Hearing Difficulty
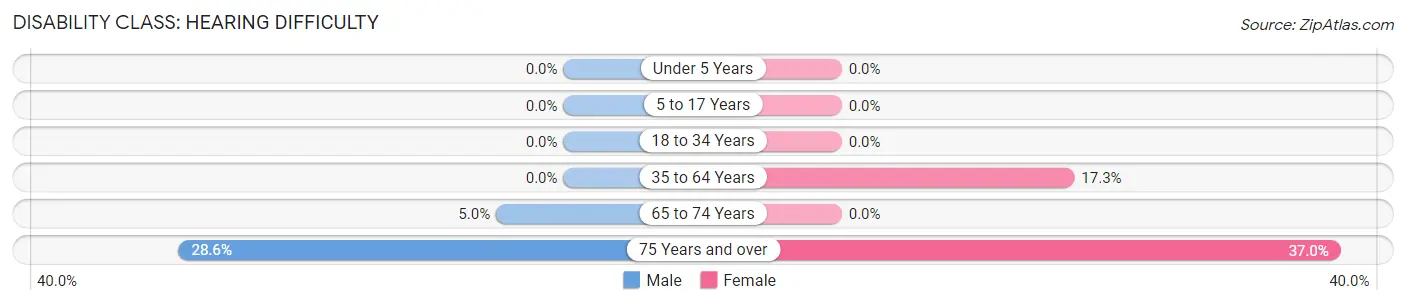
| Age Bracket | Male | Female |
| Under 5 Years | 0 (0.0%) | 0 (0.0%) |
| 5 to 17 Years | 0 (0.0%) | 0 (0.0%) |
| 18 to 34 Years | 0 (0.0%) | 0 (0.0%) |
| 35 to 64 Years | 0 (0.0%) | 19 (17.3%) |
| 65 to 74 Years | 1 (5.0%) | 0 (0.0%) |
| 75 Years and over | 2 (28.6%) | 10 (37.0%) |
Disability Class: Vision Difficulty
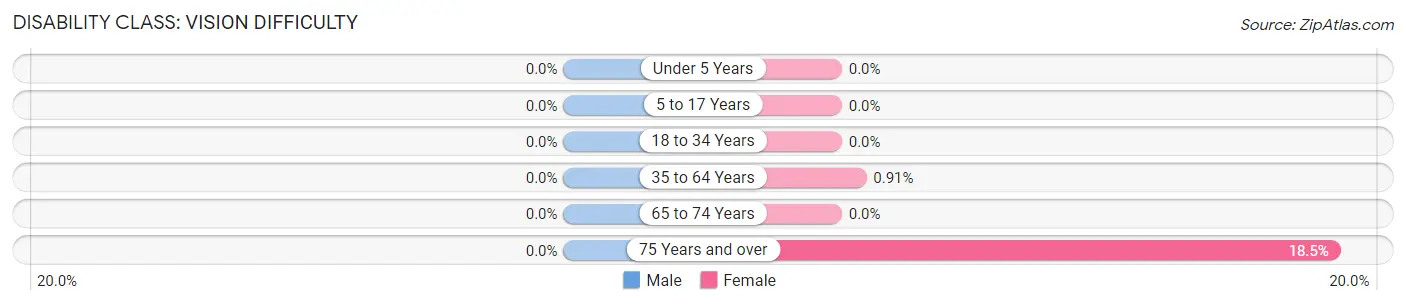
| Age Bracket | Male | Female |
| Under 5 Years | 0 (0.0%) | 0 (0.0%) |
| 5 to 17 Years | 0 (0.0%) | 0 (0.0%) |
| 18 to 34 Years | 0 (0.0%) | 0 (0.0%) |
| 35 to 64 Years | 0 (0.0%) | 1 (0.9%) |
| 65 to 74 Years | 0 (0.0%) | 0 (0.0%) |
| 75 Years and over | 0 (0.0%) | 5 (18.5%) |
Disability Class: Cognitive Difficulty
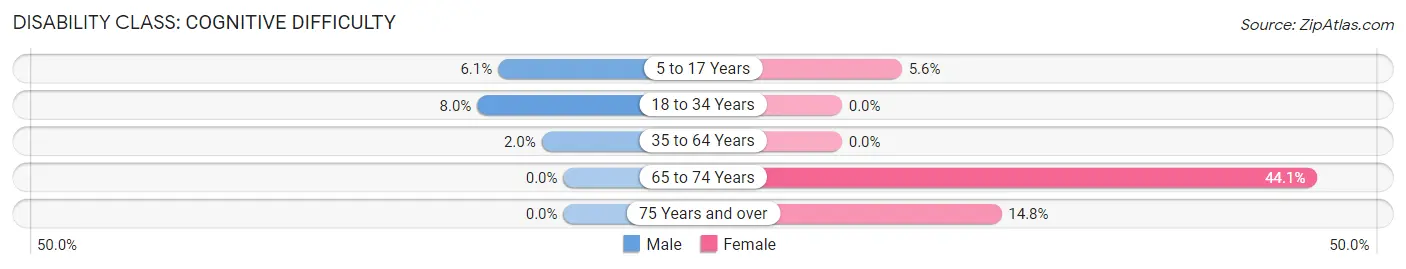
| Age Bracket | Male | Female |
| 5 to 17 Years | 4 (6.1%) | 3 (5.6%) |
| 18 to 34 Years | 2 (8.0%) | 0 (0.0%) |
| 35 to 64 Years | 2 (2.0%) | 0 (0.0%) |
| 65 to 74 Years | 0 (0.0%) | 15 (44.1%) |
| 75 Years and over | 0 (0.0%) | 4 (14.8%) |
Disability Class: Ambulatory Difficulty
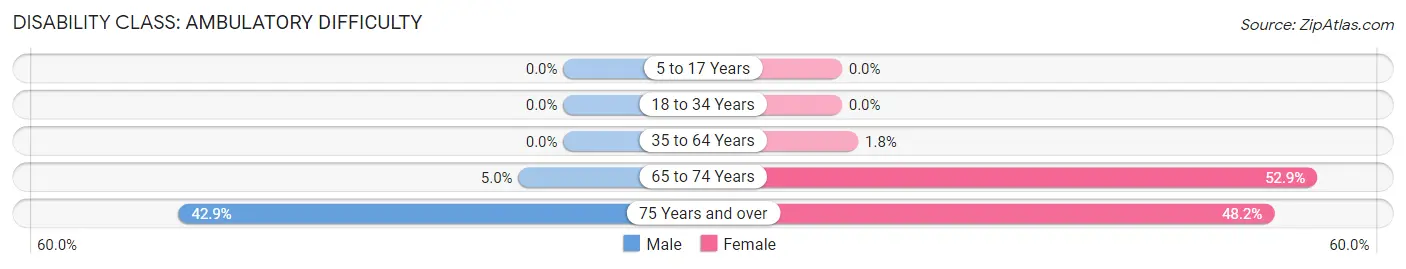
| Age Bracket | Male | Female |
| 5 to 17 Years | 0 (0.0%) | 0 (0.0%) |
| 18 to 34 Years | 0 (0.0%) | 0 (0.0%) |
| 35 to 64 Years | 0 (0.0%) | 2 (1.8%) |
| 65 to 74 Years | 1 (5.0%) | 18 (52.9%) |
| 75 Years and over | 3 (42.9%) | 13 (48.1%) |
Disability Class: Self-Care Difficulty
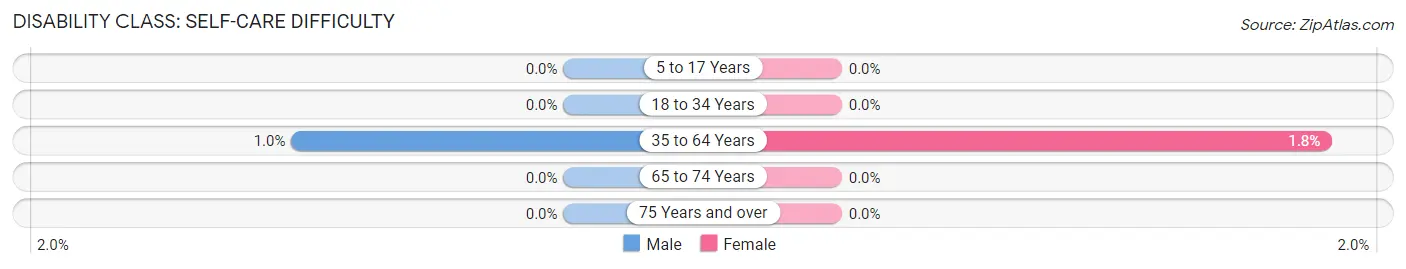
| Age Bracket | Male | Female |
| 5 to 17 Years | 0 (0.0%) | 0 (0.0%) |
| 18 to 34 Years | 0 (0.0%) | 0 (0.0%) |
| 35 to 64 Years | 1 (1.0%) | 2 (1.8%) |
| 65 to 74 Years | 0 (0.0%) | 0 (0.0%) |
| 75 Years and over | 0 (0.0%) | 0 (0.0%) |
Technology Access in Elkhart
Computing Device Access in Elkhart
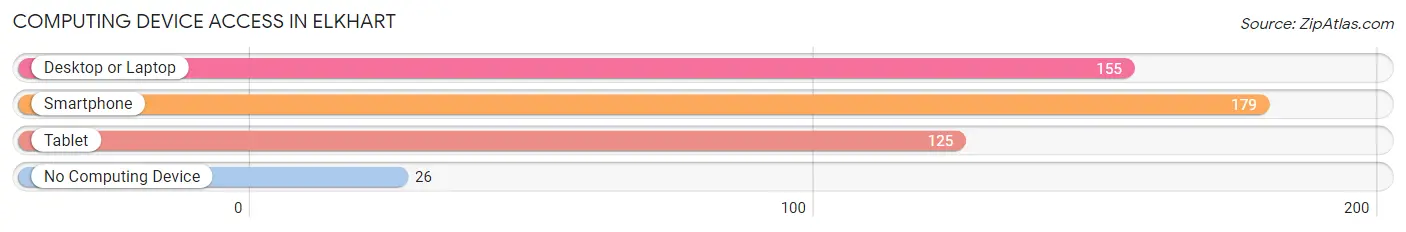
| Device Type | # Households | % Households |
| Desktop or Laptop | 155 | 72.8% |
| Smartphone | 179 | 84.0% |
| Tablet | 125 | 58.7% |
| No Computing Device | 26 | 12.2% |
| Total | 213 | 100.0% |
Internet Access in Elkhart

| Internet Type | # Households | % Households |
| Dial-Up Internet | 0 | 0.0% |
| Broadband Home | 124 | 58.2% |
| Cellular Data Only | 25 | 11.7% |
| Satellite Internet | 35 | 16.4% |
| No Internet | 50 | 23.5% |
| Total | 213 | 100.0% |
Elkhart Summary
Elkhart, Illinois is a small village located in Logan County, Illinois, United States. It is situated on the banks of the Sangamon River, approximately 25 miles northeast of Springfield. The village has a population of approximately 1,000 people and covers an area of 0.6 square miles.
History
Elkhart was founded in 1836 by a group of settlers from Kentucky. The village was named after the Elkhart River in Indiana, which was named after the Elkhart tribe of Native Americans. The first settlers were primarily farmers and the village quickly grew to become a thriving agricultural community.
In 1837, the first post office was established in Elkhart and the village was officially incorporated in 1839. The first school was built in 1841 and the first church was built in 1845.
In the late 19th century, Elkhart was a major stop on the Chicago and Alton Railroad. The railroad brought new businesses and industries to the village, including a flour mill, a sawmill, a brickyard, and a furniture factory.
Geography
Elkhart is located in central Illinois, approximately 25 miles northeast of Springfield. The village is situated on the banks of the Sangamon River and is surrounded by rolling hills and farmland. The climate is humid continental, with hot summers and cold winters.
The village covers an area of 0.6 square miles and has a population of approximately 1,000 people. The nearest major cities are Springfield (25 miles), Decatur (50 miles), and Bloomington (75 miles).
Economy
Elkhart’s economy is primarily based on agriculture. The village is home to several farms, which produce corn, soybeans, wheat, and other crops. The village also has a few small businesses, including a grocery store, a hardware store, and a restaurant.
Demographics
As of the 2010 census, Elkhart had a population of 1,000 people. The racial makeup of the village was 97.2% White, 0.7% African American, 0.3% Native American, 0.2% Asian, and 1.6% from other races. The median household income was $41,250 and the median family income was $50,000.
Elkhart is a small, rural village with a close-knit community. The village is home to several churches, a library, and a community center. The village also hosts several annual events, including a Fourth of July parade and a Christmas tree lighting ceremony.
Common Questions
What is the Total Population of Elkhart?
Total Population of Elkhart is 488.
What is the Total Male Population of Elkhart?
Total Male Population of Elkhart is 229.
What is the Total Female Population of Elkhart?
Total Female Population of Elkhart is 259.
What is the Ratio of Males per 100 Females in Elkhart?
There are 88.42 Males per 100 Females in Elkhart.
What is the Ratio of Females per 100 Males in Elkhart?
There are 113.10 Females per 100 Males in Elkhart.
What is the Median Population Age in Elkhart?
Median Population Age in Elkhart is 40.8 Years.
What is the Average Family Size in Elkhart
Average Family Size in Elkhart is 3.1 People.
What is the Average Household Size in Elkhart
Average Household Size in Elkhart is 2.3 People.
What is Per Capita Income in Elkhart?
Per Capita income in Elkhart is $37,936.
What is the Median Family Income in Elkhart?
Median Family Income in Elkhart is $106,875.
What is the Median Household income in Elkhart?
Median Household Income in Elkhart is $89,792.
What is Income or Wage Gap in Elkhart?
Income or Wage Gap in Elkhart is 33.8%.
Women in Elkhart earn 66.2 cents for every dollar earned by a man.
What is Inequality or Gini Index in Elkhart?
Inequality or Gini Index in Elkhart is 0.32.
How Large is the Labor Force in Elkhart?
There are 238 People in the Labor Forcein in Elkhart.
What is the Percentage of People in the Labor Force in Elkhart?
67.6% of People are in the Labor Force in Elkhart.
What is the Unemployment Rate in Elkhart?
Unemployment Rate in Elkhart is 0.8%.