Zip Codes with the Highest Percentage of Population with a Degree in Visual and Performing Arts in Champaign, IL
RELATED REPORTS & OPTIONS
Visual and Performing Arts
Champaign
Compare Zip Codes
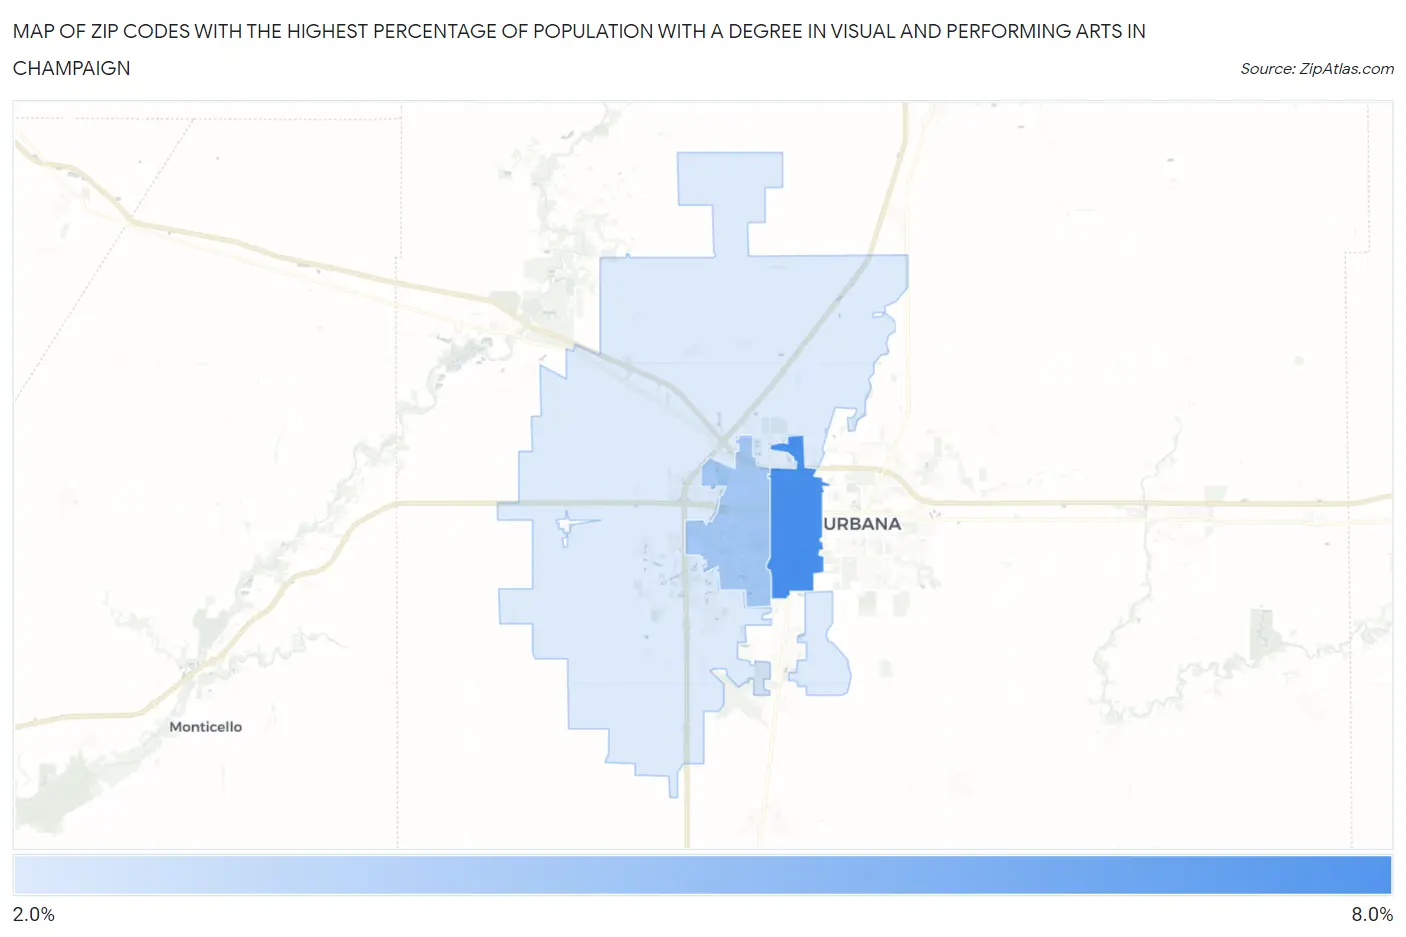
Map of Zip Codes with the Highest Percentage of Population with a Degree in Visual and Performing Arts in Champaign
0.0%
8.0%
Zip Codes with the Highest Percentage of Population with a Degree in Visual and Performing Arts in Champaign, IL
| Zip Code | % Graduates | vs State | vs National | |
| 1. | 61820 | 7.7% | 4.4%(+3.26)#114 | 4.3%(+3.46)#3,045 |
| 2. | 61821 | 4.5% | 4.4%(+0.061)#304 | 4.3%(+0.259)#7,779 |
| 3. | 61822 | 2.6% | 4.4%(-1.85)#582 | 4.3%(-1.65)#14,256 |
1
Common Questions
What are the Top Zip Codes with the Highest Percentage of Population with a Degree in Visual and Performing Arts in Champaign, IL?
Top Zip Codes with the Highest Percentage of Population with a Degree in Visual and Performing Arts in Champaign, IL are:
What zip code has the Highest Percentage of Population with a Degree in Visual and Performing Arts in Champaign, IL?
61820 has the Highest Percentage of Population with a Degree in Visual and Performing Arts in Champaign, IL with 7.7%.
What is the Percentage of Population with a Degree in Visual and Performing Arts in Champaign, IL?
Percentage of Population with a Degree in Visual and Performing Arts in Champaign is 4.5%.
What is the Percentage of Population with a Degree in Visual and Performing Arts in Illinois?
Percentage of Population with a Degree in Visual and Performing Arts in Illinois is 4.4%.
What is the Percentage of Population with a Degree in Visual and Performing Arts in the United States?
Percentage of Population with a Degree in Visual and Performing Arts in the United States is 4.3%.