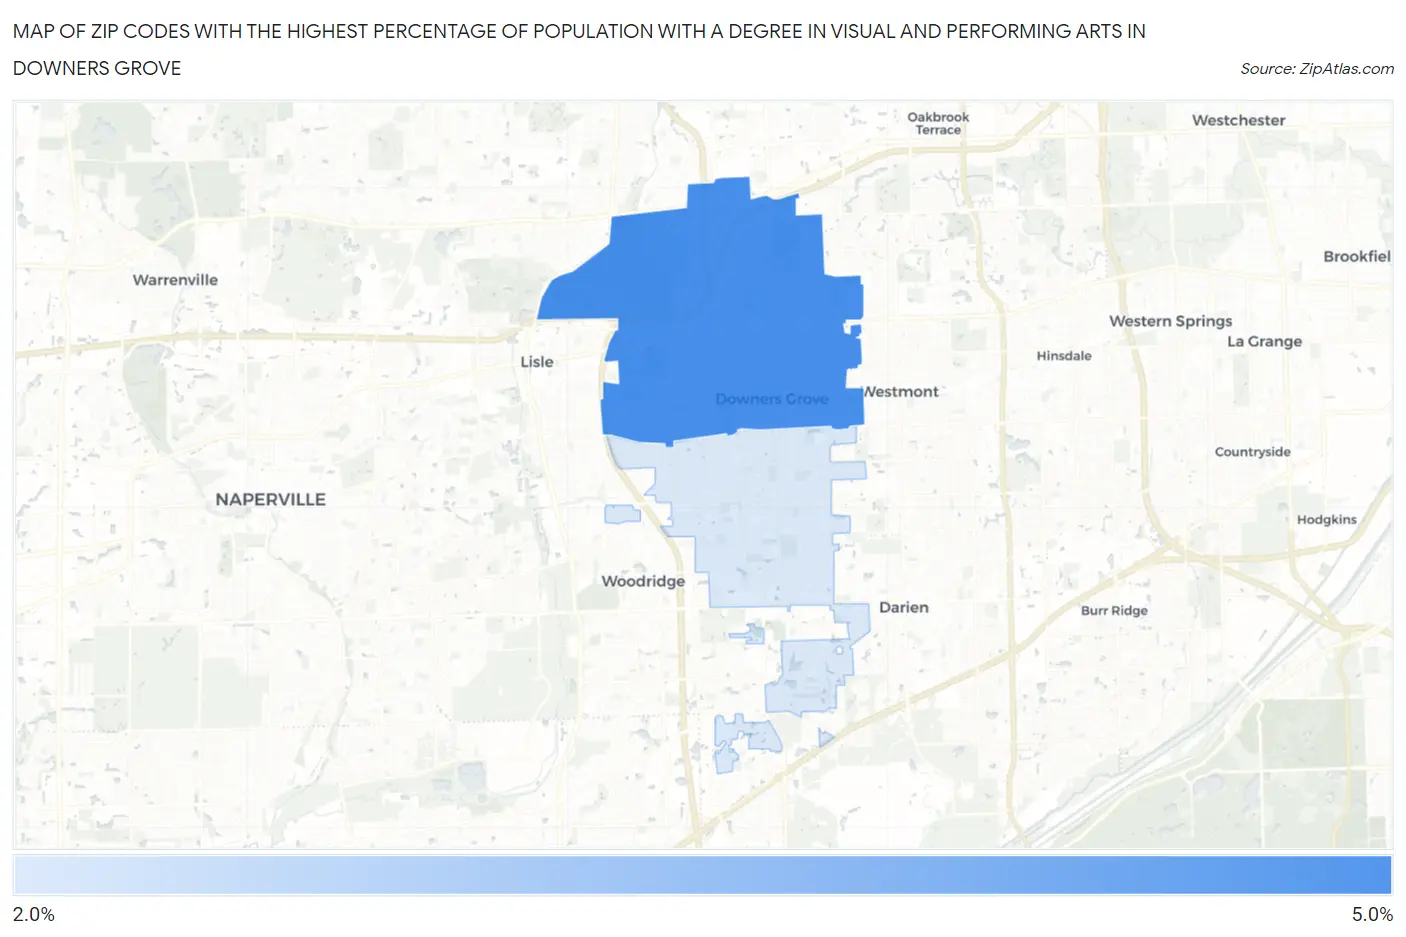
Zip Codes with the Highest Percentage of Population with a Degree in Visual and Performing Arts in Downers Grove, IL
RELATED REPORTS & OPTIONS
Visual and Performing Arts
Downers Grove
Compare Zip Codes
Map of Zip Codes with the Highest Percentage of Population with a Degree in Visual and Performing Arts in Downers Grove
0.0%
5.0%
Zip Codes with the Highest Percentage of Population with a Degree in Visual and Performing Arts in Downers Grove, IL
| Zip Code | % Graduates | vs State | vs National | |
| 1. | 60515 | 4.6% | 4.4%(+0.198)#287 | 4.3%(+0.396)#7,423 |
| 2. | 60516 | 2.4% | 4.4%(-2.08)#619 | 4.3%(-1.89)#15,120 |
1
Common Questions
What are the Top Zip Codes with the Highest Percentage of Population with a Degree in Visual and Performing Arts in Downers Grove, IL?
Top Zip Codes with the Highest Percentage of Population with a Degree in Visual and Performing Arts in Downers Grove, IL are:
What zip code has the Highest Percentage of Population with a Degree in Visual and Performing Arts in Downers Grove, IL?
60515 has the Highest Percentage of Population with a Degree in Visual and Performing Arts in Downers Grove, IL with 4.6%.
What is the Percentage of Population with a Degree in Visual and Performing Arts in Downers Grove, IL?
Percentage of Population with a Degree in Visual and Performing Arts in Downers Grove is 3.7%.
What is the Percentage of Population with a Degree in Visual and Performing Arts in Illinois?
Percentage of Population with a Degree in Visual and Performing Arts in Illinois is 4.4%.
What is the Percentage of Population with a Degree in Visual and Performing Arts in the United States?
Percentage of Population with a Degree in Visual and Performing Arts in the United States is 4.3%.