Zip Codes with the Highest Percentage of Population with a Degree in Visual and Performing Arts in Carbondale, IL
RELATED REPORTS & OPTIONS
Visual and Performing Arts
Carbondale
Compare Zip Codes
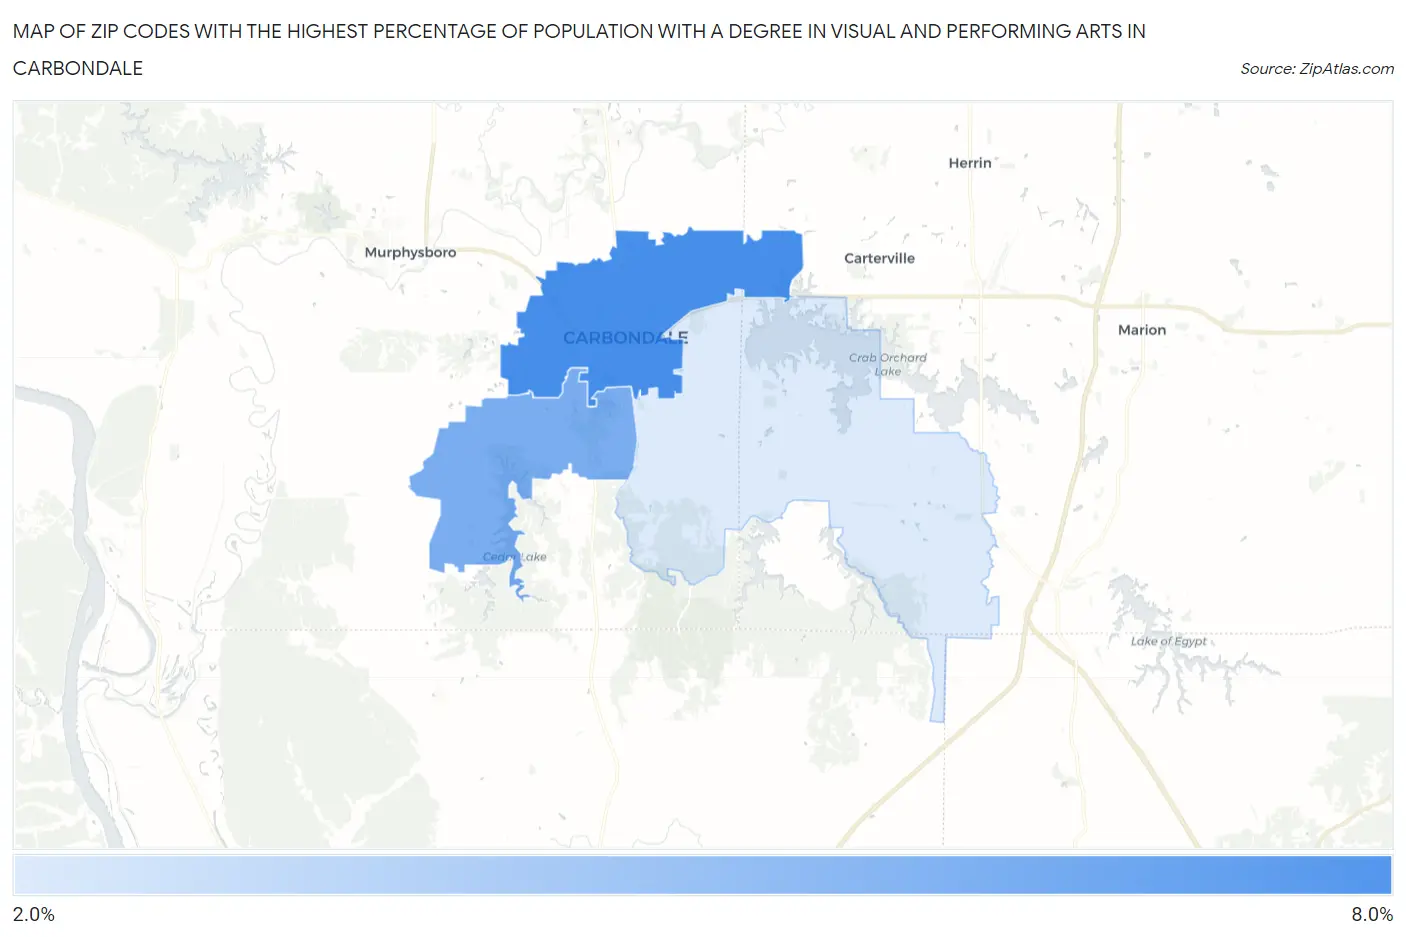
Map of Zip Codes with the Highest Percentage of Population with a Degree in Visual and Performing Arts in Carbondale
0.0%
8.0%
Zip Codes with the Highest Percentage of Population with a Degree in Visual and Performing Arts in Carbondale, IL
| Zip Code | % Graduates | vs State | vs National | |
| 1. | 62901 | 6.6% | 4.4%(+2.12)#169 | 4.3%(+2.32)#4,159 |
| 2. | 62903 | 5.4% | 4.4%(+0.905)#225 | 4.3%(+1.10)#5,940 |
| 3. | 62902 | 2.9% | 4.4%(-1.50)#529 | 4.3%(-1.30)#12,922 |
1
Common Questions
What are the Top Zip Codes with the Highest Percentage of Population with a Degree in Visual and Performing Arts in Carbondale, IL?
Top Zip Codes with the Highest Percentage of Population with a Degree in Visual and Performing Arts in Carbondale, IL are:
What zip code has the Highest Percentage of Population with a Degree in Visual and Performing Arts in Carbondale, IL?
62901 has the Highest Percentage of Population with a Degree in Visual and Performing Arts in Carbondale, IL with 6.6%.
What is the Percentage of Population with a Degree in Visual and Performing Arts in Carbondale, IL?
Percentage of Population with a Degree in Visual and Performing Arts in Carbondale is 6.4%.
What is the Percentage of Population with a Degree in Visual and Performing Arts in Illinois?
Percentage of Population with a Degree in Visual and Performing Arts in Illinois is 4.4%.
What is the Percentage of Population with a Degree in Visual and Performing Arts in the United States?
Percentage of Population with a Degree in Visual and Performing Arts in the United States is 4.3%.