Zip Codes with the Highest Percentage of Population with a Degree in Visual and Performing Arts in Peoria, IL
RELATED REPORTS & OPTIONS
Visual and Performing Arts
Peoria
Compare Zip Codes
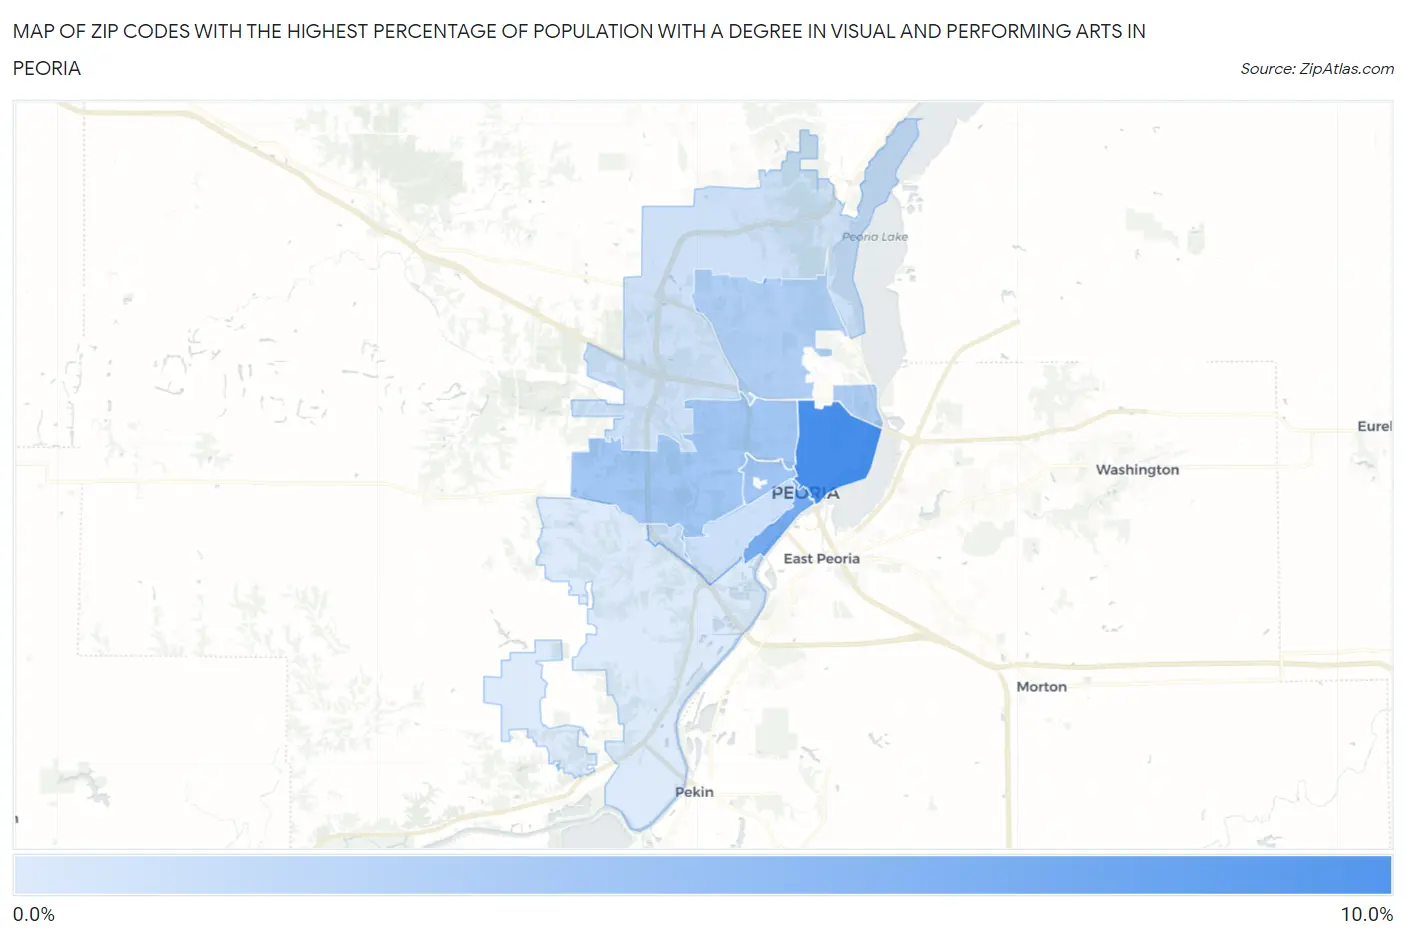
Map of Zip Codes with the Highest Percentage of Population with a Degree in Visual and Performing Arts in Peoria
0.0%
10.0%
Zip Codes with the Highest Percentage of Population with a Degree in Visual and Performing Arts in Peoria, IL
| Zip Code | % Graduates | vs State | vs National | |
| 1. | 61603 | 9.9% | 4.4%(+5.49)#67 | 4.3%(+5.69)#1,861 |
| 2. | 61602 | 7.3% | 4.4%(+2.81)#133 | 4.3%(+3.01)#3,415 |
| 3. | 61606 | 4.9% | 4.4%(+0.449)#254 | 4.3%(+0.647)#6,866 |
| 4. | 61604 | 4.8% | 4.4%(+0.367)#261 | 4.3%(+0.565)#7,035 |
| 5. | 61614 | 4.0% | 4.4%(-0.419)#360 | 4.3%(-0.221)#9,151 |
| 6. | 61605 | 2.6% | 4.4%(-1.89)#592 | 4.3%(-1.69)#14,415 |
| 7. | 61615 | 2.5% | 4.4%(-2.00)#606 | 4.3%(-1.80)#14,780 |
| 8. | 61607 | 1.7% | 4.4%(-2.79)#704 | 4.3%(-2.59)#17,633 |
1
Common Questions
What are the Top 5 Zip Codes with the Highest Percentage of Population with a Degree in Visual and Performing Arts in Peoria, IL?
Top 5 Zip Codes with the Highest Percentage of Population with a Degree in Visual and Performing Arts in Peoria, IL are:
What zip code has the Highest Percentage of Population with a Degree in Visual and Performing Arts in Peoria, IL?
61603 has the Highest Percentage of Population with a Degree in Visual and Performing Arts in Peoria, IL with 9.9%.
What is the Percentage of Population with a Degree in Visual and Performing Arts in Peoria, IL?
Percentage of Population with a Degree in Visual and Performing Arts in Peoria is 3.2%.
What is the Percentage of Population with a Degree in Visual and Performing Arts in Illinois?
Percentage of Population with a Degree in Visual and Performing Arts in Illinois is 4.4%.
What is the Percentage of Population with a Degree in Visual and Performing Arts in the United States?
Percentage of Population with a Degree in Visual and Performing Arts in the United States is 4.3%.