Hillcrest, IL
Hillcrest Map
Hillcrest Overview
1,694
TOTAL POPULATION
842
MALE POPULATION
852
FEMALE POPULATION
98.83
MALES / 100 FEMALES
101.19
FEMALES / 100 MALES
37.2
MEDIAN AGE
3.3
AVG FAMILY SIZE
3.0
AVG HOUSEHOLD SIZE
$29,394
PER CAPITA INCOME
$96,087
AVG FAMILY INCOME
$73,750
AVG HOUSEHOLD INCOME
10.4%
WAGE / INCOME GAP [ % ]
89.6¢/ $1
WAGE / INCOME GAP [ $ ]
0.40
INEQUALITY / GINI INDEX
946
LABOR FORCE [ PEOPLE ]
72.4%
PERCENT IN LABOR FORCE
5.4%
UNEMPLOYMENT RATE
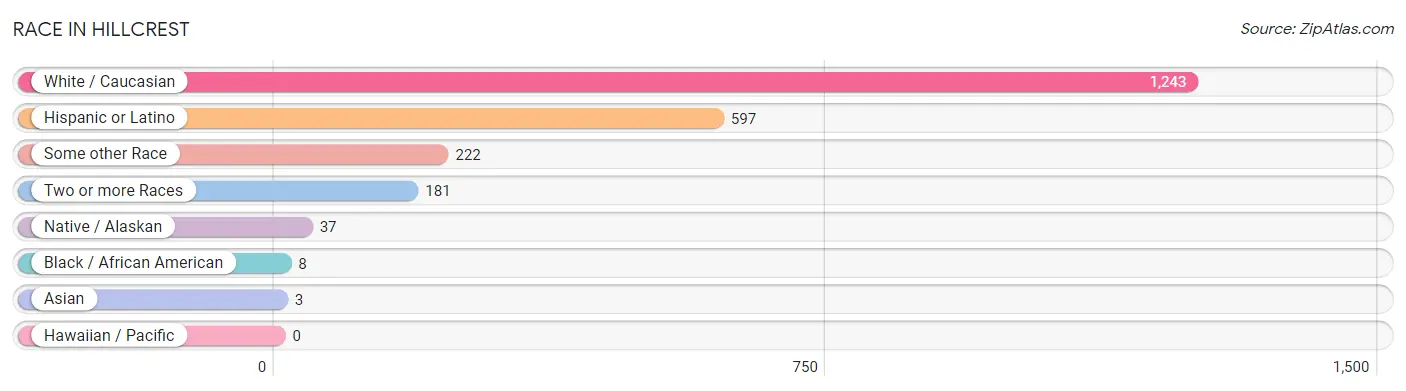
Race in Hillcrest
The most populous races in Hillcrest are White / Caucasian (1,243 | 73.4%), Hispanic or Latino (597 | 35.2%), and Some other Race (222 | 13.1%).
| Race | # Population | % Population |
| Asian | 3 | 0.2% |
| Black / African American | 8 | 0.5% |
| Hawaiian / Pacific | 0 | 0.0% |
| Hispanic or Latino | 597 | 35.2% |
| Native / Alaskan | 37 | 2.2% |
| White / Caucasian | 1,243 | 73.4% |
| Two or more Races | 181 | 10.7% |
| Some other Race | 222 | 13.1% |
| Total | 1,694 | 100.0% |
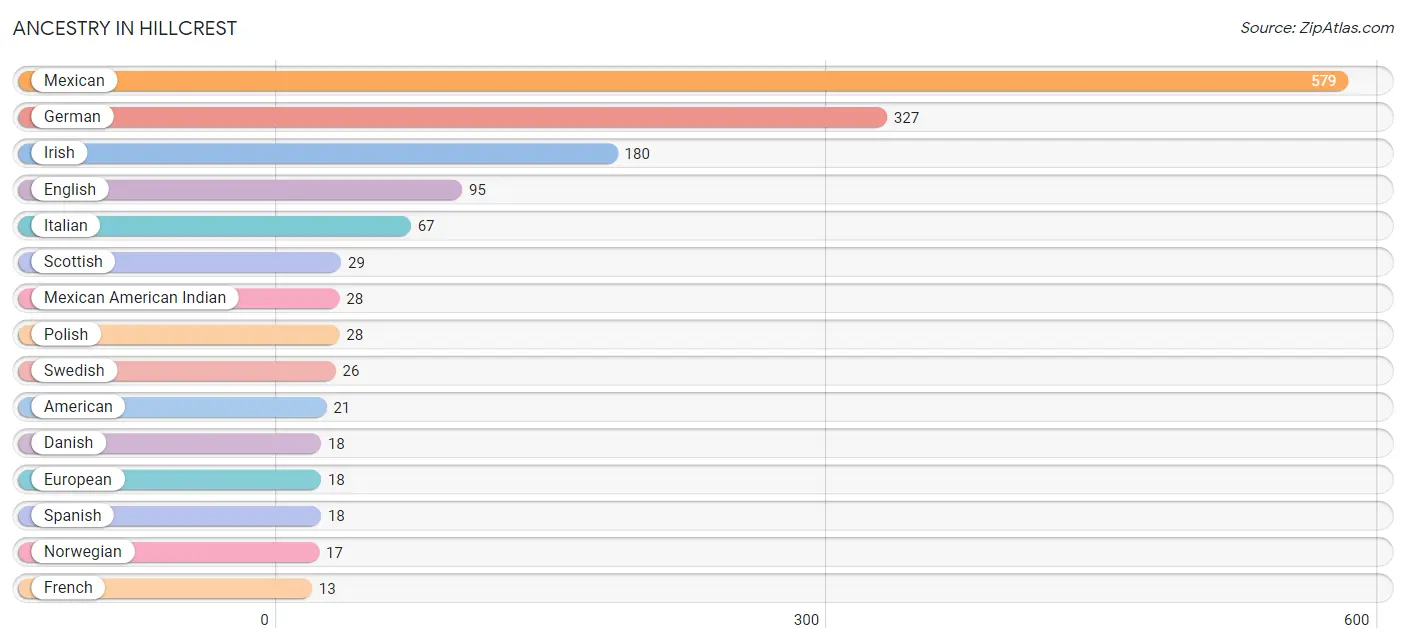
Ancestry in Hillcrest
The most populous ancestries reported in Hillcrest are Mexican (579 | 34.2%), German (327 | 19.3%), Irish (180 | 10.6%), English (95 | 5.6%), and Italian (67 | 4.0%), together accounting for 73.7% of all Hillcrest residents.
| Ancestry | # Population | % Population |
| American | 21 | 1.2% |
| Arab | 12 | 0.7% |
| Czech | 5 | 0.3% |
| Czechoslovakian | 2 | 0.1% |
| Danish | 18 | 1.1% |
| Dutch | 12 | 0.7% |
| English | 95 | 5.6% |
| European | 18 | 1.1% |
| French | 13 | 0.8% |
| German | 327 | 19.3% |
| Greek | 4 | 0.2% |
| Indian (Asian) | 8 | 0.5% |
| Irish | 180 | 10.6% |
| Italian | 67 | 4.0% |
| Korean | 5 | 0.3% |
| Mexican | 579 | 34.2% |
| Mexican American Indian | 28 | 1.7% |
| Norwegian | 17 | 1.0% |
| Polish | 28 | 1.7% |
| Scotch-Irish | 3 | 0.2% |
| Scottish | 29 | 1.7% |
| Spanish | 18 | 1.1% |
| Swedish | 26 | 1.5% |
| Swiss | 4 | 0.2% |
| Ukrainian | 3 | 0.2% | View All 25 Rows |
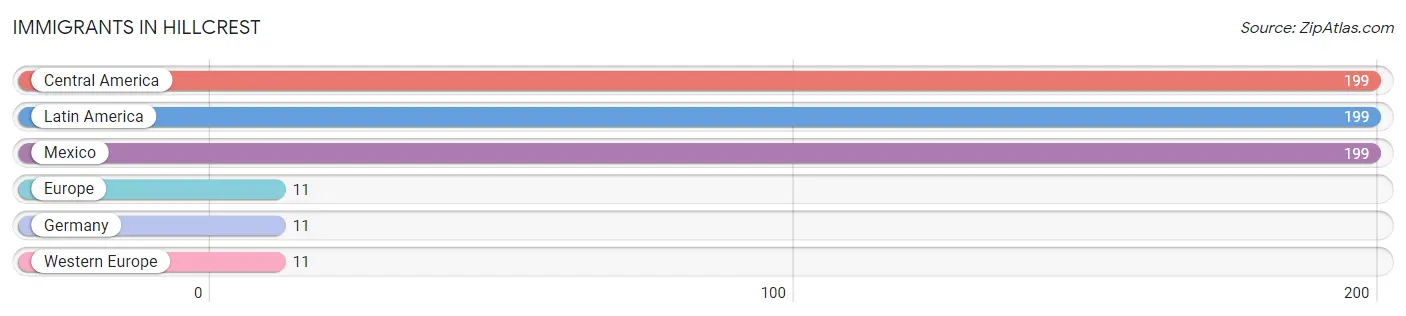
Immigrants in Hillcrest
The most numerous immigrant groups reported in Hillcrest came from Central America (199 | 11.7%), Latin America (199 | 11.7%), Mexico (199 | 11.7%), Europe (11 | 0.6%), and Germany (11 | 0.6%), together accounting for 36.5% of all Hillcrest residents.
| Immigration Origin | # Population | % Population |
| Central America | 199 | 11.7% |
| Europe | 11 | 0.6% |
| Germany | 11 | 0.6% |
| Latin America | 199 | 11.7% |
| Mexico | 199 | 11.7% |
| Western Europe | 11 | 0.6% | View All 6 Rows |
Sex and Age in Hillcrest
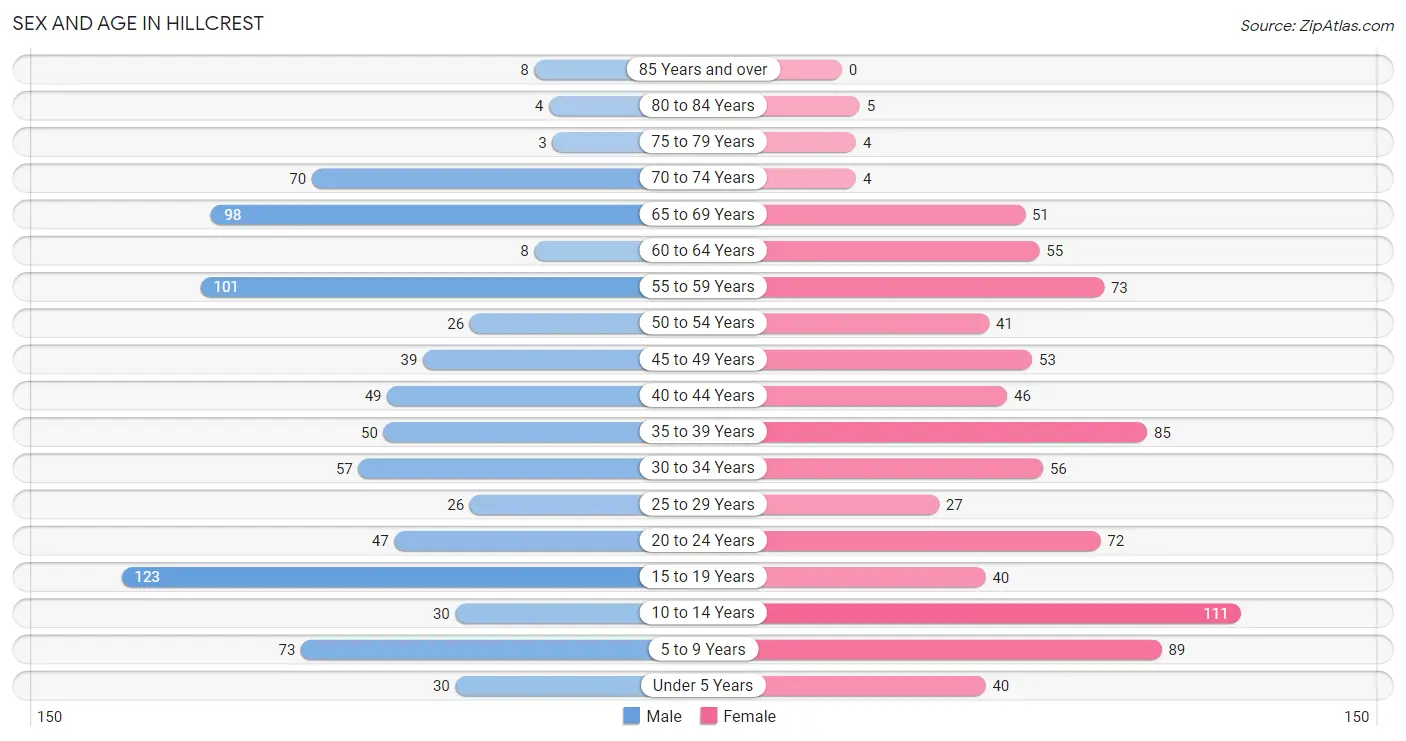
Sex and Age in Hillcrest
The most populous age groups in Hillcrest are 15 to 19 Years (123 | 14.6%) for men and 10 to 14 Years (111 | 13.0%) for women.
| Age Bracket | Male | Female |
| Under 5 Years | 30 (3.6%) | 40 (4.7%) |
| 5 to 9 Years | 73 (8.7%) | 89 (10.4%) |
| 10 to 14 Years | 30 (3.6%) | 111 (13.0%) |
| 15 to 19 Years | 123 (14.6%) | 40 (4.7%) |
| 20 to 24 Years | 47 (5.6%) | 72 (8.5%) |
| 25 to 29 Years | 26 (3.1%) | 27 (3.2%) |
| 30 to 34 Years | 57 (6.8%) | 56 (6.6%) |
| 35 to 39 Years | 50 (5.9%) | 85 (10.0%) |
| 40 to 44 Years | 49 (5.8%) | 46 (5.4%) |
| 45 to 49 Years | 39 (4.6%) | 53 (6.2%) |
| 50 to 54 Years | 26 (3.1%) | 41 (4.8%) |
| 55 to 59 Years | 101 (12.0%) | 73 (8.6%) |
| 60 to 64 Years | 8 (0.9%) | 55 (6.5%) |
| 65 to 69 Years | 98 (11.6%) | 51 (6.0%) |
| 70 to 74 Years | 70 (8.3%) | 4 (0.5%) |
| 75 to 79 Years | 3 (0.4%) | 4 (0.5%) |
| 80 to 84 Years | 4 (0.5%) | 5 (0.6%) |
| 85 Years and over | 8 (0.9%) | 0 (0.0%) |
| Total | 842 (100.0%) | 852 (100.0%) |
Families and Households in Hillcrest
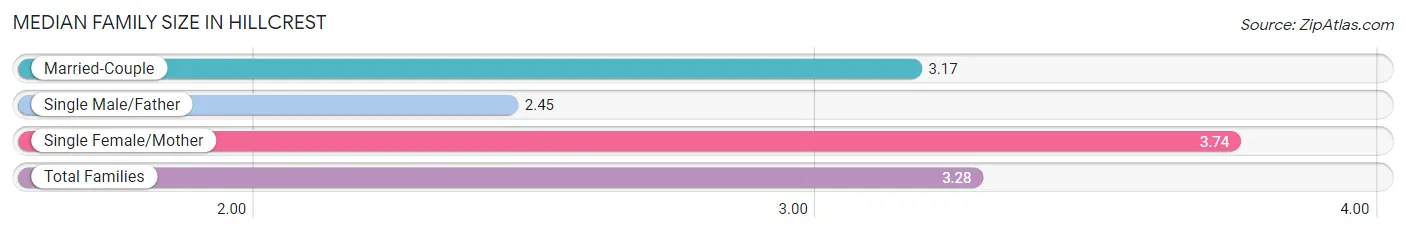
Median Family Size in Hillcrest
The median family size in Hillcrest is 3.28 persons per family, with single female/mother families (108 | 26.3%) accounting for the largest median family size of 3.74 persons per family. On the other hand, single male/father families (22 | 5.4%) represent the smallest median family size with 2.45 persons per family.
| Family Type | # Families | Family Size |
| Married-Couple | 280 (68.3%) | 3.17 |
| Single Male/Father | 22 (5.4%) | 2.45 |
| Single Female/Mother | 108 (26.3%) | 3.74 |
| Total Families | 410 (100.0%) | 3.28 |
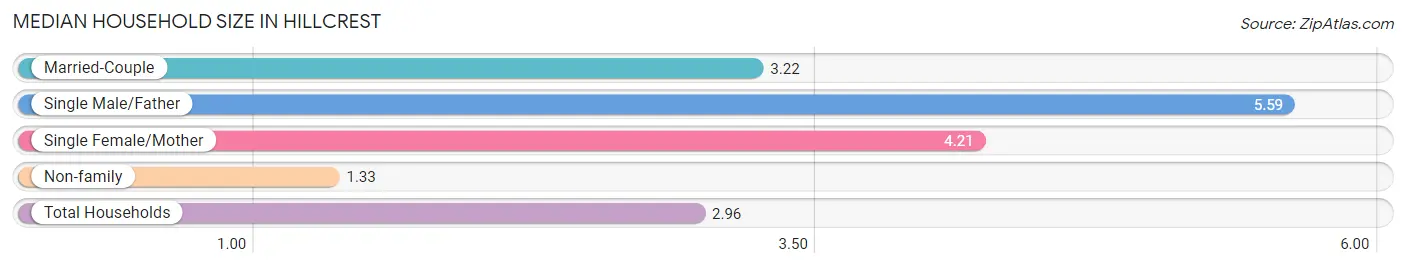
Median Household Size in Hillcrest
The median household size in Hillcrest is 2.96 persons per household, with single male/father households (22 | 3.8%) accounting for the largest median household size of 5.59 persons per household. non-family households (162 | 28.3%) represent the smallest median household size with 1.33 persons per household.
| Household Type | # Households | Household Size |
| Married-Couple | 280 (48.9%) | 3.22 |
| Single Male/Father | 22 (3.8%) | 5.59 |
| Single Female/Mother | 108 (18.9%) | 4.21 |
| Non-family | 162 (28.3%) | 1.33 |
| Total Households | 572 (100.0%) | 2.96 |
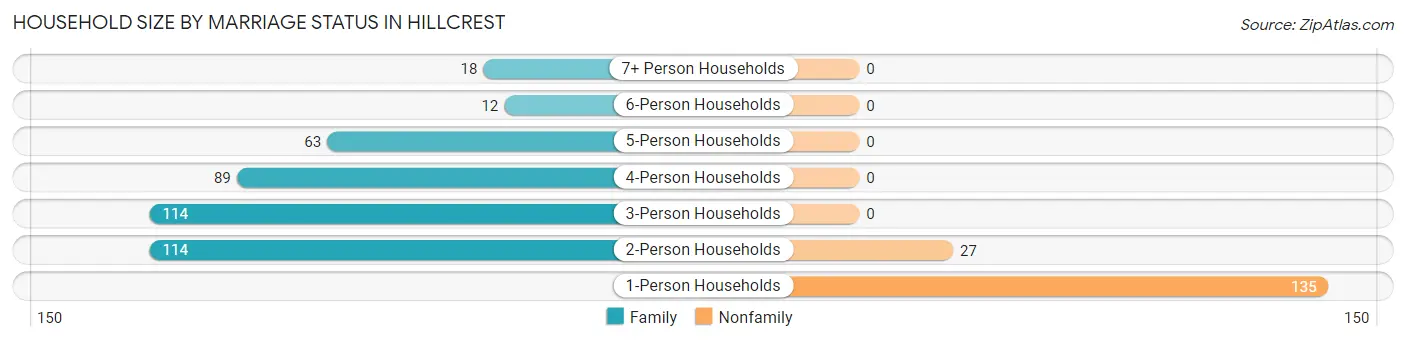
Household Size by Marriage Status in Hillcrest
Out of a total of 572 households in Hillcrest, 410 (71.7%) are family households, while 162 (28.3%) are nonfamily households. The most numerous type of family households are 2-person households, comprising 114, and the most common type of nonfamily households are 1-person households, comprising 135.
| Household Size | Family Households | Nonfamily Households |
| 1-Person Households | - | 135 (23.6%) |
| 2-Person Households | 114 (19.9%) | 27 (4.7%) |
| 3-Person Households | 114 (19.9%) | 0 (0.0%) |
| 4-Person Households | 89 (15.6%) | 0 (0.0%) |
| 5-Person Households | 63 (11.0%) | 0 (0.0%) |
| 6-Person Households | 12 (2.1%) | 0 (0.0%) |
| 7+ Person Households | 18 (3.2%) | 0 (0.0%) |
| Total | 410 (71.7%) | 162 (28.3%) |
Female Fertility in Hillcrest
Fertility by Age in Hillcrest
Average fertility rate in Hillcrest is 18.0 births per 1,000 women. Women in the age bracket of 20 to 34 years have the highest fertility rate with 45.0 births per 1,000 women. Women in the age bracket of 20 to 34 years acount for 100.0% of all women with births.
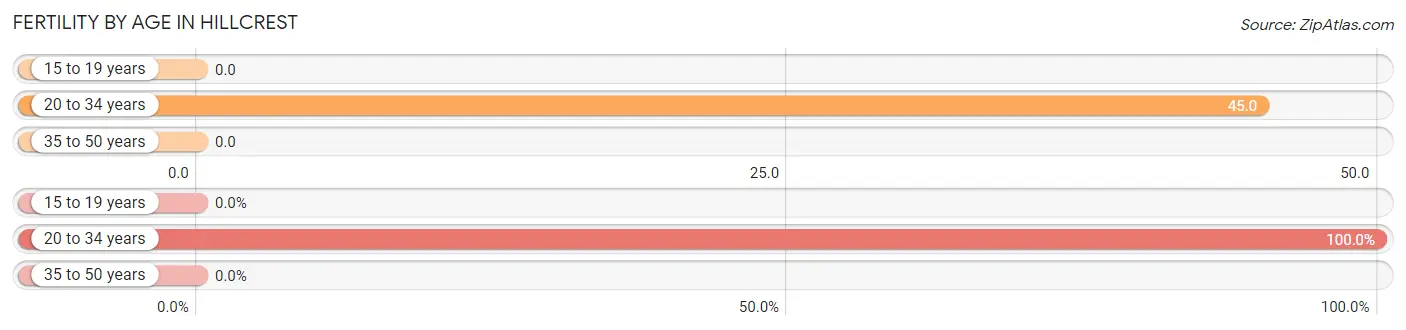
| Age Bracket | Women with Births | Births / 1,000 Women |
| 15 to 19 years | 0 (0.0%) | 0.0 |
| 20 to 34 years | 7 (100.0%) | 45.0 |
| 35 to 50 years | 0 (0.0%) | 0.0 |
| Total | 7 (100.0%) | 18.0 |
Fertility by Age by Marriage Status in Hillcrest
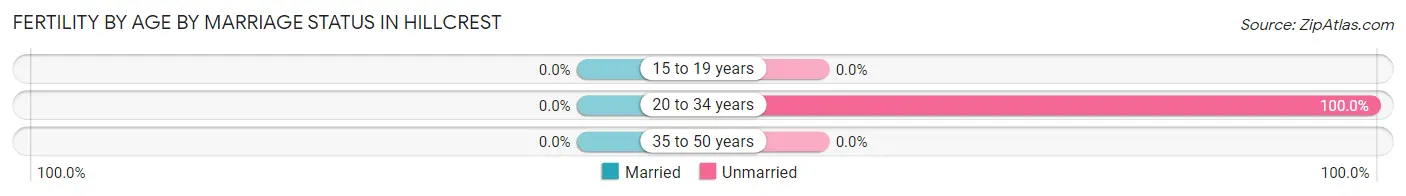
| Age Bracket | Married | Unmarried |
| 15 to 19 years | 0 (0.0%) | 0 (0.0%) |
| 20 to 34 years | 0 (0.0%) | 7 (100.0%) |
| 35 to 50 years | 0 (0.0%) | 0 (0.0%) |
| Total | 0 (0.0%) | 7 (100.0%) |
Fertility by Education in Hillcrest
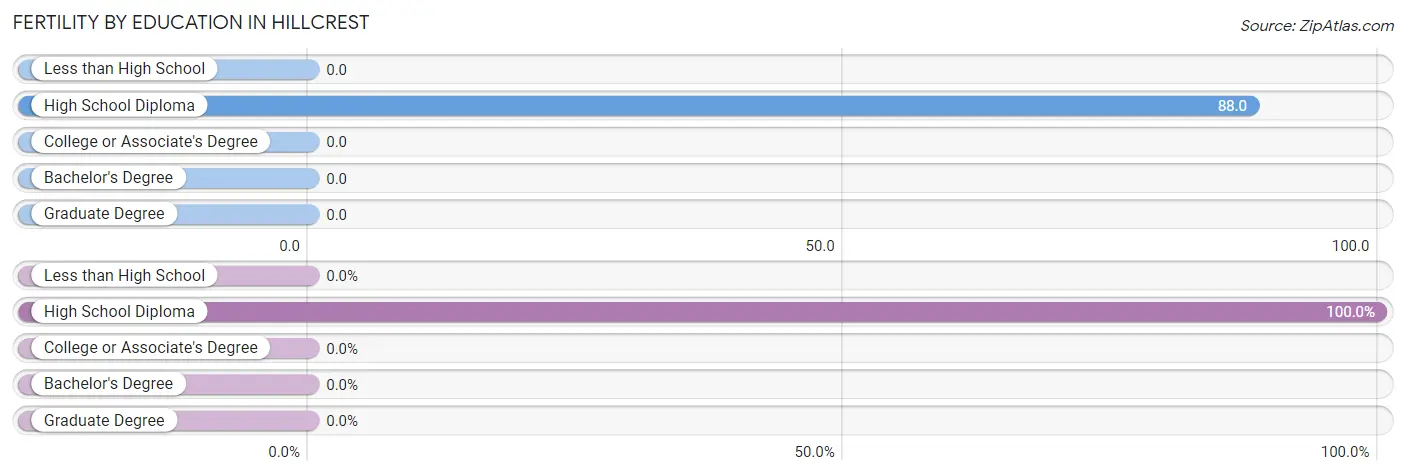
| Educational Attainment | Women with Births | Births / 1,000 Women |
| Less than High School | 0 (0.0%) | 0.0 |
| High School Diploma | 7 (100.0%) | 88.0 |
| College or Associate's Degree | 0 (0.0%) | 0.0 |
| Bachelor's Degree | 0 (0.0%) | 0.0 |
| Graduate Degree | 0 (0.0%) | 0.0 |
| Total | 7 (100.0%) | 18.0 |
Fertility by Education by Marriage Status in Hillcrest
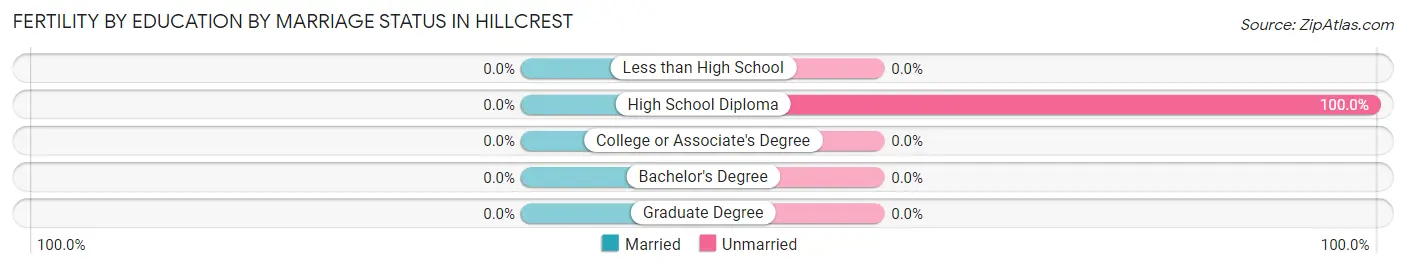
| Educational Attainment | Married | Unmarried |
| Less than High School | 0 (0.0%) | 0 (0.0%) |
| High School Diploma | 0 (0.0%) | 7 (100.0%) |
| College or Associate's Degree | 0 (0.0%) | 0 (0.0%) |
| Bachelor's Degree | 0 (0.0%) | 0 (0.0%) |
| Graduate Degree | 0 (0.0%) | 0 (0.0%) |
| Total | 0 (0.0%) | 7 (100.0%) |
Income in Hillcrest
Income Overview in Hillcrest
Per Capita Income in Hillcrest is $29,394, while median incomes of families and households are $96,087 and $73,750 respectively.
| Characteristic | Number | Measure |
| Per Capita Income | 1,694 | $29,394 |
| Median Family Income | 410 | $96,087 |
| Mean Family Income | 410 | $95,074 |
| Median Household Income | 572 | $73,750 |
| Mean Household Income | 572 | $84,121 |
| Income Deficit | 410 | $0 |
| Wage / Income Gap (%) | 1,694 | 10.41% |
| Wage / Income Gap ($) | 1,694 | 89.59¢ per $1 |
| Gini / Inequality Index | 1,694 | 0.40 |
Earnings by Sex in Hillcrest
Average Earnings in Hillcrest are $34,349, $36,635 for men and $32,823 for women, a difference of 10.4%.
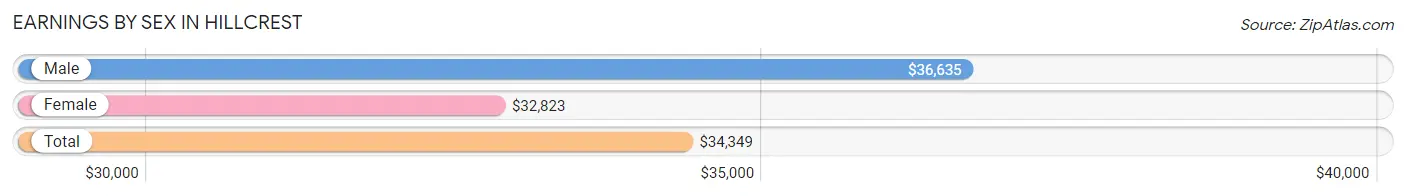
| Sex | Number | Average Earnings |
| Male | 523 (52.0%) | $36,635 |
| Female | 482 (48.0%) | $32,823 |
| Total | 1,005 (100.0%) | $34,349 |
Earnings by Sex by Income Bracket in Hillcrest
The most common earnings brackets in Hillcrest are $30,000 to $34,999 for men (87 | 16.6%) and $25,000 to $29,999 for women (61 | 12.7%).
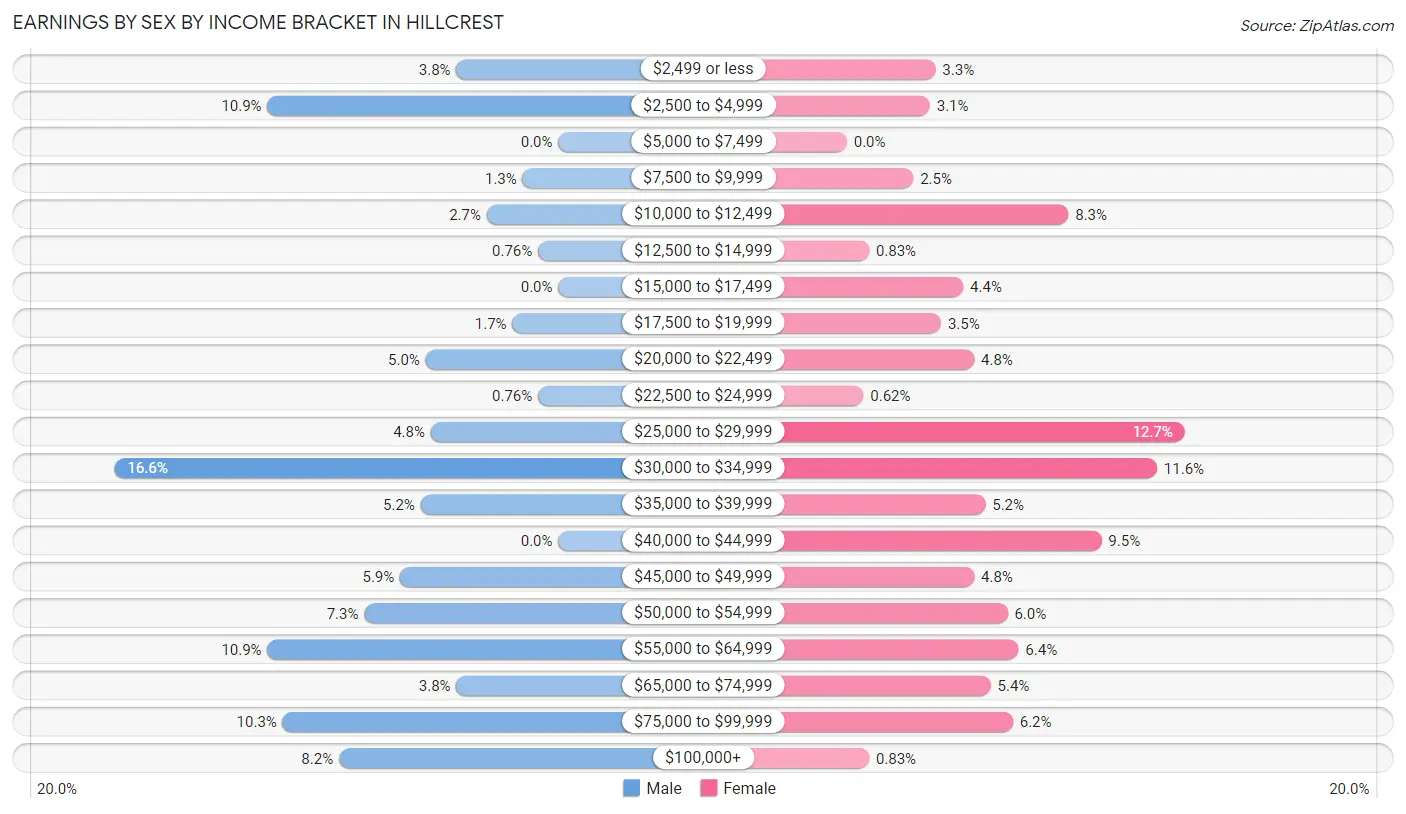
| Income | Male | Female |
| $2,499 or less | 20 (3.8%) | 16 (3.3%) |
| $2,500 to $4,999 | 57 (10.9%) | 15 (3.1%) |
| $5,000 to $7,499 | 0 (0.0%) | 0 (0.0%) |
| $7,500 to $9,999 | 7 (1.3%) | 12 (2.5%) |
| $10,000 to $12,499 | 14 (2.7%) | 40 (8.3%) |
| $12,500 to $14,999 | 4 (0.8%) | 4 (0.8%) |
| $15,000 to $17,499 | 0 (0.0%) | 21 (4.4%) |
| $17,500 to $19,999 | 9 (1.7%) | 17 (3.5%) |
| $20,000 to $22,499 | 26 (5.0%) | 23 (4.8%) |
| $22,500 to $24,999 | 4 (0.8%) | 3 (0.6%) |
| $25,000 to $29,999 | 25 (4.8%) | 61 (12.7%) |
| $30,000 to $34,999 | 87 (16.6%) | 56 (11.6%) |
| $35,000 to $39,999 | 27 (5.2%) | 25 (5.2%) |
| $40,000 to $44,999 | 0 (0.0%) | 46 (9.5%) |
| $45,000 to $49,999 | 31 (5.9%) | 23 (4.8%) |
| $50,000 to $54,999 | 38 (7.3%) | 29 (6.0%) |
| $55,000 to $64,999 | 57 (10.9%) | 31 (6.4%) |
| $65,000 to $74,999 | 20 (3.8%) | 26 (5.4%) |
| $75,000 to $99,999 | 54 (10.3%) | 30 (6.2%) |
| $100,000+ | 43 (8.2%) | 4 (0.8%) |
| Total | 523 (100.0%) | 482 (100.0%) |
Earnings by Sex by Educational Attainment in Hillcrest
Average earnings in Hillcrest are $50,250 for men and $37,500 for women, a difference of 25.4%. Men with an educational attainment of bachelor's degree enjoy the highest average annual earnings of $72,188, while those with high school diploma education earn the least with $37,031. Women with an educational attainment of graduate degree earn the most with the average annual earnings of $77,917, while those with college or associate's degree education have the smallest earnings of $33,315.
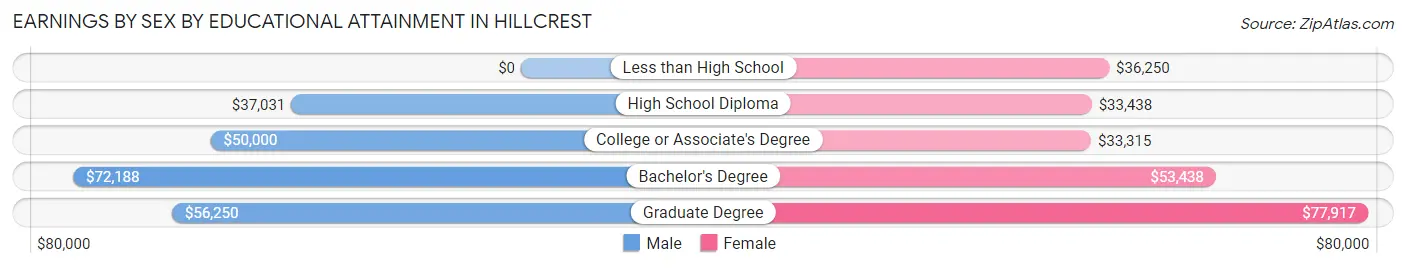
| Educational Attainment | Male Income | Female Income |
| Less than High School | - | - |
| High School Diploma | $37,031 | $33,438 |
| College or Associate's Degree | $50,000 | $33,315 |
| Bachelor's Degree | $72,188 | $53,438 |
| Graduate Degree | $56,250 | $77,917 |
| Total | $50,250 | $37,500 |
Family Income in Hillcrest
Family Income Brackets in Hillcrest
According to the Hillcrest family income data, there are 144 families falling into the $100,000 to $149,999 income range, which is the most common income bracket and makes up 35.1% of all families.
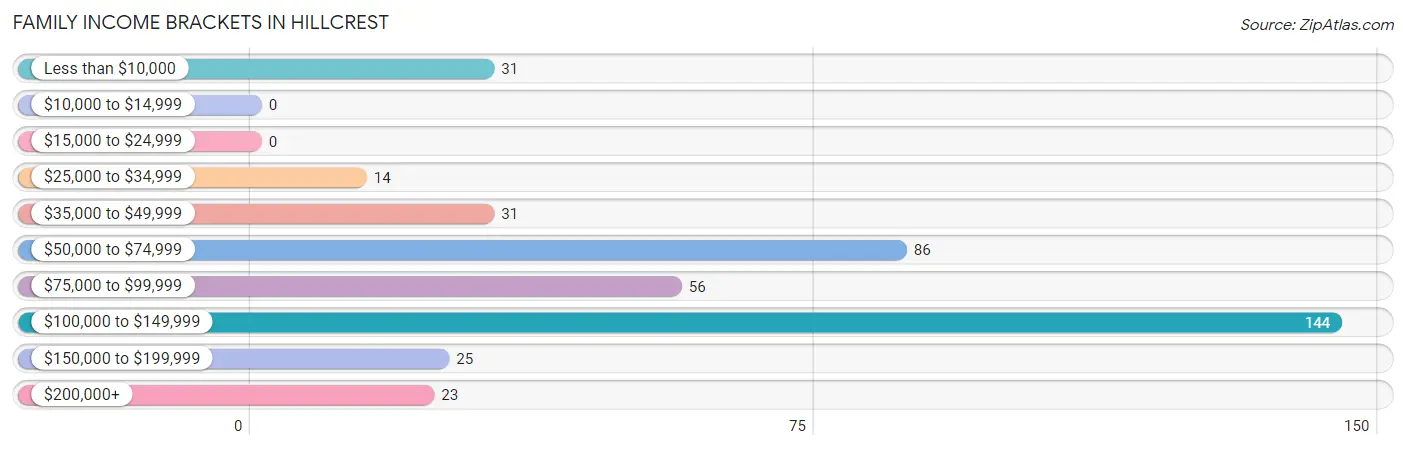
| Income Bracket | # Families | % Families |
| Less than $10,000 | 31 | 7.6% |
| $10,000 to $14,999 | 0 | 0.0% |
| $15,000 to $24,999 | 0 | 0.0% |
| $25,000 to $34,999 | 14 | 3.4% |
| $35,000 to $49,999 | 31 | 7.6% |
| $50,000 to $74,999 | 86 | 21.0% |
| $75,000 to $99,999 | 56 | 13.7% |
| $100,000 to $149,999 | 144 | 35.1% |
| $150,000 to $199,999 | 25 | 6.1% |
| $200,000+ | 23 | 5.6% |
Family Income by Famaliy Size in Hillcrest
6-person families (12 | 2.9%) account for the highest median family income in Hillcrest with $113,750 per family, while 3-person families (95 | 23.2%) have the highest median income of $36,201 per family member.

| Income Bracket | # Families | Median Income |
| 2-Person Families | 151 (36.8%) | $67,614 |
| 3-Person Families | 95 (23.2%) | $108,603 |
| 4-Person Families | 80 (19.5%) | $101,406 |
| 5-Person Families | 63 (15.4%) | $95,461 |
| 6-Person Families | 12 (2.9%) | $113,750 |
| 7+ Person Families | 9 (2.2%) | $0 |
| Total | 410 (100.0%) | $96,087 |
Family Income by Number of Earners in Hillcrest

| Number of Earners | # Families | Median Income |
| No Earners | 48 (11.7%) | $0 |
| 1 Earner | 81 (19.8%) | $57,604 |
| 2 Earners | 178 (43.4%) | $96,413 |
| 3+ Earners | 103 (25.1%) | $108,173 |
| Total | 410 (100.0%) | $96,087 |
Household Income in Hillcrest
Household Income Brackets in Hillcrest
With 150 households falling in the category, the $100,000 to $149,999 income range is the most frequent in Hillcrest, accounting for 26.2% of all households.
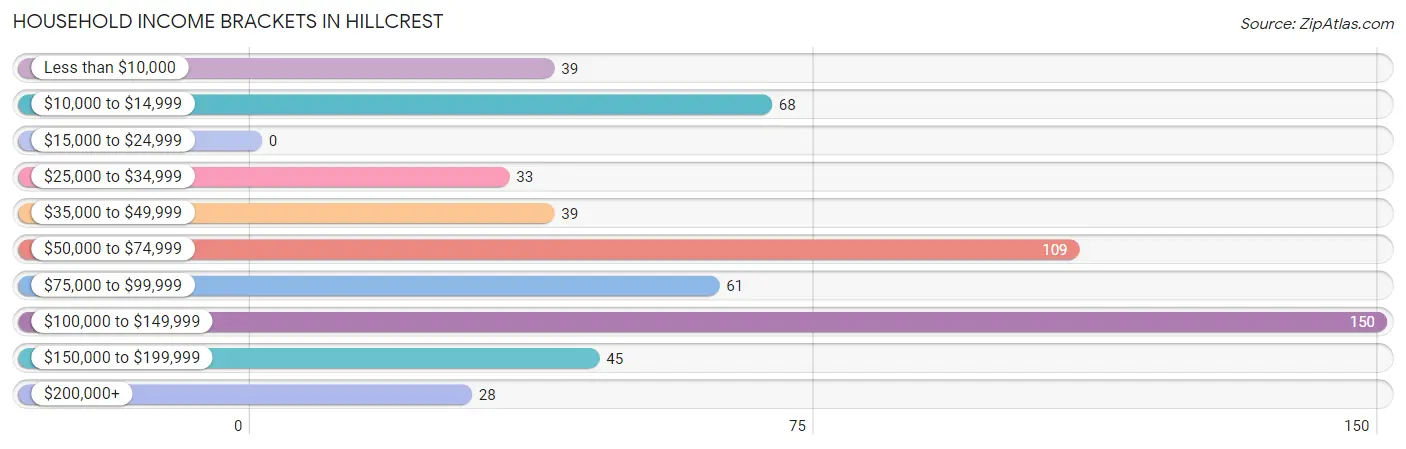
| Income Bracket | # Households | % Households |
| Less than $10,000 | 39 | 6.8% |
| $10,000 to $14,999 | 68 | 11.9% |
| $15,000 to $24,999 | 0 | 0.0% |
| $25,000 to $34,999 | 33 | 5.8% |
| $35,000 to $49,999 | 39 | 6.8% |
| $50,000 to $74,999 | 109 | 19.1% |
| $75,000 to $99,999 | 61 | 10.7% |
| $100,000 to $149,999 | 150 | 26.2% |
| $150,000 to $199,999 | 45 | 7.9% |
| $200,000+ | 28 | 4.9% |
Household Income by Householder Age in Hillcrest
The median household income in Hillcrest is $73,750, with the highest median household income of $96,154 found in the 45 to 64 years age bracket for the primary householder. A total of 254 households (44.4%) fall into this category. Meanwhile, the 15 to 24 years age bracket for the primary householder has the lowest median household income of $0, with 4 households (0.7%) in this group.
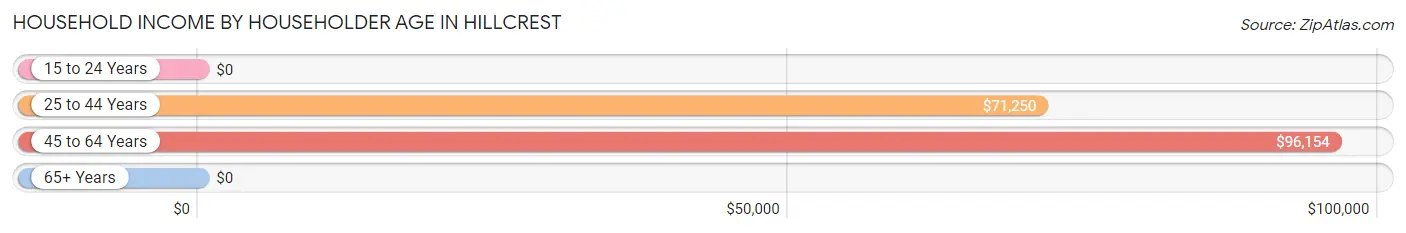
| Income Bracket | # Households | Median Income |
| 15 to 24 Years | 4 (0.7%) | $0 |
| 25 to 44 Years | 160 (28.0%) | $71,250 |
| 45 to 64 Years | 254 (44.4%) | $96,154 |
| 65+ Years | 154 (26.9%) | $0 |
| Total | 572 (100.0%) | $73,750 |
Poverty in Hillcrest
Income Below Poverty by Sex and Age in Hillcrest
With 15.5% poverty level for males and 6.1% for females among the residents of Hillcrest, 15 year old males and 75 year old and over females are the most vulnerable to poverty, with 6 males (54.5%) and 2 females (22.2%) in their respective age groups living below the poverty level.
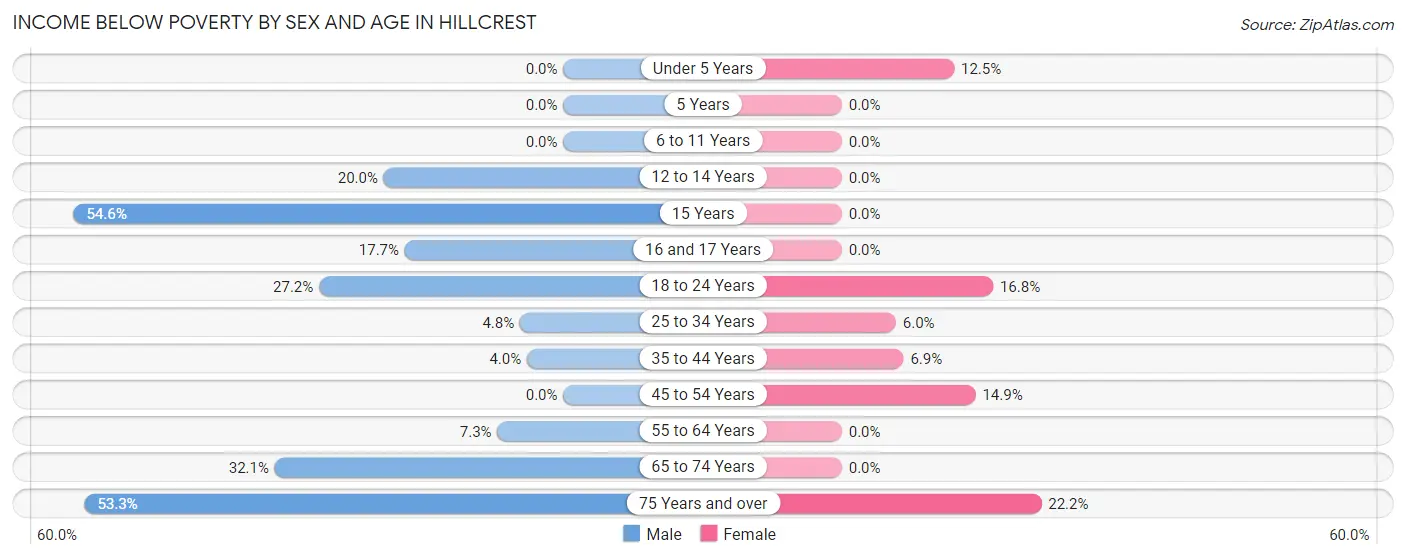
| Age Bracket | Male | Female |
| Under 5 Years | 0 (0.0%) | 5 (12.5%) |
| 5 Years | 0 (0.0%) | 0 (0.0%) |
| 6 to 11 Years | 0 (0.0%) | 0 (0.0%) |
| 12 to 14 Years | 5 (20.0%) | 0 (0.0%) |
| 15 Years | 6 (54.5%) | 0 (0.0%) |
| 16 and 17 Years | 6 (17.6%) | 0 (0.0%) |
| 18 to 24 Years | 34 (27.2%) | 16 (16.8%) |
| 25 to 34 Years | 4 (4.8%) | 5 (6.0%) |
| 35 to 44 Years | 4 (4.0%) | 9 (6.9%) |
| 45 to 54 Years | 0 (0.0%) | 14 (14.9%) |
| 55 to 64 Years | 8 (7.3%) | 0 (0.0%) |
| 65 to 74 Years | 54 (32.1%) | 0 (0.0%) |
| 75 Years and over | 8 (53.3%) | 2 (22.2%) |
| Total | 129 (15.5%) | 51 (6.1%) |
Income Above Poverty by Sex and Age in Hillcrest
According to the poverty statistics in Hillcrest, males aged under 5 years and females aged 5 years are the age groups that are most secure financially, with 100.0% of males and 100.0% of females in these age groups living above the poverty line.
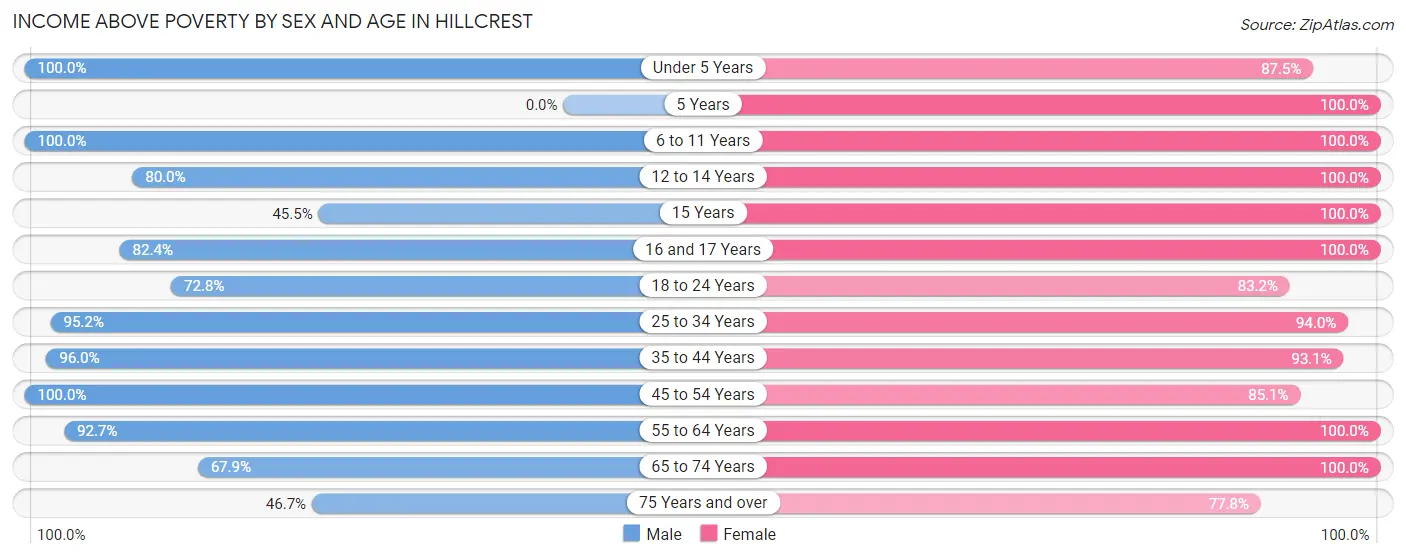
| Age Bracket | Male | Female |
| Under 5 Years | 22 (100.0%) | 35 (87.5%) |
| 5 Years | 0 (0.0%) | 25 (100.0%) |
| 6 to 11 Years | 78 (100.0%) | 108 (100.0%) |
| 12 to 14 Years | 20 (80.0%) | 47 (100.0%) |
| 15 Years | 5 (45.5%) | 3 (100.0%) |
| 16 and 17 Years | 28 (82.4%) | 14 (100.0%) |
| 18 to 24 Years | 91 (72.8%) | 79 (83.2%) |
| 25 to 34 Years | 79 (95.2%) | 78 (94.0%) |
| 35 to 44 Years | 95 (96.0%) | 122 (93.1%) |
| 45 to 54 Years | 65 (100.0%) | 80 (85.1%) |
| 55 to 64 Years | 101 (92.7%) | 128 (100.0%) |
| 65 to 74 Years | 114 (67.9%) | 55 (100.0%) |
| 75 Years and over | 7 (46.7%) | 7 (77.8%) |
| Total | 705 (84.5%) | 781 (93.9%) |
Income Below Poverty Among Married-Couple Families in Hillcrest
The poverty statistics for married-couple families in Hillcrest show that 6.1% or 17 of the total 280 families live below the poverty line. Families with no children have the highest poverty rate of 9.6%, comprising of 13 families. On the other hand, families with 3 or 4 children have the lowest poverty rate of 0.0%, which includes 0 families.
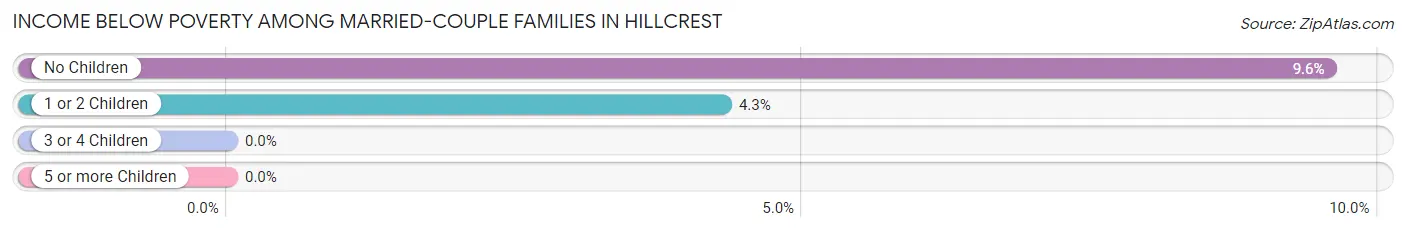
| Children | Above Poverty | Below Poverty |
| No Children | 123 (90.4%) | 13 (9.6%) |
| 1 or 2 Children | 89 (95.7%) | 4 (4.3%) |
| 3 or 4 Children | 46 (100.0%) | 0 (0.0%) |
| 5 or more Children | 5 (100.0%) | 0 (0.0%) |
| Total | 263 (93.9%) | 17 (6.1%) |
Income Below Poverty Among Single-Parent Households in Hillcrest
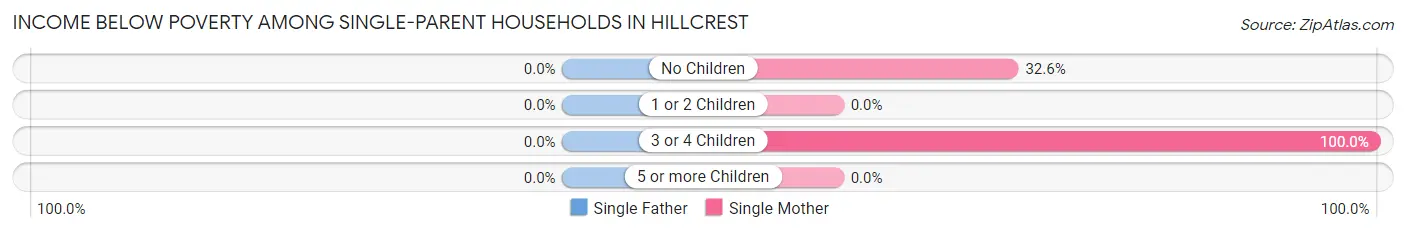
| Children | Single Father | Single Mother |
| No Children | 0 (0.0%) | 14 (32.6%) |
| 1 or 2 Children | 0 (0.0%) | 0 (0.0%) |
| 3 or 4 Children | 0 (0.0%) | 5 (100.0%) |
| 5 or more Children | 0 (0.0%) | 0 (0.0%) |
| Total | 0 (0.0%) | 19 (17.6%) |
Income Below Poverty Among Married-Couple vs Single-Parent Households in Hillcrest
The poverty data for Hillcrest shows that 17 of the married-couple family households (6.1%) and 19 of the single-parent households (14.6%) are living below the poverty level. Within the married-couple family households, those with no children have the highest poverty rate, with 13 households (9.6%) falling below the poverty line. Among the single-parent households, those with 3 or 4 children have the highest poverty rate, with 5 household (100.0%) living below poverty.
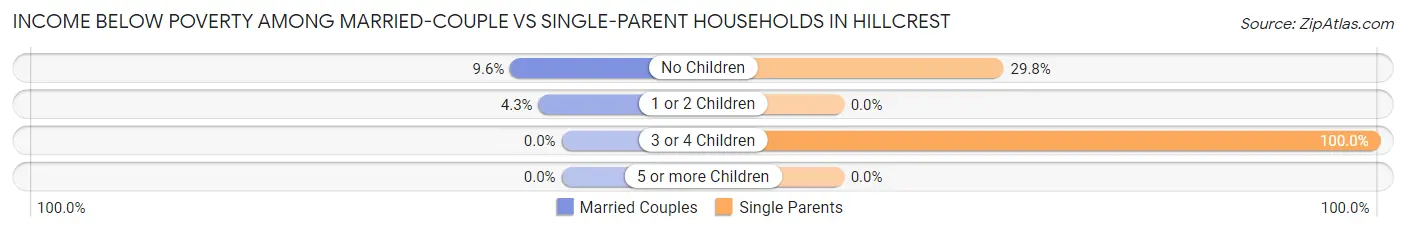
| Children | Married-Couple Families | Single-Parent Households |
| No Children | 13 (9.6%) | 14 (29.8%) |
| 1 or 2 Children | 4 (4.3%) | 0 (0.0%) |
| 3 or 4 Children | 0 (0.0%) | 5 (100.0%) |
| 5 or more Children | 0 (0.0%) | 0 (0.0%) |
| Total | 17 (6.1%) | 19 (14.6%) |
Employment Characteristics in Hillcrest
Employment by Class of Employer in Hillcrest
Among the 864 employed individuals in Hillcrest, private company employees (565 | 65.4%), local government employees (107 | 12.4%), and self-employed (not incorporated) (95 | 11.0%) make up the most common classes of employment.
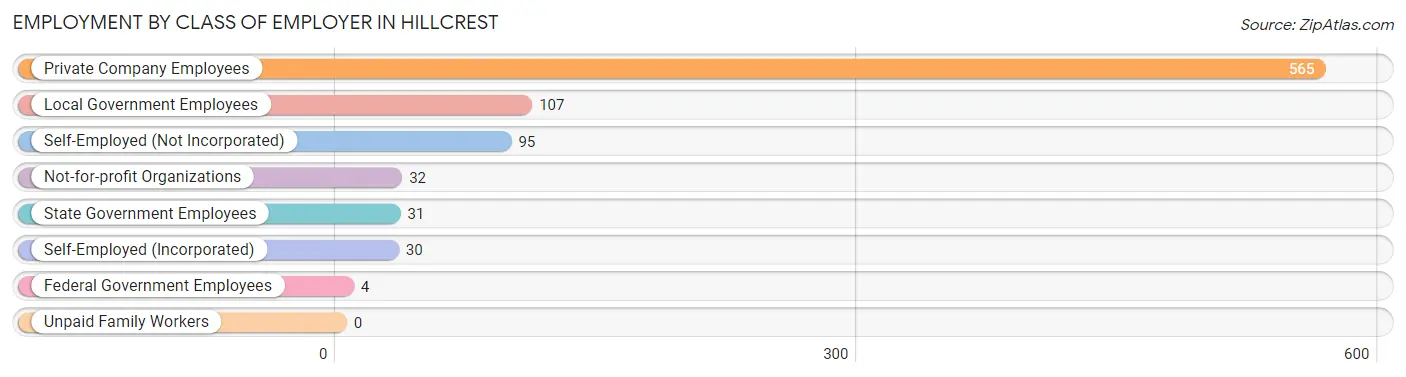
| Employer Class | # Employees | % Employees |
| Private Company Employees | 565 | 65.4% |
| Self-Employed (Incorporated) | 30 | 3.5% |
| Self-Employed (Not Incorporated) | 95 | 11.0% |
| Not-for-profit Organizations | 32 | 3.7% |
| Local Government Employees | 107 | 12.4% |
| State Government Employees | 31 | 3.6% |
| Federal Government Employees | 4 | 0.5% |
| Unpaid Family Workers | 0 | 0.0% |
| Total | 864 | 100.0% |
Employment Status by Age in Hillcrest
According to the labor force statistics for Hillcrest, out of the total population over 16 years of age (1,307), 72.4% or 946 individuals are in the labor force, with 5.4% or 51 of them unemployed. The age group with the highest labor force participation rate is 35 to 44 years, with 93.0% or 214 individuals in the labor force. Within the labor force, the 25 to 29 years age range has the highest percentage of unemployed individuals, with 19.6% or 9 of them being unemployed.
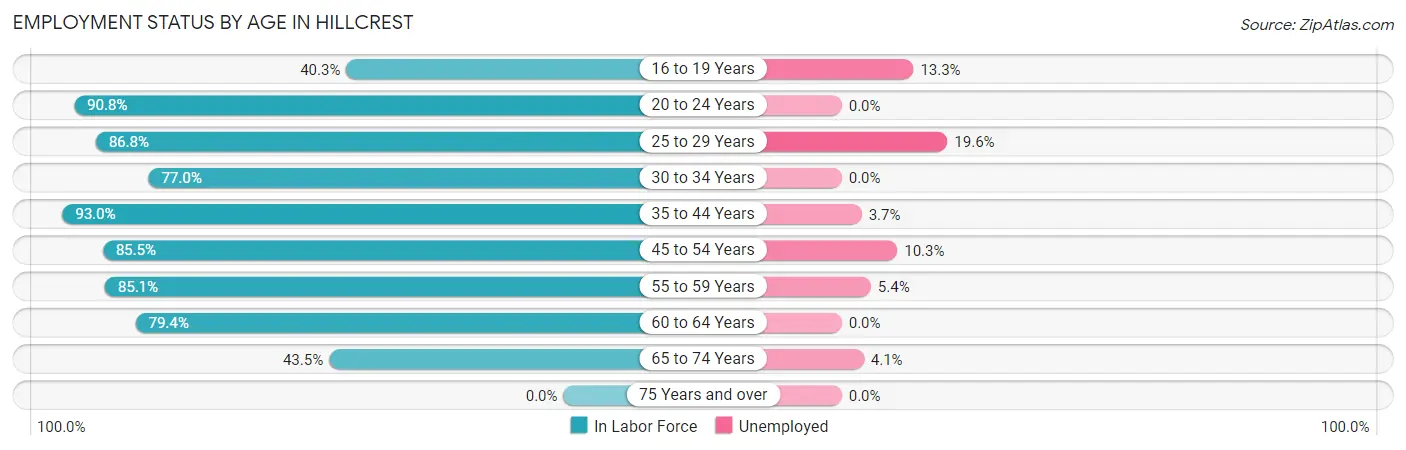
| Age Bracket | In Labor Force | Unemployed |
| 16 to 19 Years | 60 (40.3%) | 8 (13.3%) |
| 20 to 24 Years | 108 (90.8%) | 0 (0.0%) |
| 25 to 29 Years | 46 (86.8%) | 9 (19.6%) |
| 30 to 34 Years | 87 (77.0%) | 0 (0.0%) |
| 35 to 44 Years | 214 (93.0%) | 8 (3.7%) |
| 45 to 54 Years | 136 (85.5%) | 14 (10.3%) |
| 55 to 59 Years | 148 (85.1%) | 8 (5.4%) |
| 60 to 64 Years | 50 (79.4%) | 0 (0.0%) |
| 65 to 74 Years | 97 (43.5%) | 4 (4.1%) |
| 75 Years and over | 0 (0.0%) | 0 (0.0%) |
| Total | 946 (72.4%) | 51 (5.4%) |
Employment Status by Educational Attainment in Hillcrest
According to labor force statistics for Hillcrest, 86.0% of individuals (681) out of the total population between 25 and 64 years of age (792) are in the labor force, with 5.7% or 39 of them being unemployed. The group with the highest labor force participation rate are those with the educational attainment of high school diploma, with 91.4% or 244 individuals in the labor force. Within the labor force, individuals with high school diploma education have the highest percentage of unemployment, with 8.6% or 21 of them being unemployed.
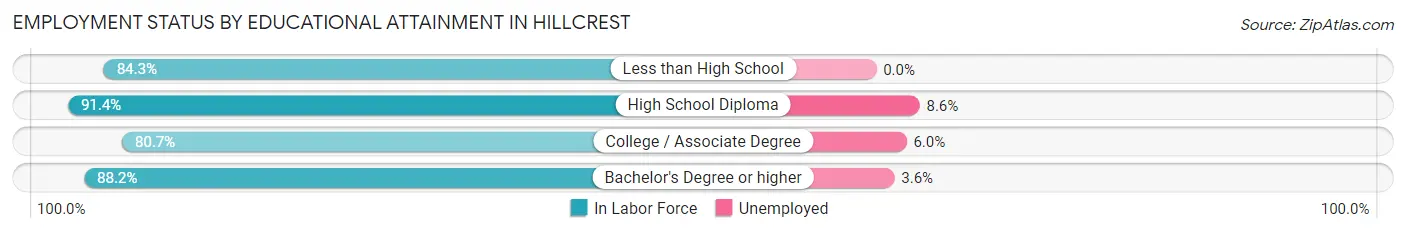
| Educational Attainment | In Labor Force | Unemployed |
| Less than High School | 91 (84.3%) | 0 (0.0%) |
| High School Diploma | 244 (91.4%) | 23 (8.6%) |
| College / Associate Degree | 234 (80.7%) | 17 (6.0%) |
| Bachelor's Degree or higher | 112 (88.2%) | 5 (3.6%) |
| Total | 681 (86.0%) | 45 (5.7%) |
Employment Occupations by Sex in Hillcrest
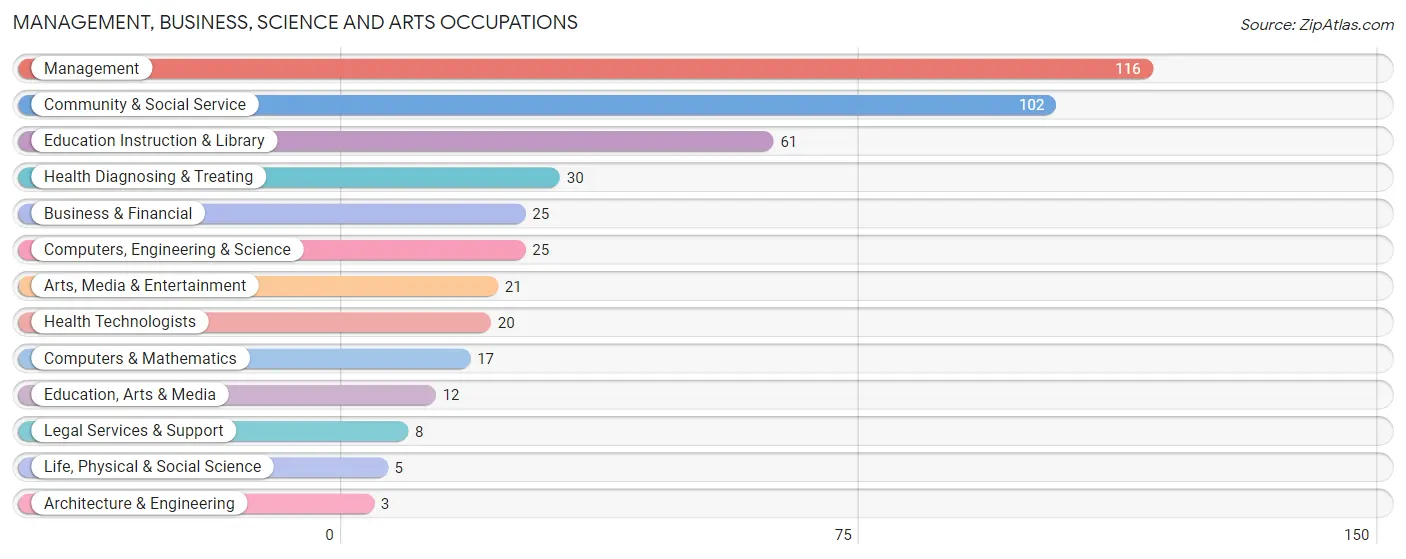
Management, Business, Science and Arts Occupations
The most common Management, Business, Science and Arts occupations in Hillcrest are Management (116 | 13.0%), Community & Social Service (102 | 11.4%), Education Instruction & Library (61 | 6.8%), Health Diagnosing & Treating (30 | 3.4%), and Business & Financial (25 | 2.8%).
Management, Business, Science and Arts Occupations by Sex
Within the Management, Business, Science and Arts occupations in Hillcrest, the most male-oriented occupations are Architecture & Engineering (100.0%), Life, Physical & Social Science (100.0%), and Legal Services & Support (100.0%), while the most female-oriented occupations are Arts, Media & Entertainment (100.0%), Health Diagnosing & Treating (100.0%), and Health Technologists (100.0%).
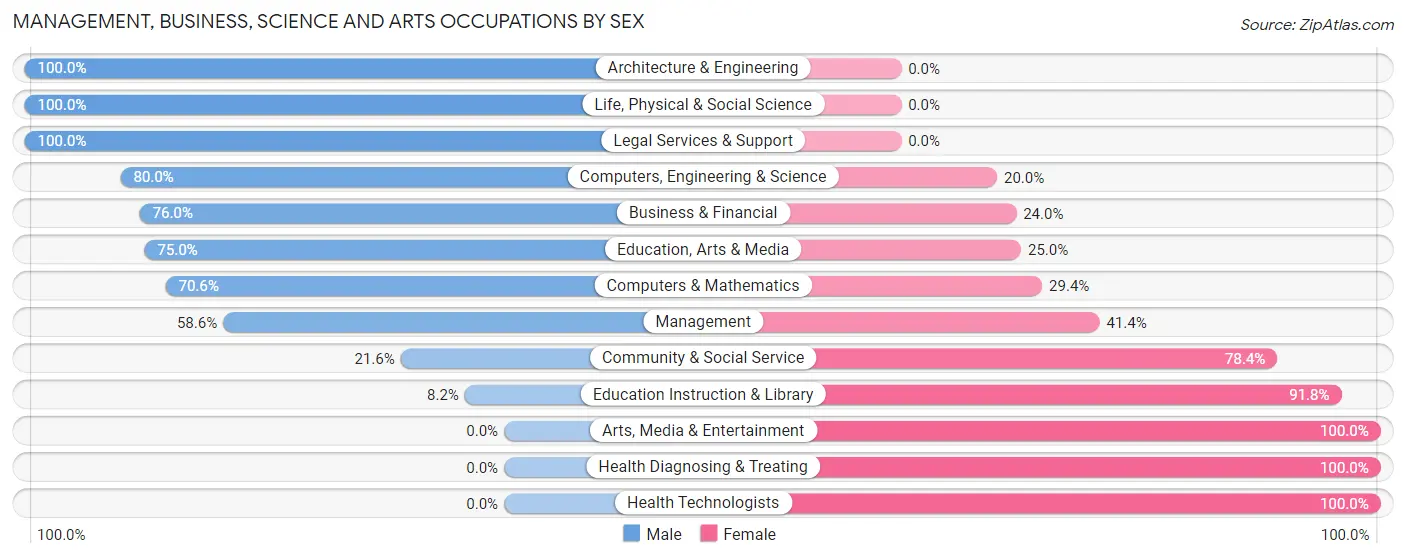
| Occupation | Male | Female |
| Management | 68 (58.6%) | 48 (41.4%) |
| Business & Financial | 19 (76.0%) | 6 (24.0%) |
| Computers, Engineering & Science | 20 (80.0%) | 5 (20.0%) |
| Computers & Mathematics | 12 (70.6%) | 5 (29.4%) |
| Architecture & Engineering | 3 (100.0%) | 0 (0.0%) |
| Life, Physical & Social Science | 5 (100.0%) | 0 (0.0%) |
| Community & Social Service | 22 (21.6%) | 80 (78.4%) |
| Education, Arts & Media | 9 (75.0%) | 3 (25.0%) |
| Legal Services & Support | 8 (100.0%) | 0 (0.0%) |
| Education Instruction & Library | 5 (8.2%) | 56 (91.8%) |
| Arts, Media & Entertainment | 0 (0.0%) | 21 (100.0%) |
| Health Diagnosing & Treating | 0 (0.0%) | 30 (100.0%) |
| Health Technologists | 0 (0.0%) | 20 (100.0%) |
| Total (Category) | 129 (43.3%) | 169 (56.7%) |
| Total (Overall) | 460 (51.4%) | 435 (48.6%) |
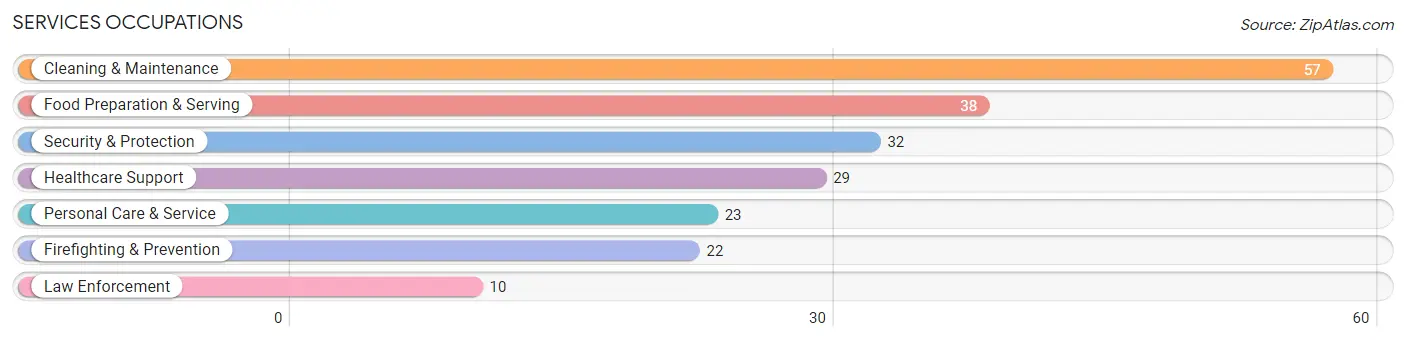
Services Occupations
The most common Services occupations in Hillcrest are Cleaning & Maintenance (57 | 6.4%), Food Preparation & Serving (38 | 4.3%), Security & Protection (32 | 3.6%), Healthcare Support (29 | 3.2%), and Personal Care & Service (23 | 2.6%).
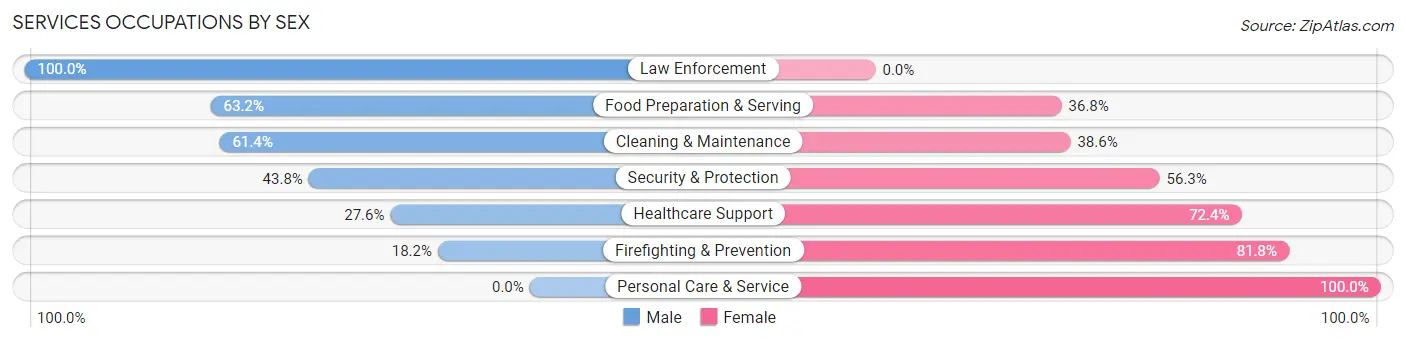
Services Occupations by Sex
Within the Services occupations in Hillcrest, the most male-oriented occupations are Law Enforcement (100.0%), Food Preparation & Serving (63.2%), and Cleaning & Maintenance (61.4%), while the most female-oriented occupations are Personal Care & Service (100.0%), Firefighting & Prevention (81.8%), and Healthcare Support (72.4%).
| Occupation | Male | Female |
| Healthcare Support | 8 (27.6%) | 21 (72.4%) |
| Security & Protection | 14 (43.8%) | 18 (56.2%) |
| Firefighting & Prevention | 4 (18.2%) | 18 (81.8%) |
| Law Enforcement | 10 (100.0%) | 0 (0.0%) |
| Food Preparation & Serving | 24 (63.2%) | 14 (36.8%) |
| Cleaning & Maintenance | 35 (61.4%) | 22 (38.6%) |
| Personal Care & Service | 0 (0.0%) | 23 (100.0%) |
| Total (Category) | 81 (45.3%) | 98 (54.7%) |
| Total (Overall) | 460 (51.4%) | 435 (48.6%) |
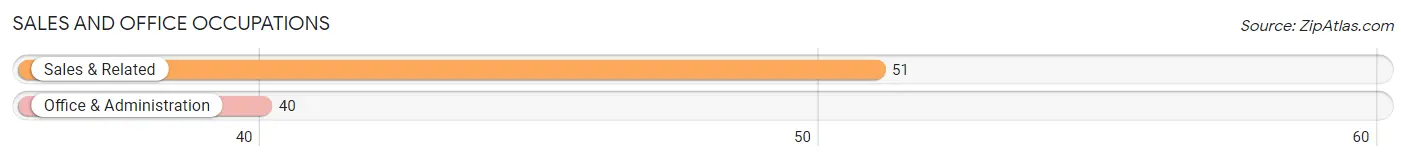
Sales and Office Occupations
The most common Sales and Office occupations in Hillcrest are Sales & Related (51 | 5.7%), and Office & Administration (40 | 4.5%).
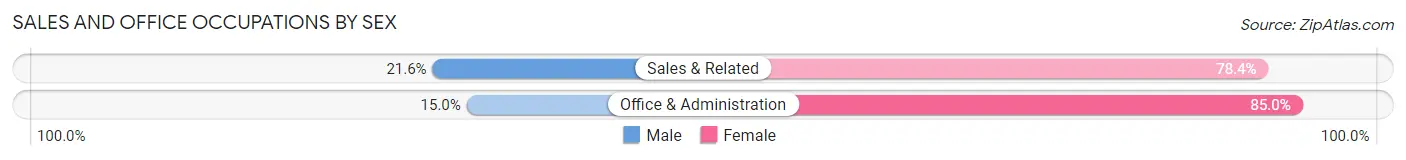
Sales and Office Occupations by Sex
| Occupation | Male | Female |
| Sales & Related | 11 (21.6%) | 40 (78.4%) |
| Office & Administration | 6 (15.0%) | 34 (85.0%) |
| Total (Category) | 17 (18.7%) | 74 (81.3%) |
| Total (Overall) | 460 (51.4%) | 435 (48.6%) |
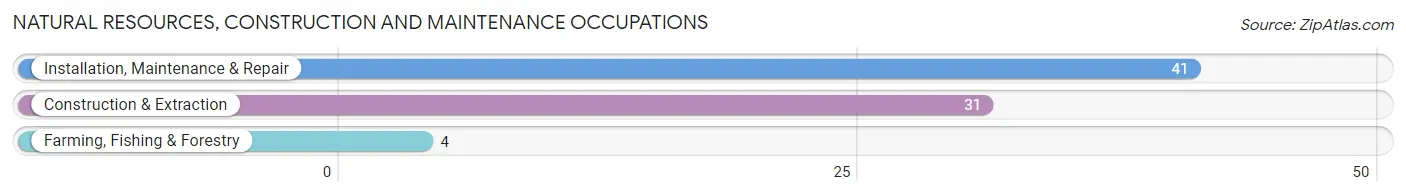
Natural Resources, Construction and Maintenance Occupations
The most common Natural Resources, Construction and Maintenance occupations in Hillcrest are Installation, Maintenance & Repair (41 | 4.6%), Construction & Extraction (31 | 3.5%), and Farming, Fishing & Forestry (4 | 0.4%).
Natural Resources, Construction and Maintenance Occupations by Sex
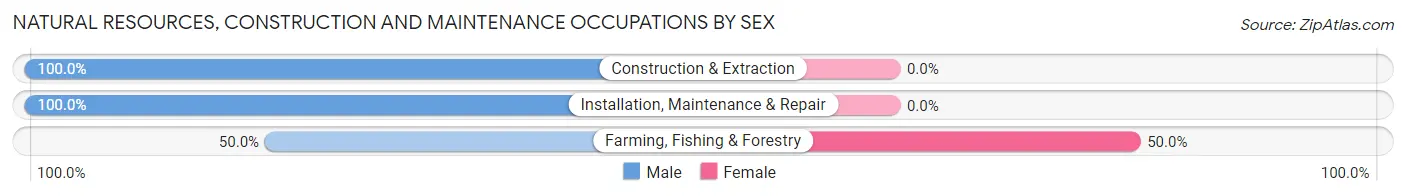
| Occupation | Male | Female |
| Farming, Fishing & Forestry | 2 (50.0%) | 2 (50.0%) |
| Construction & Extraction | 31 (100.0%) | 0 (0.0%) |
| Installation, Maintenance & Repair | 41 (100.0%) | 0 (0.0%) |
| Total (Category) | 74 (97.4%) | 2 (2.6%) |
| Total (Overall) | 460 (51.4%) | 435 (48.6%) |
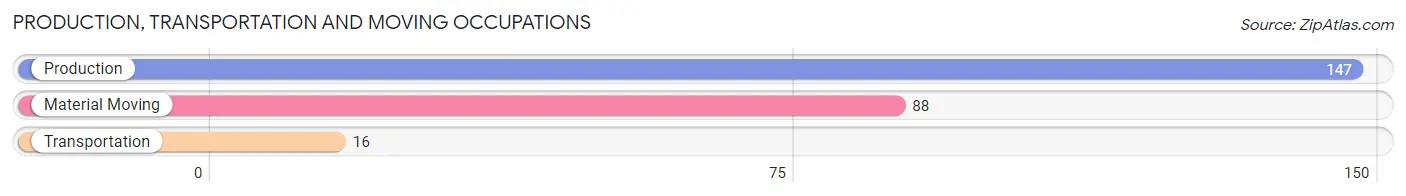
Production, Transportation and Moving Occupations
The most common Production, Transportation and Moving occupations in Hillcrest are Production (147 | 16.4%), Material Moving (88 | 9.8%), and Transportation (16 | 1.8%).
Production, Transportation and Moving Occupations by Sex
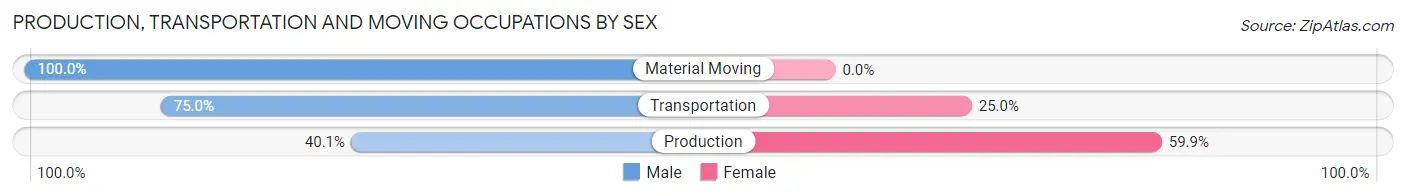
| Occupation | Male | Female |
| Production | 59 (40.1%) | 88 (59.9%) |
| Transportation | 12 (75.0%) | 4 (25.0%) |
| Material Moving | 88 (100.0%) | 0 (0.0%) |
| Total (Category) | 159 (63.3%) | 92 (36.6%) |
| Total (Overall) | 460 (51.4%) | 435 (48.6%) |
Employment Industries by Sex in Hillcrest
Employment Industries in Hillcrest
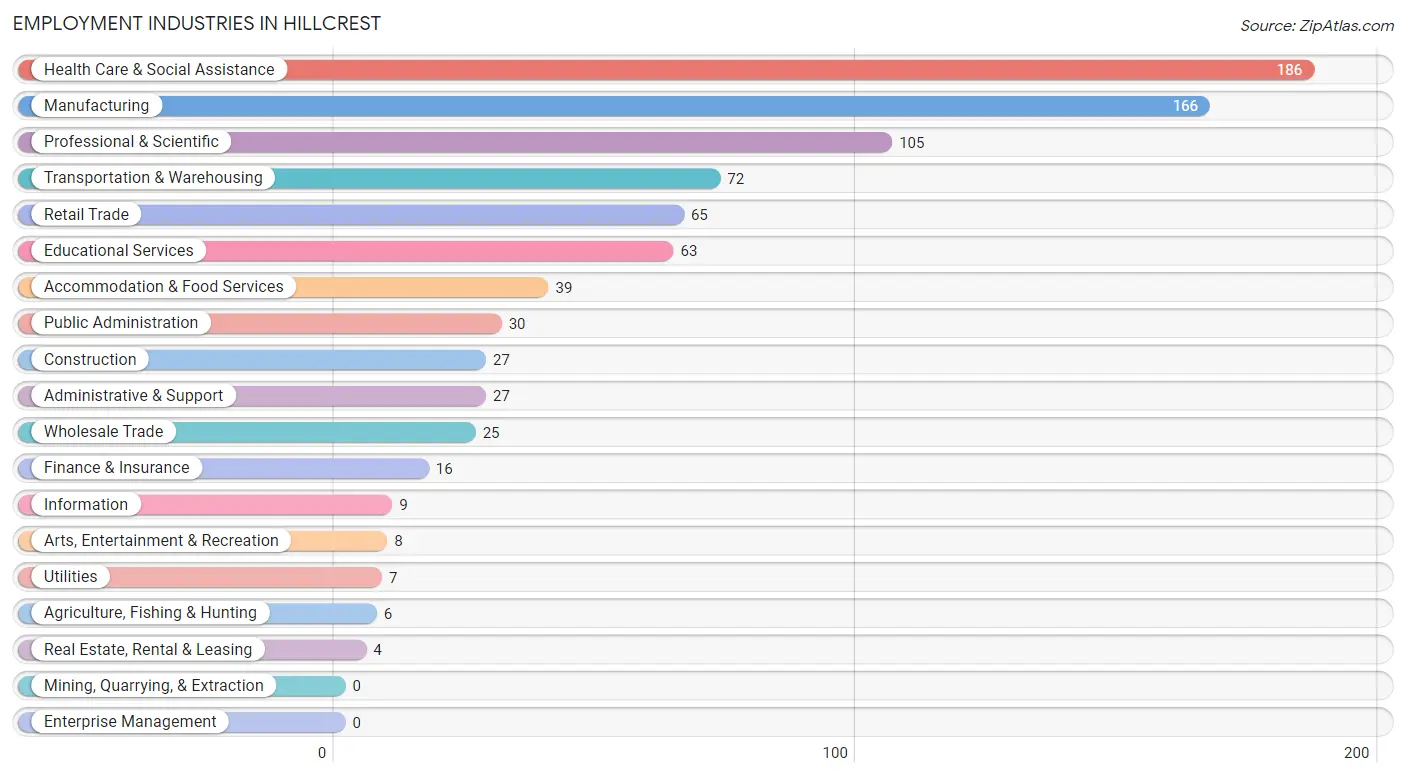
The major employment industries in Hillcrest include Health Care & Social Assistance (186 | 20.8%), Manufacturing (166 | 18.5%), Professional & Scientific (105 | 11.7%), Transportation & Warehousing (72 | 8.0%), and Retail Trade (65 | 7.3%).
Employment Industries by Sex in Hillcrest
The Hillcrest industries that see more men than women are Construction (100.0%), Utilities (100.0%), and Transportation & Warehousing (88.9%), whereas the industries that tend to have a higher number of women are Finance & Insurance (100.0%), Real Estate, Rental & Leasing (100.0%), and Administrative & Support (85.2%).
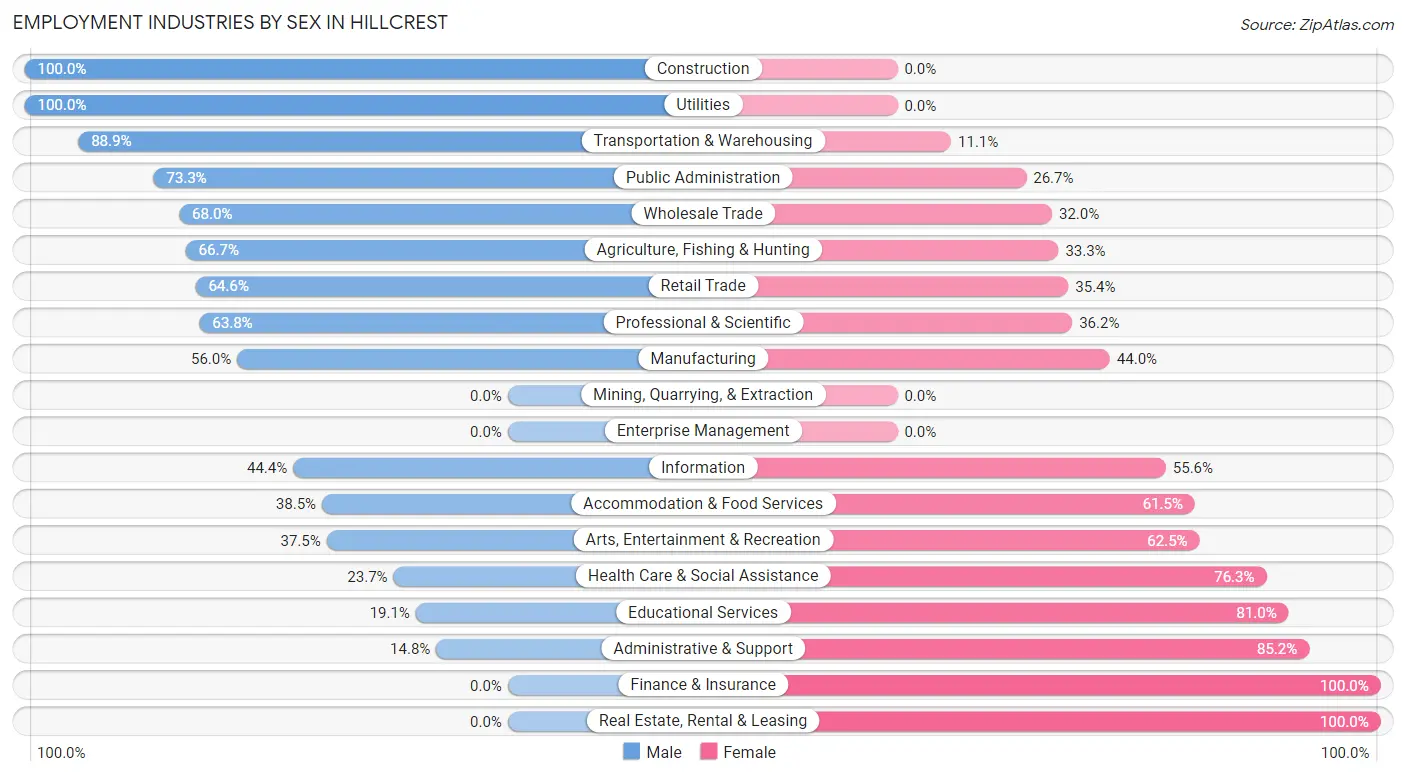
| Industry | Male | Female |
| Agriculture, Fishing & Hunting | 4 (66.7%) | 2 (33.3%) |
| Mining, Quarrying, & Extraction | 0 (0.0%) | 0 (0.0%) |
| Construction | 27 (100.0%) | 0 (0.0%) |
| Manufacturing | 93 (56.0%) | 73 (44.0%) |
| Wholesale Trade | 17 (68.0%) | 8 (32.0%) |
| Retail Trade | 42 (64.6%) | 23 (35.4%) |
| Transportation & Warehousing | 64 (88.9%) | 8 (11.1%) |
| Utilities | 7 (100.0%) | 0 (0.0%) |
| Information | 4 (44.4%) | 5 (55.6%) |
| Finance & Insurance | 0 (0.0%) | 16 (100.0%) |
| Real Estate, Rental & Leasing | 0 (0.0%) | 4 (100.0%) |
| Professional & Scientific | 67 (63.8%) | 38 (36.2%) |
| Enterprise Management | 0 (0.0%) | 0 (0.0%) |
| Administrative & Support | 4 (14.8%) | 23 (85.2%) |
| Educational Services | 12 (19.1%) | 51 (80.9%) |
| Health Care & Social Assistance | 44 (23.7%) | 142 (76.3%) |
| Arts, Entertainment & Recreation | 3 (37.5%) | 5 (62.5%) |
| Accommodation & Food Services | 15 (38.5%) | 24 (61.5%) |
| Public Administration | 22 (73.3%) | 8 (26.7%) |
| Total | 460 (51.4%) | 435 (48.6%) |
Education in Hillcrest
School Enrollment in Hillcrest
The most common levels of schooling among the 562 students in Hillcrest are high school (162 | 28.8%), elementary school (142 | 25.3%), and middle school (104 | 18.5%).
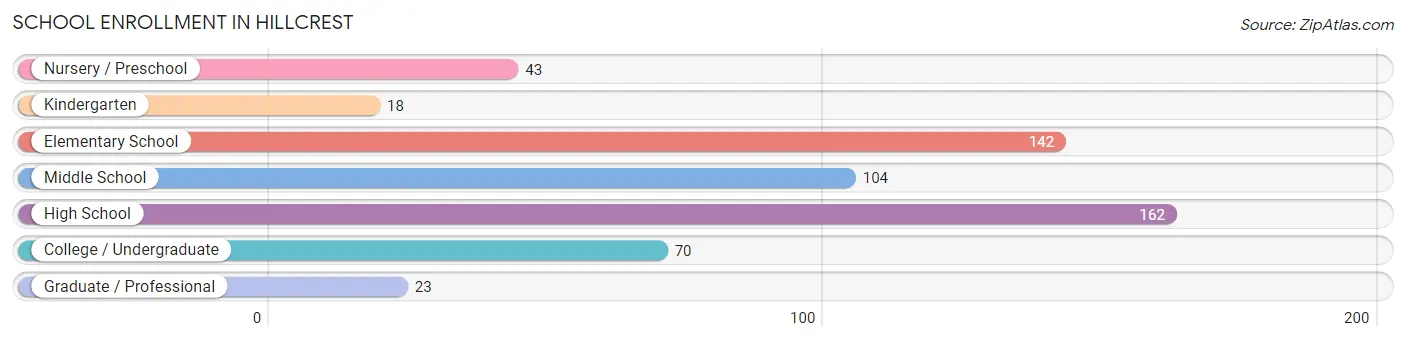
| School Level | # Students | % Students |
| Nursery / Preschool | 43 | 7.6% |
| Kindergarten | 18 | 3.2% |
| Elementary School | 142 | 25.3% |
| Middle School | 104 | 18.5% |
| High School | 162 | 28.8% |
| College / Undergraduate | 70 | 12.5% |
| Graduate / Professional | 23 | 4.1% |
| Total | 562 | 100.0% |
School Enrollment by Age by Funding Source in Hillcrest
Out of a total of 562 students who are enrolled in schools in Hillcrest, 70 (12.5%) attend a private institution, while the remaining 492 (87.5%) are enrolled in public schools. The age group of 35 years and over has the highest likelihood of being enrolled in private schools, with 12 (41.4% in the age bracket) enrolled. Conversely, the age group of 25 to 34 year olds has the lowest likelihood of being enrolled in a private school, with 11 (100.0% in the age bracket) attending a public institution.
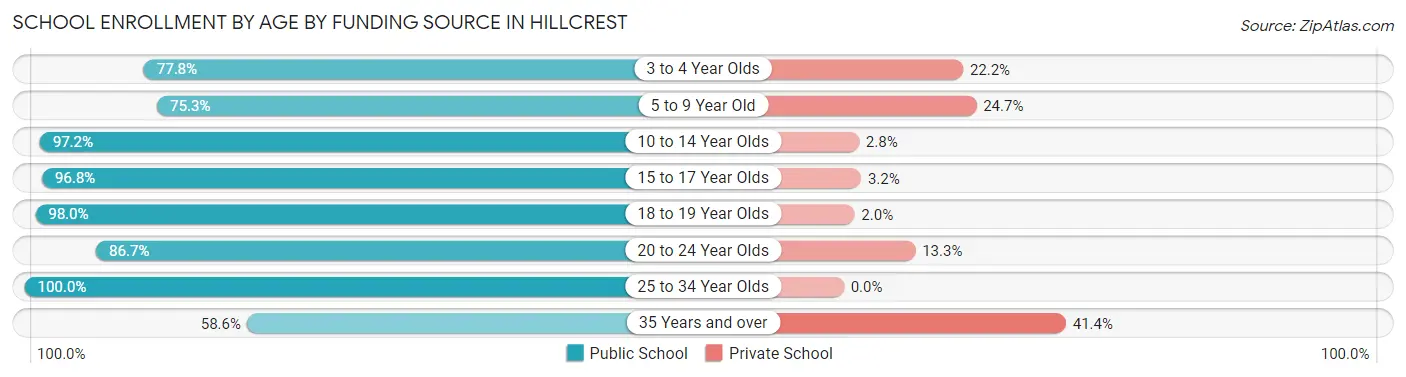
| Age Bracket | Public School | Private School |
| 3 to 4 Year Olds | 21 (77.8%) | 6 (22.2%) |
| 5 to 9 Year Old | 122 (75.3%) | 40 (24.7%) |
| 10 to 14 Year Olds | 137 (97.2%) | 4 (2.8%) |
| 15 to 17 Year Olds | 60 (96.8%) | 2 (3.2%) |
| 18 to 19 Year Olds | 98 (98.0%) | 2 (2.0%) |
| 20 to 24 Year Olds | 26 (86.7%) | 4 (13.3%) |
| 25 to 34 Year Olds | 11 (100.0%) | 0 (0.0%) |
| 35 Years and over | 17 (58.6%) | 12 (41.4%) |
| Total | 492 (87.5%) | 70 (12.5%) |
Educational Attainment by Field of Study in Hillcrest
Education (36 | 23.5%), science & technology (34 | 22.2%), business (30 | 19.6%), arts & humanities (15 | 9.8%), and liberal arts & history (9 | 5.9%) are the most common fields of study among 153 individuals in Hillcrest who have obtained a bachelor's degree or higher.
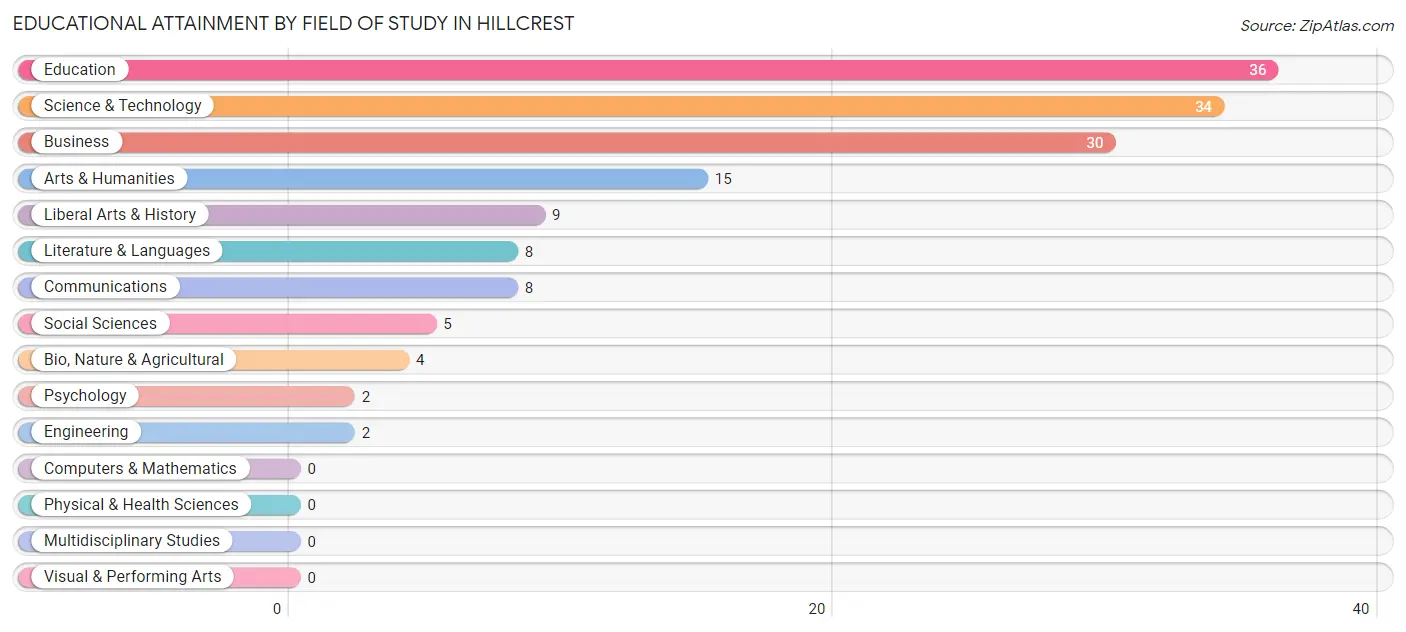
| Field of Study | # Graduates | % Graduates |
| Computers & Mathematics | 0 | 0.0% |
| Bio, Nature & Agricultural | 4 | 2.6% |
| Physical & Health Sciences | 0 | 0.0% |
| Psychology | 2 | 1.3% |
| Social Sciences | 5 | 3.3% |
| Engineering | 2 | 1.3% |
| Multidisciplinary Studies | 0 | 0.0% |
| Science & Technology | 34 | 22.2% |
| Business | 30 | 19.6% |
| Education | 36 | 23.5% |
| Literature & Languages | 8 | 5.2% |
| Liberal Arts & History | 9 | 5.9% |
| Visual & Performing Arts | 0 | 0.0% |
| Communications | 8 | 5.2% |
| Arts & Humanities | 15 | 9.8% |
| Total | 153 | 100.0% |
Transportation & Commute in Hillcrest
Vehicle Availability by Sex in Hillcrest
The most prevalent vehicle ownership categories in Hillcrest are males with 2 vehicles (277, accounting for 60.2%) and females with 2 vehicles (236, making up 68.6%).
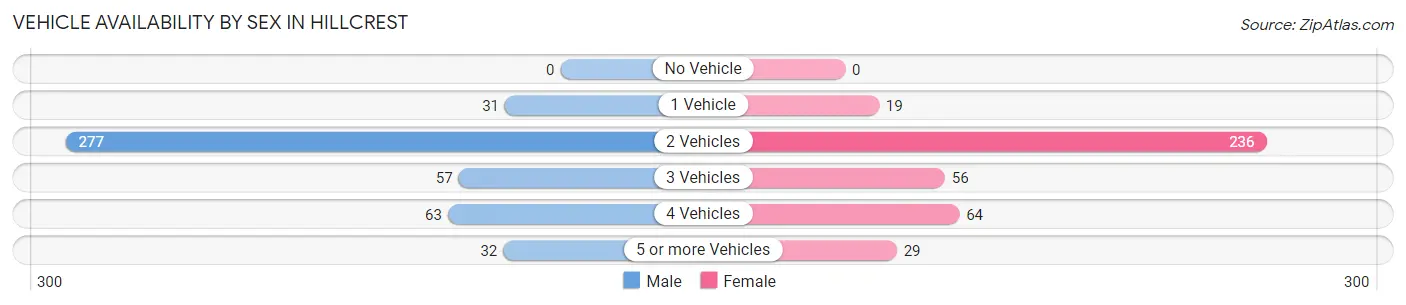
| Vehicles Available | Male | Female |
| No Vehicle | 0 (0.0%) | 0 (0.0%) |
| 1 Vehicle | 31 (6.7%) | 19 (4.7%) |
| 2 Vehicles | 277 (60.2%) | 236 (58.4%) |
| 3 Vehicles | 57 (12.4%) | 56 (13.9%) |
| 4 Vehicles | 63 (13.7%) | 64 (15.8%) |
| 5 or more Vehicles | 32 (7.0%) | 29 (7.2%) |
| Total | 460 (100.0%) | 404 (100.0%) |
Commute Time in Hillcrest
The most frequently occuring commute durations in Hillcrest are 5 to 9 minutes (207 commuters, 26.7%), 10 to 14 minutes (190 commuters, 24.5%), and 25 to 29 minutes (79 commuters, 10.2%).
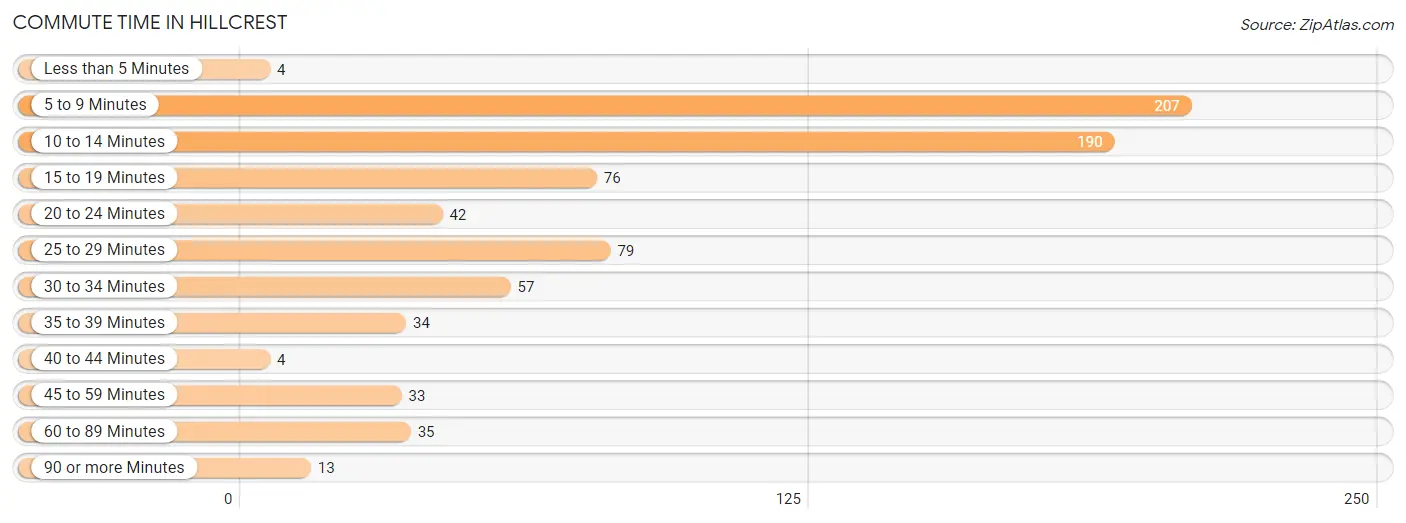
| Commute Time | # Commuters | % Commuters |
| Less than 5 Minutes | 4 | 0.5% |
| 5 to 9 Minutes | 207 | 26.7% |
| 10 to 14 Minutes | 190 | 24.5% |
| 15 to 19 Minutes | 76 | 9.8% |
| 20 to 24 Minutes | 42 | 5.4% |
| 25 to 29 Minutes | 79 | 10.2% |
| 30 to 34 Minutes | 57 | 7.4% |
| 35 to 39 Minutes | 34 | 4.4% |
| 40 to 44 Minutes | 4 | 0.5% |
| 45 to 59 Minutes | 33 | 4.3% |
| 60 to 89 Minutes | 35 | 4.5% |
| 90 or more Minutes | 13 | 1.7% |
Commute Time by Sex in Hillcrest
The most common commute times in Hillcrest are 5 to 9 minutes (93 commuters, 23.7%) for males and 5 to 9 minutes (114 commuters, 29.9%) for females.
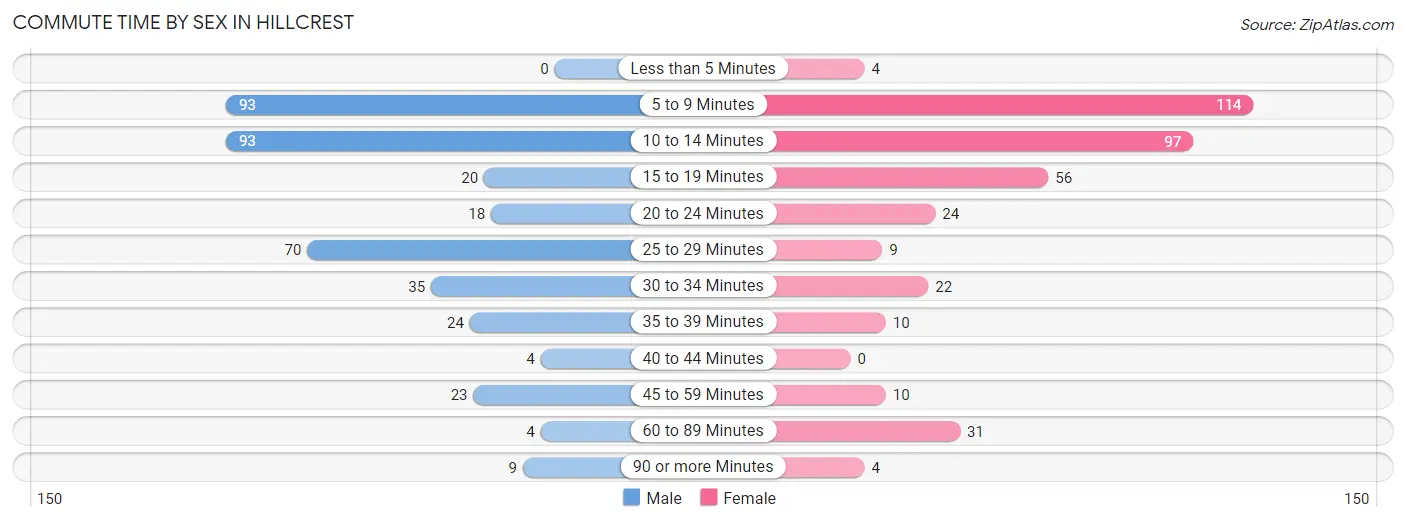
| Commute Time | Male | Female |
| Less than 5 Minutes | 0 (0.0%) | 4 (1.1%) |
| 5 to 9 Minutes | 93 (23.7%) | 114 (29.9%) |
| 10 to 14 Minutes | 93 (23.7%) | 97 (25.5%) |
| 15 to 19 Minutes | 20 (5.1%) | 56 (14.7%) |
| 20 to 24 Minutes | 18 (4.6%) | 24 (6.3%) |
| 25 to 29 Minutes | 70 (17.8%) | 9 (2.4%) |
| 30 to 34 Minutes | 35 (8.9%) | 22 (5.8%) |
| 35 to 39 Minutes | 24 (6.1%) | 10 (2.6%) |
| 40 to 44 Minutes | 4 (1.0%) | 0 (0.0%) |
| 45 to 59 Minutes | 23 (5.9%) | 10 (2.6%) |
| 60 to 89 Minutes | 4 (1.0%) | 31 (8.1%) |
| 90 or more Minutes | 9 (2.3%) | 4 (1.1%) |
Time of Departure to Work by Sex in Hillcrest
The most frequent times of departure to work in Hillcrest are 6:00 AM to 6:29 AM (74, 18.8%) for males and 12:00 PM to 3:59 PM (72, 18.9%) for females.
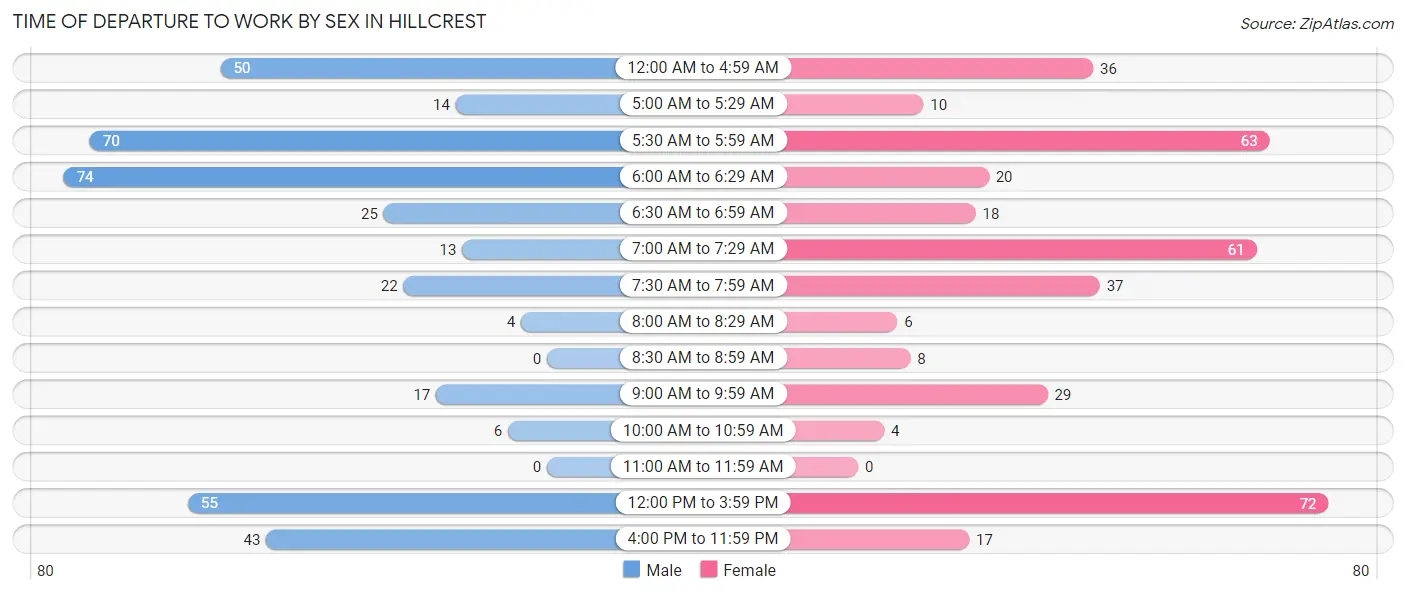
| Time of Departure | Male | Female |
| 12:00 AM to 4:59 AM | 50 (12.7%) | 36 (9.5%) |
| 5:00 AM to 5:29 AM | 14 (3.6%) | 10 (2.6%) |
| 5:30 AM to 5:59 AM | 70 (17.8%) | 63 (16.5%) |
| 6:00 AM to 6:29 AM | 74 (18.8%) | 20 (5.2%) |
| 6:30 AM to 6:59 AM | 25 (6.4%) | 18 (4.7%) |
| 7:00 AM to 7:29 AM | 13 (3.3%) | 61 (16.0%) |
| 7:30 AM to 7:59 AM | 22 (5.6%) | 37 (9.7%) |
| 8:00 AM to 8:29 AM | 4 (1.0%) | 6 (1.6%) |
| 8:30 AM to 8:59 AM | 0 (0.0%) | 8 (2.1%) |
| 9:00 AM to 9:59 AM | 17 (4.3%) | 29 (7.6%) |
| 10:00 AM to 10:59 AM | 6 (1.5%) | 4 (1.1%) |
| 11:00 AM to 11:59 AM | 0 (0.0%) | 0 (0.0%) |
| 12:00 PM to 3:59 PM | 55 (14.0%) | 72 (18.9%) |
| 4:00 PM to 11:59 PM | 43 (10.9%) | 17 (4.5%) |
| Total | 393 (100.0%) | 381 (100.0%) |
Housing Occupancy in Hillcrest
Occupancy by Ownership in Hillcrest
Of the total 572 dwellings in Hillcrest, owner-occupied units account for 486 (85.0%), while renter-occupied units make up 86 (15.0%).
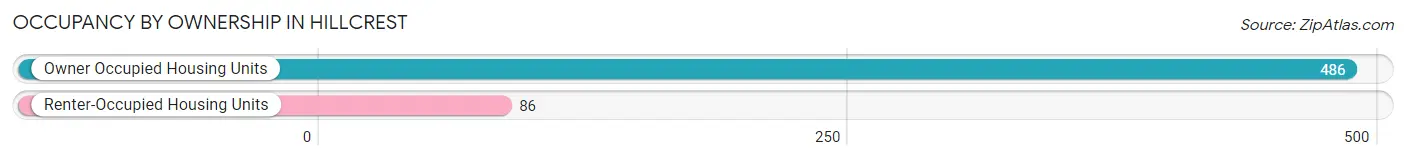
| Occupancy | # Housing Units | % Housing Units |
| Owner Occupied Housing Units | 486 | 85.0% |
| Renter-Occupied Housing Units | 86 | 15.0% |
| Total Occupied Housing Units | 572 | 100.0% |
Occupancy by Household Size in Hillcrest
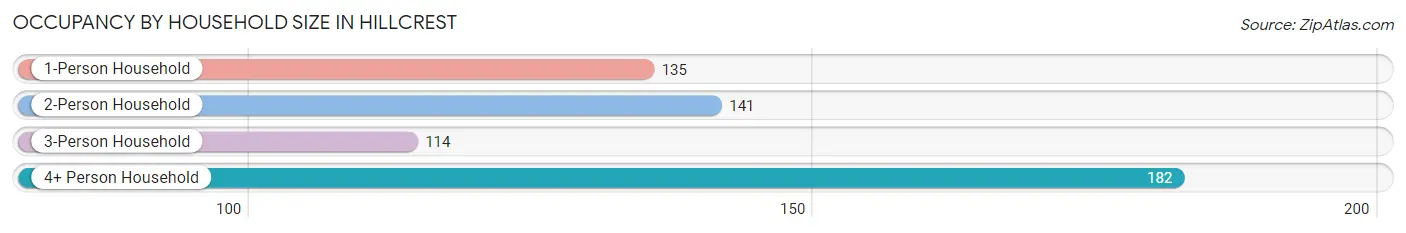
| Household Size | # Housing Units | % Housing Units |
| 1-Person Household | 135 | 23.6% |
| 2-Person Household | 141 | 24.6% |
| 3-Person Household | 114 | 19.9% |
| 4+ Person Household | 182 | 31.8% |
| Total Housing Units | 572 | 100.0% |
Occupancy by Ownership by Household Size in Hillcrest
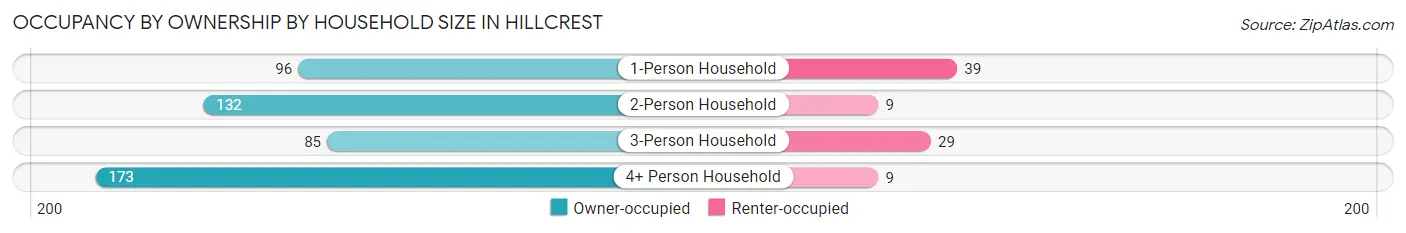
| Household Size | Owner-occupied | Renter-occupied |
| 1-Person Household | 96 (71.1%) | 39 (28.9%) |
| 2-Person Household | 132 (93.6%) | 9 (6.4%) |
| 3-Person Household | 85 (74.6%) | 29 (25.4%) |
| 4+ Person Household | 173 (95.1%) | 9 (5.0%) |
| Total Housing Units | 486 (85.0%) | 86 (15.0%) |
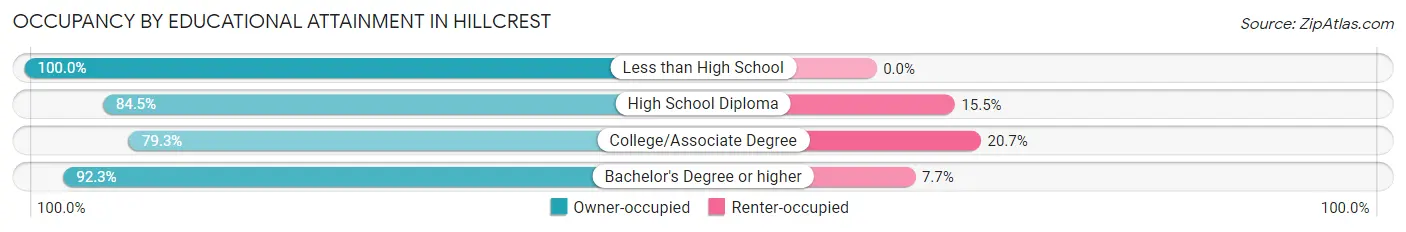
Occupancy by Educational Attainment in Hillcrest
| Household Size | Owner-occupied | Renter-occupied |
| Less than High School | 72 (100.0%) | 0 (0.0%) |
| High School Diploma | 147 (84.5%) | 27 (15.5%) |
| College/Associate Degree | 207 (79.3%) | 54 (20.7%) |
| Bachelor's Degree or higher | 60 (92.3%) | 5 (7.7%) |
Occupancy by Age of Householder in Hillcrest
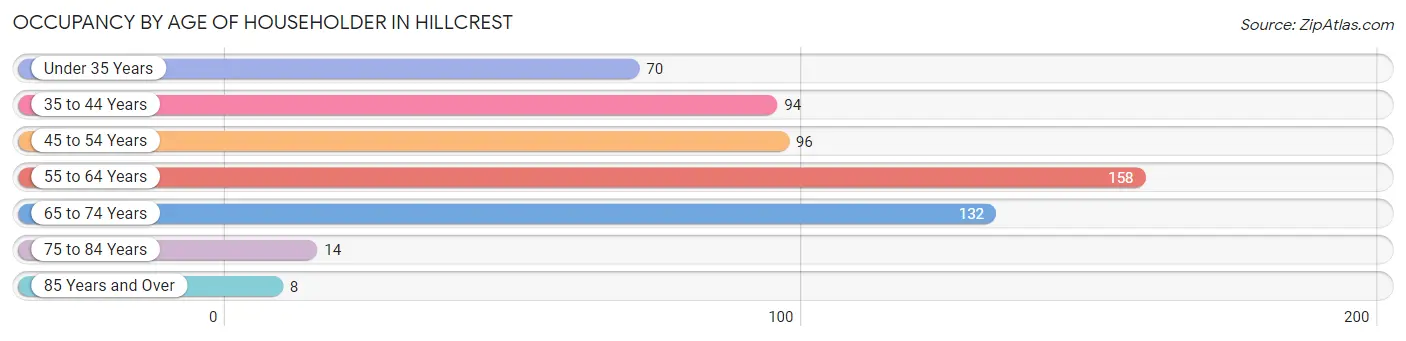
| Age Bracket | # Households | % Households |
| Under 35 Years | 70 | 12.2% |
| 35 to 44 Years | 94 | 16.4% |
| 45 to 54 Years | 96 | 16.8% |
| 55 to 64 Years | 158 | 27.6% |
| 65 to 74 Years | 132 | 23.1% |
| 75 to 84 Years | 14 | 2.5% |
| 85 Years and Over | 8 | 1.4% |
| Total | 572 | 100.0% |
Housing Finances in Hillcrest
Median Income by Occupancy in Hillcrest
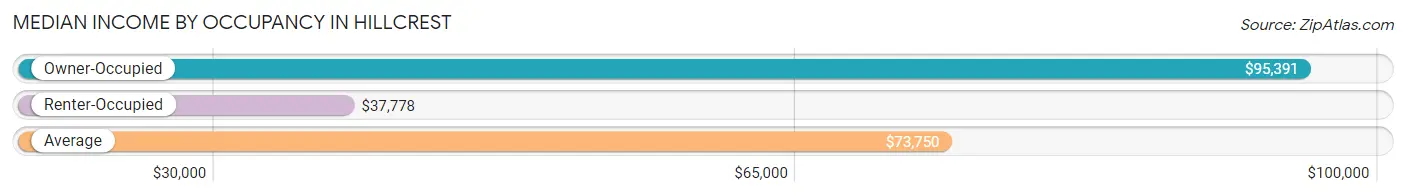
| Occupancy Type | # Households | Median Income |
| Owner-Occupied | 486 (85.0%) | $95,391 |
| Renter-Occupied | 86 (15.0%) | $37,778 |
| Average | 572 (100.0%) | $73,750 |
Occupancy by Householder Income Bracket in Hillcrest
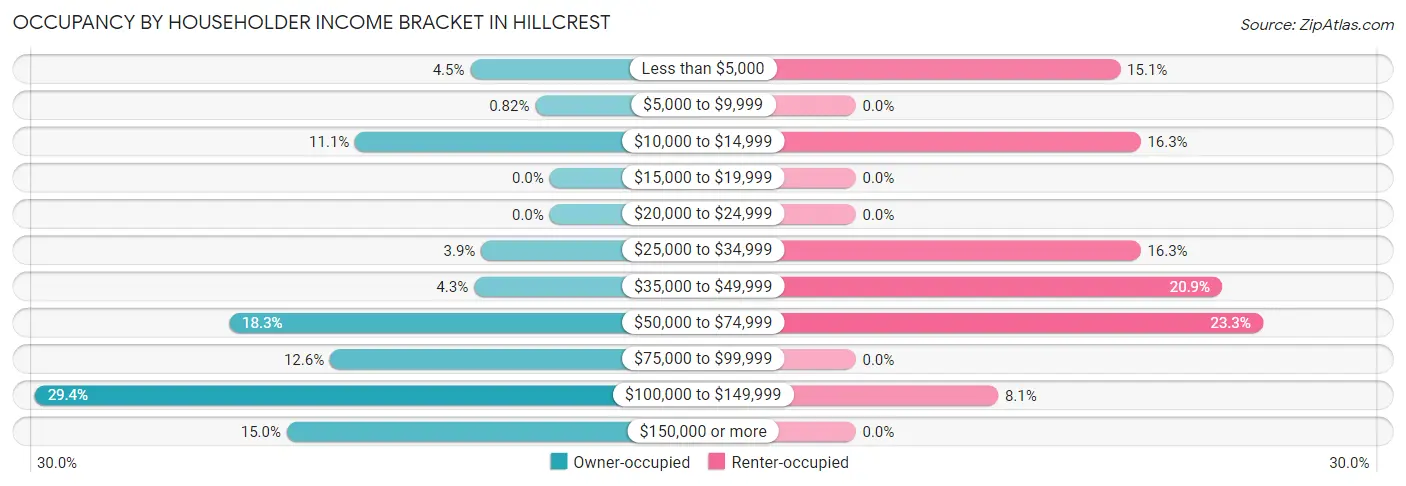
| Income Bracket | Owner-occupied | Renter-occupied |
| Less than $5,000 | 22 (4.5%) | 13 (15.1%) |
| $5,000 to $9,999 | 4 (0.8%) | 0 (0.0%) |
| $10,000 to $14,999 | 54 (11.1%) | 14 (16.3%) |
| $15,000 to $19,999 | 0 (0.0%) | 0 (0.0%) |
| $20,000 to $24,999 | 0 (0.0%) | 0 (0.0%) |
| $25,000 to $34,999 | 19 (3.9%) | 14 (16.3%) |
| $35,000 to $49,999 | 21 (4.3%) | 18 (20.9%) |
| $50,000 to $74,999 | 89 (18.3%) | 20 (23.3%) |
| $75,000 to $99,999 | 61 (12.6%) | 0 (0.0%) |
| $100,000 to $149,999 | 143 (29.4%) | 7 (8.1%) |
| $150,000 or more | 73 (15.0%) | 0 (0.0%) |
| Total | 486 (100.0%) | 86 (100.0%) |
Monthly Housing Cost Tiers in Hillcrest
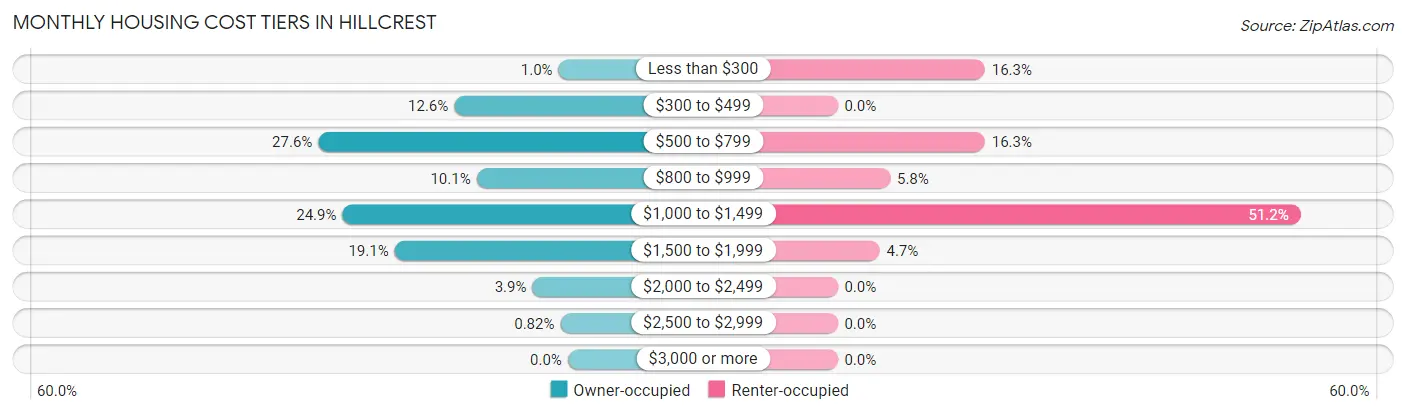
| Monthly Cost | Owner-occupied | Renter-occupied |
| Less than $300 | 5 (1.0%) | 14 (16.3%) |
| $300 to $499 | 61 (12.6%) | 0 (0.0%) |
| $500 to $799 | 134 (27.6%) | 14 (16.3%) |
| $800 to $999 | 49 (10.1%) | 5 (5.8%) |
| $1,000 to $1,499 | 121 (24.9%) | 44 (51.2%) |
| $1,500 to $1,999 | 93 (19.1%) | 4 (4.6%) |
| $2,000 to $2,499 | 19 (3.9%) | 0 (0.0%) |
| $2,500 to $2,999 | 4 (0.8%) | 0 (0.0%) |
| $3,000 or more | 0 (0.0%) | 0 (0.0%) |
| Total | 486 (100.0%) | 86 (100.0%) |
Physical Housing Characteristics in Hillcrest
Housing Structures in Hillcrest
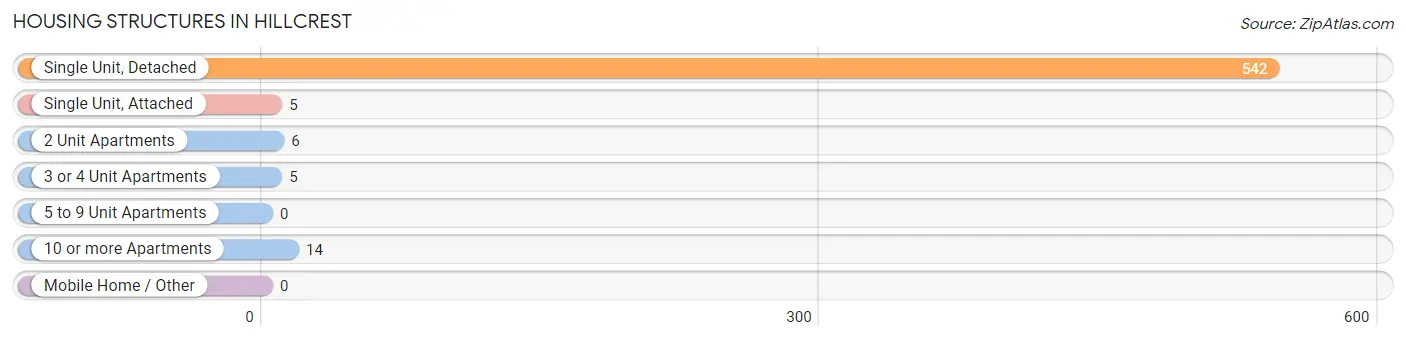
| Structure Type | # Housing Units | % Housing Units |
| Single Unit, Detached | 542 | 94.8% |
| Single Unit, Attached | 5 | 0.9% |
| 2 Unit Apartments | 6 | 1.1% |
| 3 or 4 Unit Apartments | 5 | 0.9% |
| 5 to 9 Unit Apartments | 0 | 0.0% |
| 10 or more Apartments | 14 | 2.5% |
| Mobile Home / Other | 0 | 0.0% |
| Total | 572 | 100.0% |
Housing Structures by Occupancy in Hillcrest
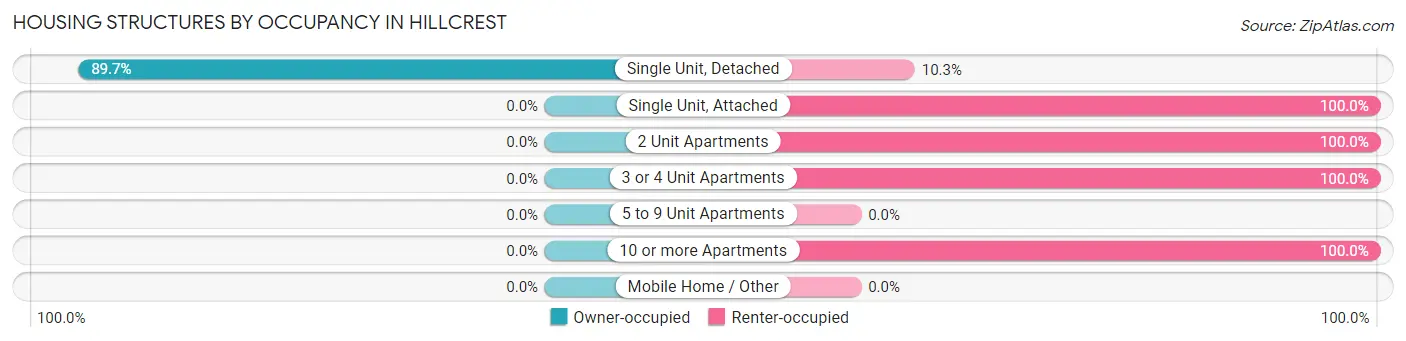
| Structure Type | Owner-occupied | Renter-occupied |
| Single Unit, Detached | 486 (89.7%) | 56 (10.3%) |
| Single Unit, Attached | 0 (0.0%) | 5 (100.0%) |
| 2 Unit Apartments | 0 (0.0%) | 6 (100.0%) |
| 3 or 4 Unit Apartments | 0 (0.0%) | 5 (100.0%) |
| 5 to 9 Unit Apartments | 0 (0.0%) | 0 (0.0%) |
| 10 or more Apartments | 0 (0.0%) | 14 (100.0%) |
| Mobile Home / Other | 0 (0.0%) | 0 (0.0%) |
| Total | 486 (85.0%) | 86 (15.0%) |
Housing Structures by Number of Rooms in Hillcrest
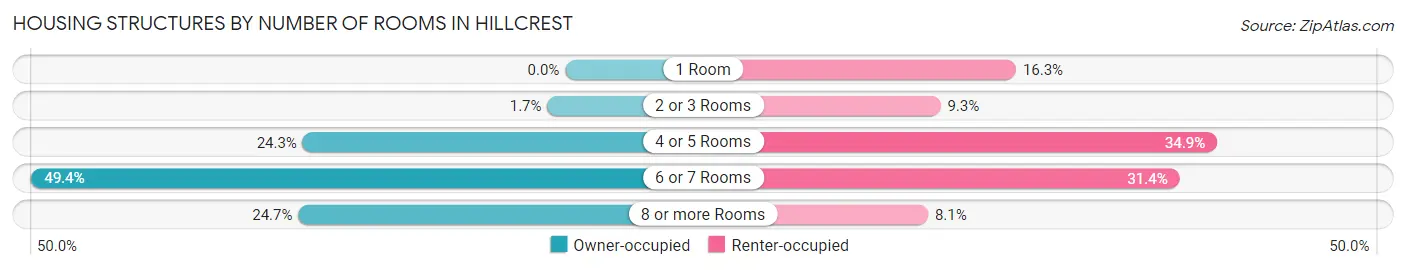
| Number of Rooms | Owner-occupied | Renter-occupied |
| 1 Room | 0 (0.0%) | 14 (16.3%) |
| 2 or 3 Rooms | 8 (1.7%) | 8 (9.3%) |
| 4 or 5 Rooms | 118 (24.3%) | 30 (34.9%) |
| 6 or 7 Rooms | 240 (49.4%) | 27 (31.4%) |
| 8 or more Rooms | 120 (24.7%) | 7 (8.1%) |
| Total | 486 (100.0%) | 86 (100.0%) |
Housing Structure by Heating Type in Hillcrest
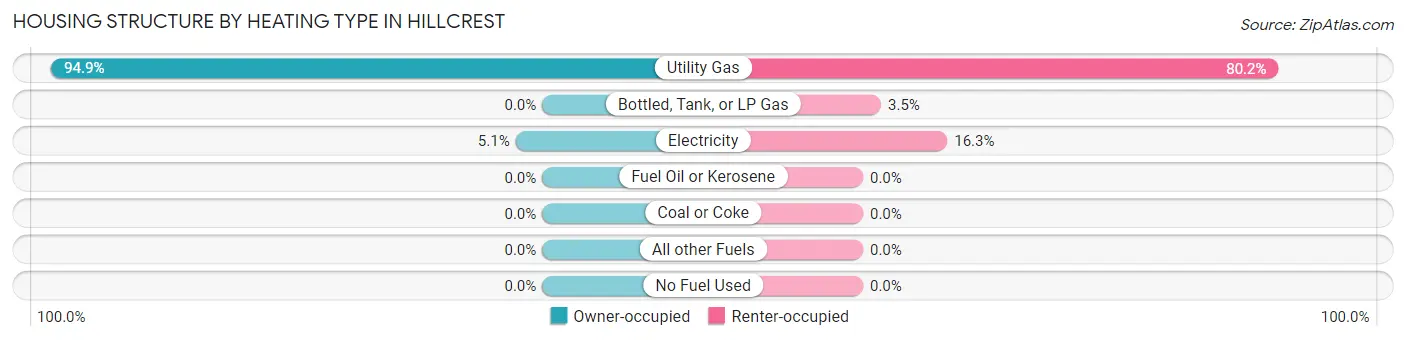
| Heating Type | Owner-occupied | Renter-occupied |
| Utility Gas | 461 (94.9%) | 69 (80.2%) |
| Bottled, Tank, or LP Gas | 0 (0.0%) | 3 (3.5%) |
| Electricity | 25 (5.1%) | 14 (16.3%) |
| Fuel Oil or Kerosene | 0 (0.0%) | 0 (0.0%) |
| Coal or Coke | 0 (0.0%) | 0 (0.0%) |
| All other Fuels | 0 (0.0%) | 0 (0.0%) |
| No Fuel Used | 0 (0.0%) | 0 (0.0%) |
| Total | 486 (100.0%) | 86 (100.0%) |
Household Vehicle Usage in Hillcrest
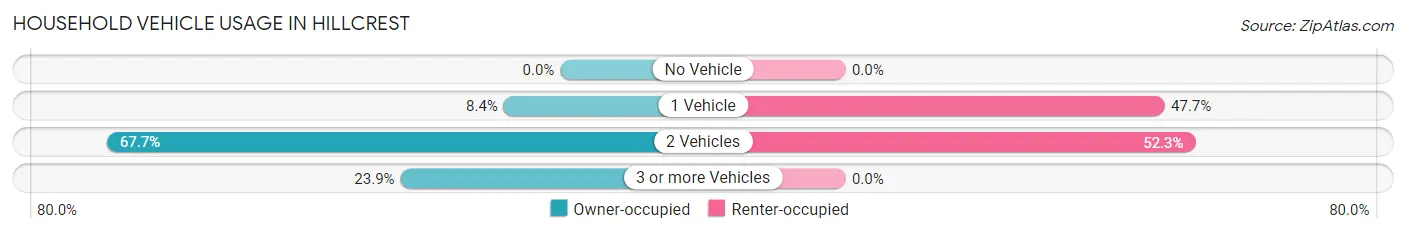
| Vehicles per Household | Owner-occupied | Renter-occupied |
| No Vehicle | 0 (0.0%) | 0 (0.0%) |
| 1 Vehicle | 41 (8.4%) | 41 (47.7%) |
| 2 Vehicles | 329 (67.7%) | 45 (52.3%) |
| 3 or more Vehicles | 116 (23.9%) | 0 (0.0%) |
| Total | 486 (100.0%) | 86 (100.0%) |
Real Estate & Mortgages in Hillcrest
Real Estate and Mortgage Overview in Hillcrest
| Characteristic | Without Mortgage | With Mortgage |
| Housing Units | 165 | 321 |
| Median Property Value | $157,000 | $138,200 |
| Median Household Income | $95,724 | $63 |
| Monthly Housing Costs | $611 | $0 |
| Real Estate Taxes | $3,029 | $2 |
Property Value by Mortgage Status in Hillcrest
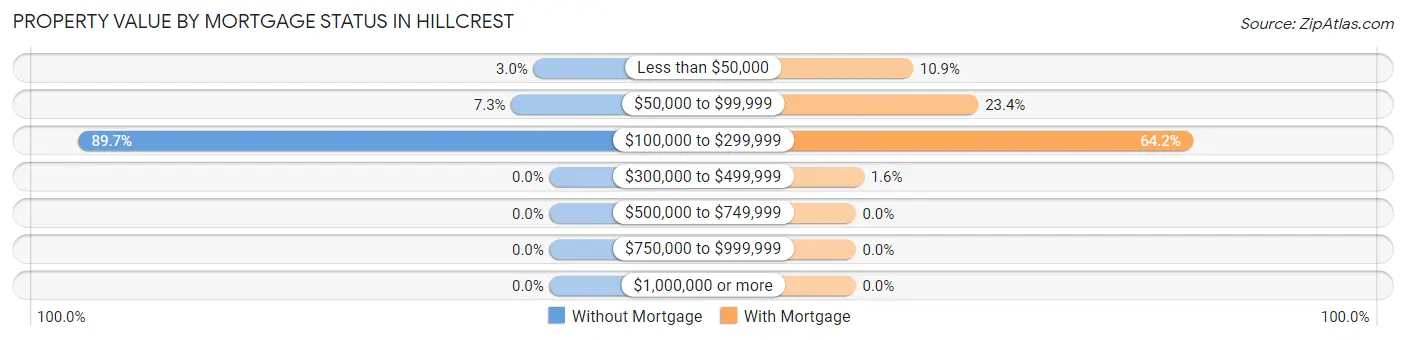
| Property Value | Without Mortgage | With Mortgage |
| Less than $50,000 | 5 (3.0%) | 35 (10.9%) |
| $50,000 to $99,999 | 12 (7.3%) | 75 (23.4%) |
| $100,000 to $299,999 | 148 (89.7%) | 206 (64.2%) |
| $300,000 to $499,999 | 0 (0.0%) | 5 (1.6%) |
| $500,000 to $749,999 | 0 (0.0%) | 0 (0.0%) |
| $750,000 to $999,999 | 0 (0.0%) | 0 (0.0%) |
| $1,000,000 or more | 0 (0.0%) | 0 (0.0%) |
| Total | 165 (100.0%) | 321 (100.0%) |
Household Income by Mortgage Status in Hillcrest
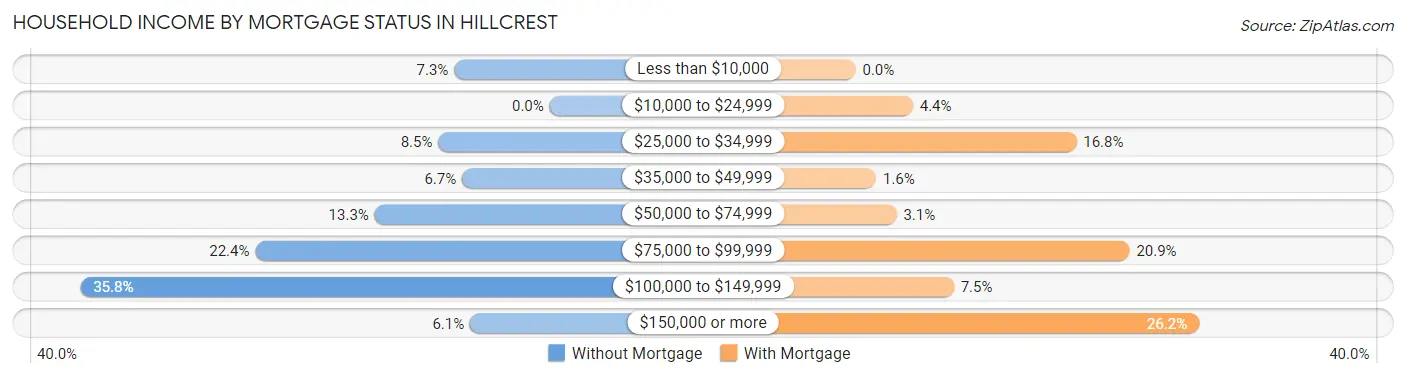
| Household Income | Without Mortgage | With Mortgage |
| Less than $10,000 | 12 (7.3%) | 0 (0.0%) |
| $10,000 to $24,999 | 0 (0.0%) | 14 (4.4%) |
| $25,000 to $34,999 | 14 (8.5%) | 54 (16.8%) |
| $35,000 to $49,999 | 11 (6.7%) | 5 (1.6%) |
| $50,000 to $74,999 | 22 (13.3%) | 10 (3.1%) |
| $75,000 to $99,999 | 37 (22.4%) | 67 (20.9%) |
| $100,000 to $149,999 | 59 (35.8%) | 24 (7.5%) |
| $150,000 or more | 10 (6.1%) | 84 (26.2%) |
| Total | 165 (100.0%) | 321 (100.0%) |
Property Value to Household Income Ratio in Hillcrest
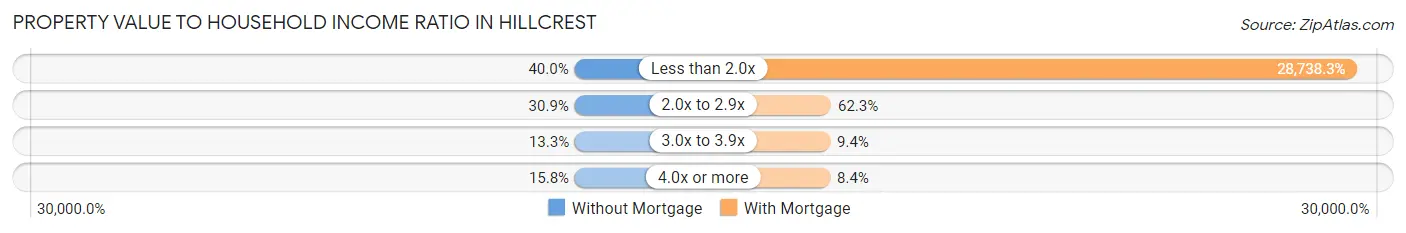
| Value-to-Income Ratio | Without Mortgage | With Mortgage |
| Less than 2.0x | 66 (40.0%) | 92,250 (28,738.3%) |
| 2.0x to 2.9x | 51 (30.9%) | 200 (62.3%) |
| 3.0x to 3.9x | 22 (13.3%) | 30 (9.3%) |
| 4.0x or more | 26 (15.8%) | 27 (8.4%) |
| Total | 165 (100.0%) | 321 (100.0%) |
Real Estate Taxes by Mortgage Status in Hillcrest
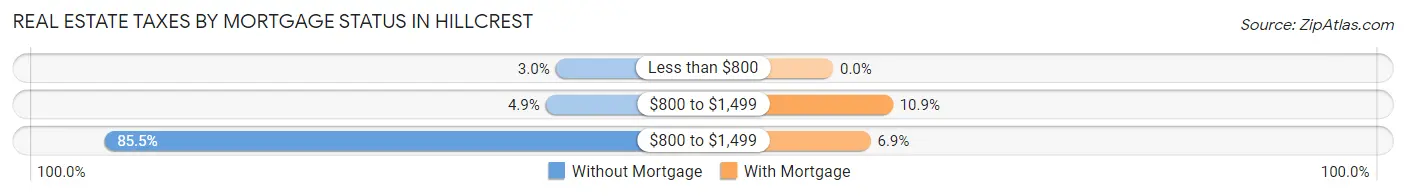
| Property Taxes | Without Mortgage | With Mortgage |
| Less than $800 | 5 (3.0%) | 0 (0.0%) |
| $800 to $1,499 | 8 (4.9%) | 35 (10.9%) |
| $800 to $1,499 | 141 (85.5%) | 22 (6.9%) |
| Total | 165 (100.0%) | 321 (100.0%) |
Health & Disability in Hillcrest
Health Insurance Coverage by Age in Hillcrest
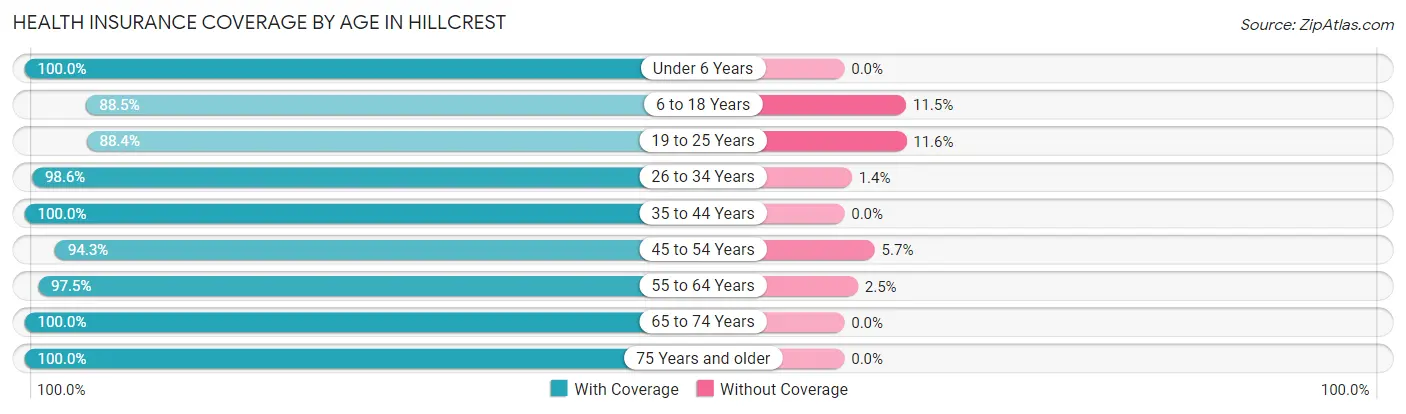
| Age Bracket | With Coverage | Without Coverage |
| Under 6 Years | 95 (100.0%) | 0 (0.0%) |
| 6 to 18 Years | 361 (88.5%) | 47 (11.5%) |
| 19 to 25 Years | 153 (88.4%) | 20 (11.6%) |
| 26 to 34 Years | 143 (98.6%) | 2 (1.4%) |
| 35 to 44 Years | 230 (100.0%) | 0 (0.0%) |
| 45 to 54 Years | 150 (94.3%) | 9 (5.7%) |
| 55 to 64 Years | 231 (97.5%) | 6 (2.5%) |
| 65 to 74 Years | 223 (100.0%) | 0 (0.0%) |
| 75 Years and older | 24 (100.0%) | 0 (0.0%) |
| Total | 1,610 (95.0%) | 84 (5.0%) |
Health Insurance Coverage by Citizenship Status in Hillcrest
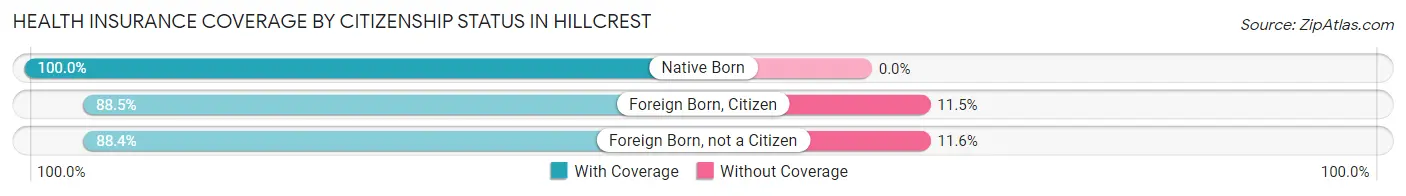
| Citizenship Status | With Coverage | Without Coverage |
| Native Born | 95 (100.0%) | 0 (0.0%) |
| Foreign Born, Citizen | 361 (88.5%) | 47 (11.5%) |
| Foreign Born, not a Citizen | 153 (88.4%) | 20 (11.6%) |
Health Insurance Coverage by Household Income in Hillcrest
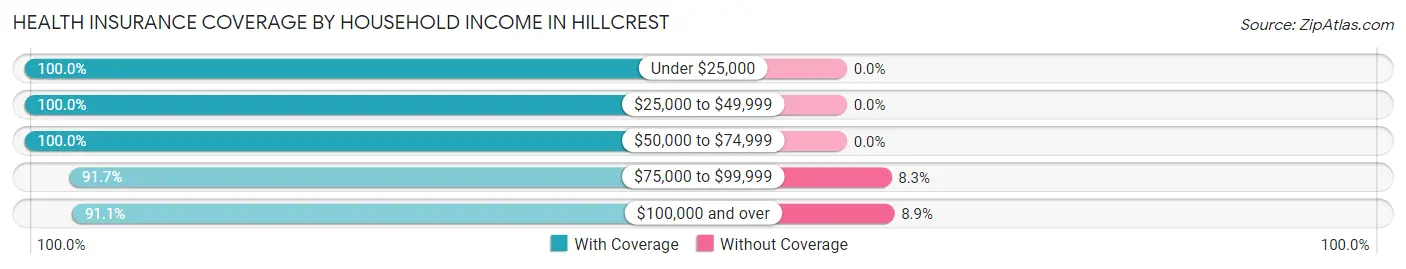
| Household Income | With Coverage | Without Coverage |
| Under $25,000 | 156 (100.0%) | 0 (0.0%) |
| $25,000 to $49,999 | 136 (100.0%) | 0 (0.0%) |
| $50,000 to $74,999 | 443 (100.0%) | 0 (0.0%) |
| $75,000 to $99,999 | 198 (91.7%) | 18 (8.3%) |
| $100,000 and over | 677 (91.1%) | 66 (8.9%) |
Public vs Private Health Insurance Coverage by Age in Hillcrest
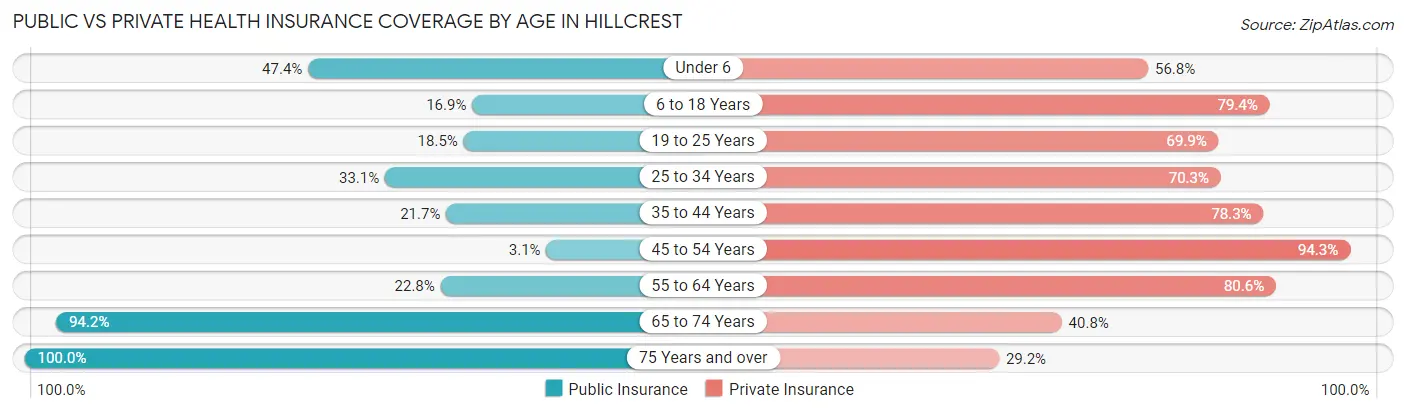
| Age Bracket | Public Insurance | Private Insurance |
| Under 6 | 45 (47.4%) | 54 (56.8%) |
| 6 to 18 Years | 69 (16.9%) | 324 (79.4%) |
| 19 to 25 Years | 32 (18.5%) | 121 (69.9%) |
| 25 to 34 Years | 48 (33.1%) | 102 (70.3%) |
| 35 to 44 Years | 50 (21.7%) | 180 (78.3%) |
| 45 to 54 Years | 5 (3.1%) | 150 (94.3%) |
| 55 to 64 Years | 54 (22.8%) | 191 (80.6%) |
| 65 to 74 Years | 210 (94.2%) | 91 (40.8%) |
| 75 Years and over | 24 (100.0%) | 7 (29.2%) |
| Total | 537 (31.7%) | 1,220 (72.0%) |
Disability Status by Sex by Age in Hillcrest
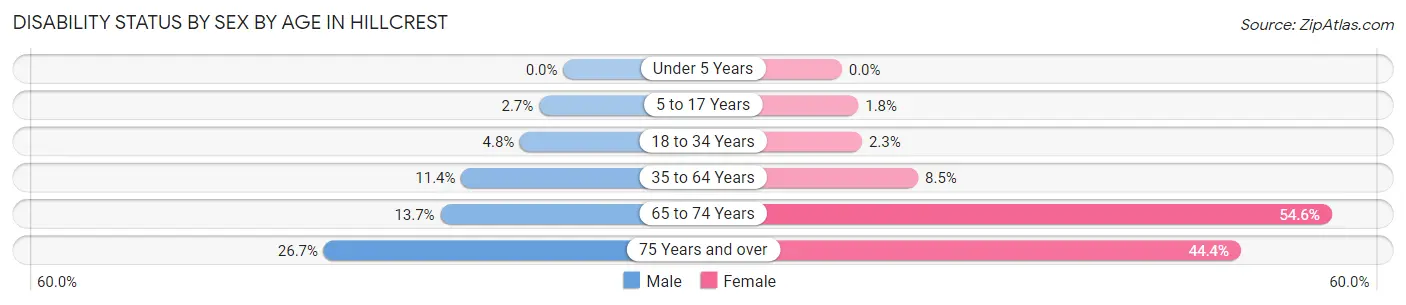
| Age Bracket | Male | Female |
| Under 5 Years | 0 (0.0%) | 0 (0.0%) |
| 5 to 17 Years | 4 (2.7%) | 4 (1.8%) |
| 18 to 34 Years | 10 (4.8%) | 4 (2.2%) |
| 35 to 64 Years | 31 (11.4%) | 30 (8.5%) |
| 65 to 74 Years | 23 (13.7%) | 30 (54.5%) |
| 75 Years and over | 4 (26.7%) | 4 (44.4%) |
Disability Class by Sex by Age in Hillcrest
Disability Class: Hearing Difficulty
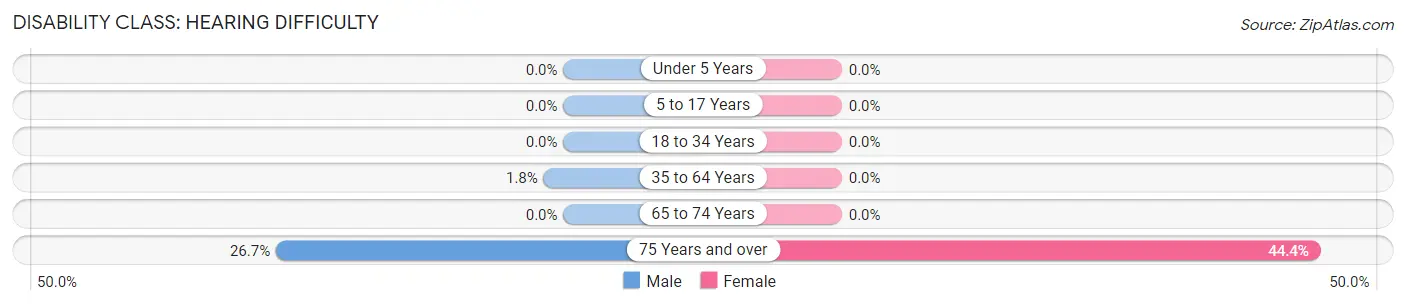
| Age Bracket | Male | Female |
| Under 5 Years | 0 (0.0%) | 0 (0.0%) |
| 5 to 17 Years | 0 (0.0%) | 0 (0.0%) |
| 18 to 34 Years | 0 (0.0%) | 0 (0.0%) |
| 35 to 64 Years | 5 (1.8%) | 0 (0.0%) |
| 65 to 74 Years | 0 (0.0%) | 0 (0.0%) |
| 75 Years and over | 4 (26.7%) | 4 (44.4%) |
Disability Class: Vision Difficulty
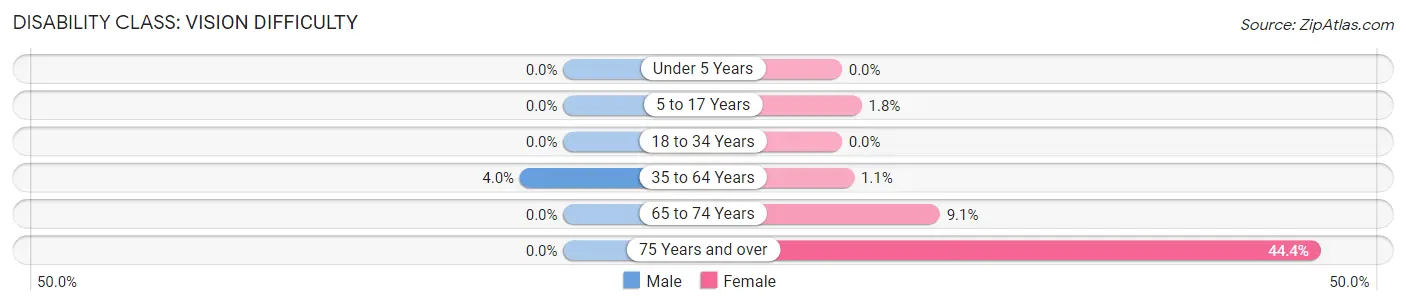
| Age Bracket | Male | Female |
| Under 5 Years | 0 (0.0%) | 0 (0.0%) |
| 5 to 17 Years | 0 (0.0%) | 4 (1.8%) |
| 18 to 34 Years | 0 (0.0%) | 0 (0.0%) |
| 35 to 64 Years | 11 (4.0%) | 4 (1.1%) |
| 65 to 74 Years | 0 (0.0%) | 5 (9.1%) |
| 75 Years and over | 0 (0.0%) | 4 (44.4%) |
Disability Class: Cognitive Difficulty
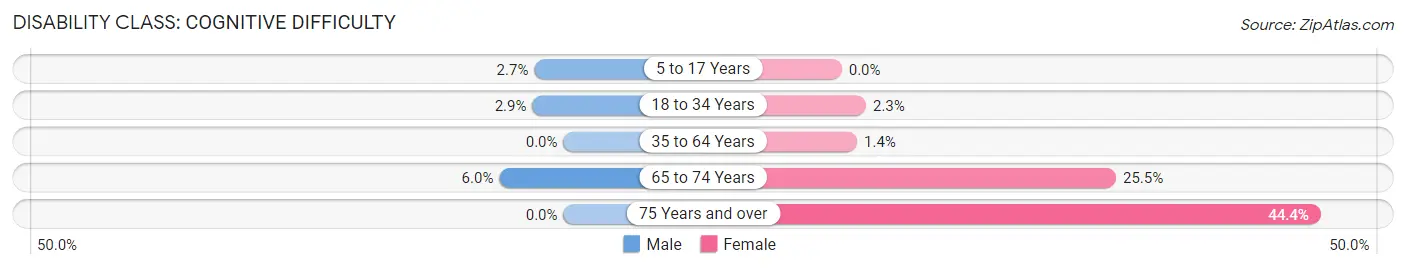
| Age Bracket | Male | Female |
| 5 to 17 Years | 4 (2.7%) | 0 (0.0%) |
| 18 to 34 Years | 6 (2.9%) | 4 (2.2%) |
| 35 to 64 Years | 0 (0.0%) | 5 (1.4%) |
| 65 to 74 Years | 10 (5.9%) | 14 (25.5%) |
| 75 Years and over | 0 (0.0%) | 4 (44.4%) |
Disability Class: Ambulatory Difficulty
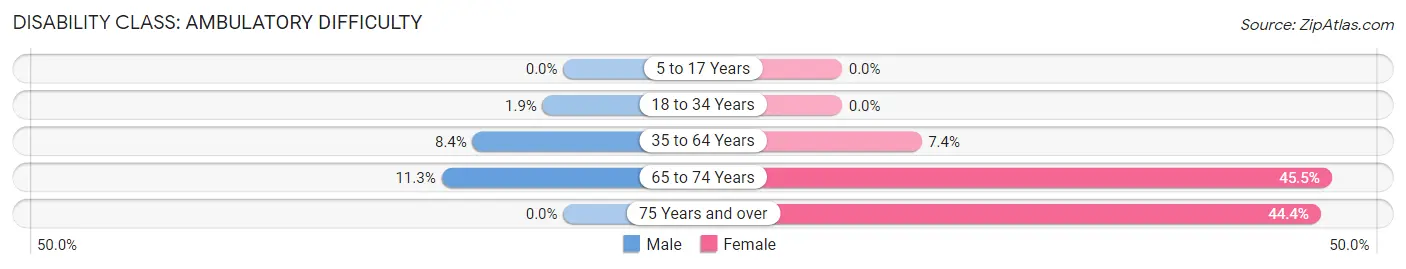
| Age Bracket | Male | Female |
| 5 to 17 Years | 0 (0.0%) | 0 (0.0%) |
| 18 to 34 Years | 4 (1.9%) | 0 (0.0%) |
| 35 to 64 Years | 23 (8.4%) | 26 (7.4%) |
| 65 to 74 Years | 19 (11.3%) | 25 (45.5%) |
| 75 Years and over | 0 (0.0%) | 4 (44.4%) |
Disability Class: Self-Care Difficulty
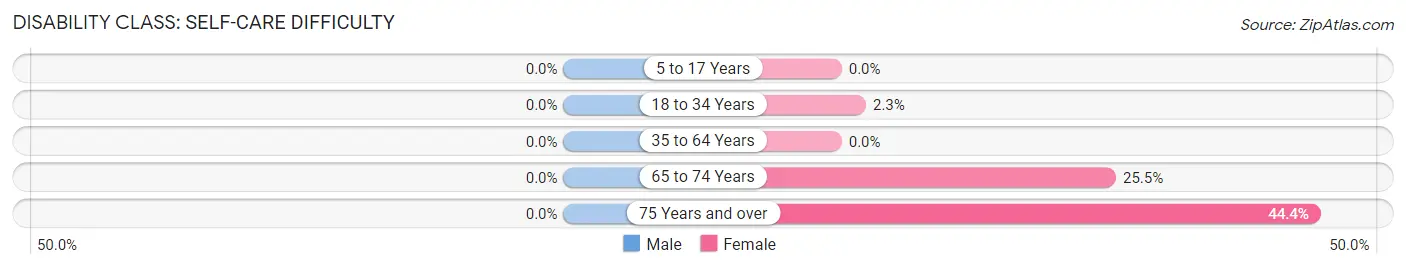
| Age Bracket | Male | Female |
| 5 to 17 Years | 0 (0.0%) | 0 (0.0%) |
| 18 to 34 Years | 0 (0.0%) | 4 (2.2%) |
| 35 to 64 Years | 0 (0.0%) | 0 (0.0%) |
| 65 to 74 Years | 0 (0.0%) | 14 (25.5%) |
| 75 Years and over | 0 (0.0%) | 4 (44.4%) |
Technology Access in Hillcrest
Computing Device Access in Hillcrest
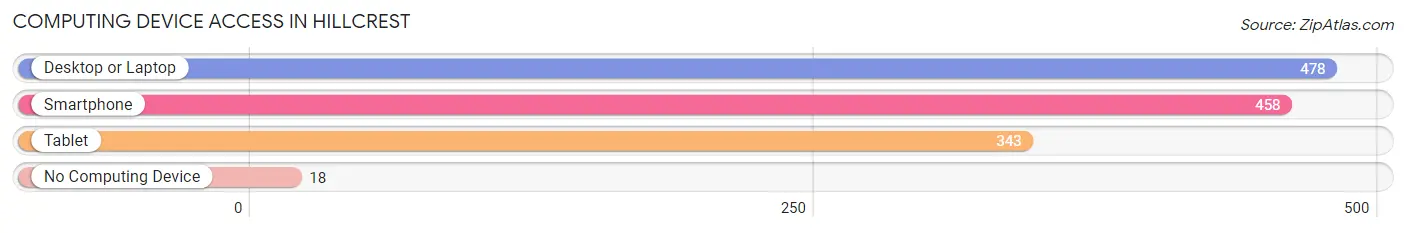
| Device Type | # Households | % Households |
| Desktop or Laptop | 478 | 83.6% |
| Smartphone | 458 | 80.1% |
| Tablet | 343 | 60.0% |
| No Computing Device | 18 | 3.2% |
| Total | 572 | 100.0% |
Internet Access in Hillcrest
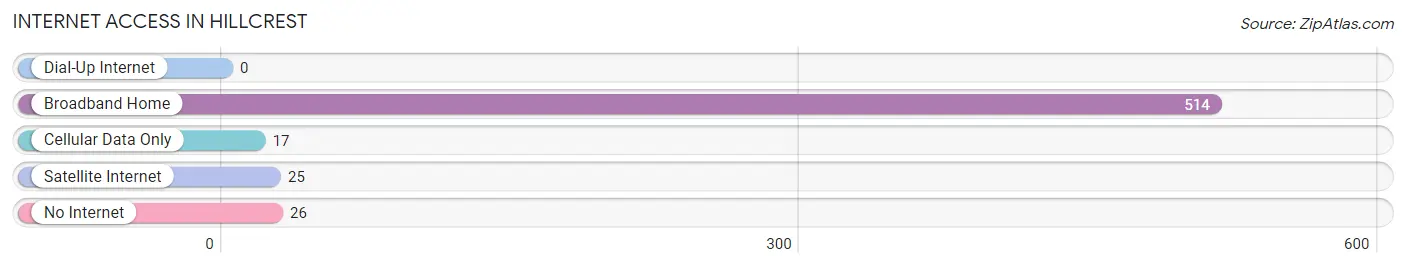
| Internet Type | # Households | % Households |
| Dial-Up Internet | 0 | 0.0% |
| Broadband Home | 514 | 89.9% |
| Cellular Data Only | 17 | 3.0% |
| Satellite Internet | 25 | 4.4% |
| No Internet | 26 | 4.5% |
| Total | 572 | 100.0% |
Hillcrest Summary
Hillcrest, Illinois is a small village located in the northern part of the state, in the county of Cook. It is situated about 25 miles northwest of Chicago and is part of the Chicago metropolitan area. The village has a population of about 2,000 people and is a predominantly residential community.
History
Hillcrest was founded in 1836 by a group of settlers from New England. The village was originally known as “Hillcrest Station” and was a stop on the Chicago and Northwestern Railroad. The village was officially incorporated in 1891 and was named after the hill that the village was built on.
In the early 1900s, Hillcrest was a thriving agricultural community. The village was home to several farms and orchards, as well as a number of small businesses. The village also had a post office, a school, and a few churches.
In the 1950s, Hillcrest began to experience a population boom as people moved to the area from Chicago and other parts of the country. This influx of people led to the development of new housing and businesses in the village.
Geography
Hillcrest is located in the northern part of Cook County, Illinois. The village is situated about 25 miles northwest of Chicago and is part of the Chicago metropolitan area. The village is bordered by the villages of Northbrook, Glenview, and Northfield.
The village is situated on a hill, which is why it was given its name. The village is surrounded by rolling hills and is home to several parks and nature preserves. The village is also home to a number of small lakes and ponds.
Economy
The economy of Hillcrest is largely based on the service industry. The village is home to a number of small businesses, including restaurants, retail stores, and professional services. The village is also home to a number of corporate offices, including those of the Chicago Tribune and the Chicago Sun-Times.
The village is also home to a number of manufacturing companies, including a factory that produces plastic products. The village is also home to a number of technology companies, including a software development firm.
Demographics
As of the 2010 census, the population of Hillcrest was 2,000 people. The village is predominantly white, with about 90% of the population being white. The village is also home to a small Hispanic population, as well as a small African American population.
The median household income in Hillcrest is $60,000, which is slightly higher than the national average. The village also has a low unemployment rate, with only about 4% of the population being unemployed.
Conclusion
Hillcrest, Illinois is a small village located in the northern part of the state, in the county of Cook. The village has a population of about 2,000 people and is a predominantly residential community. The village was founded in 1836 and was originally known as “Hillcrest Station”. The village is situated on a hill and is surrounded by rolling hills and is home to several parks and nature preserves. The economy of Hillcrest is largely based on the service industry and the village is home to a number of small businesses, corporate offices, and manufacturing companies. The village is predominantly white, with about 90% of the population being white. The median household income in Hillcrest is $60,000, which is slightly higher than the national average.
Common Questions
What is the Total Population of Hillcrest?
Total Population of Hillcrest is 1,694.
What is the Total Male Population of Hillcrest?
Total Male Population of Hillcrest is 842.
What is the Total Female Population of Hillcrest?
Total Female Population of Hillcrest is 852.
What is the Ratio of Males per 100 Females in Hillcrest?
There are 98.83 Males per 100 Females in Hillcrest.
What is the Ratio of Females per 100 Males in Hillcrest?
There are 101.19 Females per 100 Males in Hillcrest.
What is the Median Population Age in Hillcrest?
Median Population Age in Hillcrest is 37.2 Years.
What is the Average Family Size in Hillcrest
Average Family Size in Hillcrest is 3.3 People.
What is the Average Household Size in Hillcrest
Average Household Size in Hillcrest is 3.0 People.
What is Per Capita Income in Hillcrest?
Per Capita income in Hillcrest is $29,394.
What is the Median Family Income in Hillcrest?
Median Family Income in Hillcrest is $96,087.
What is the Median Household income in Hillcrest?
Median Household Income in Hillcrest is $73,750.
What is Income or Wage Gap in Hillcrest?
Income or Wage Gap in Hillcrest is 10.4%.
Women in Hillcrest earn 89.6 cents for every dollar earned by a man.
What is Inequality or Gini Index in Hillcrest?
Inequality or Gini Index in Hillcrest is 0.40.
How Large is the Labor Force in Hillcrest?
There are 946 People in the Labor Forcein in Hillcrest.
What is the Percentage of People in the Labor Force in Hillcrest?
72.4% of People are in the Labor Force in Hillcrest.
What is the Unemployment Rate in Hillcrest?
Unemployment Rate in Hillcrest is 5.4%.