Phoenix, IL
Phoenix Map
Phoenix Overview
1,278
TOTAL POPULATION
573
MALE POPULATION
705
FEMALE POPULATION
81.28
MALES / 100 FEMALES
123.04
FEMALES / 100 MALES
52.5
MEDIAN AGE
3.2
AVG FAMILY SIZE
2.0
AVG HOUSEHOLD SIZE
$24,007
PER CAPITA INCOME
$40,179
AVG FAMILY INCOME
$24,491
AVG HOUSEHOLD INCOME
21.7%
WAGE / INCOME GAP [ % ]
78.3¢/ $1
WAGE / INCOME GAP [ $ ]
$11,451
FAMILY INCOME DEFICIT
0.47
INEQUALITY / GINI INDEX
654
LABOR FORCE [ PEOPLE ]
58.9%
PERCENT IN LABOR FORCE
20.5%
UNEMPLOYMENT RATE
Phoenix Area Codes
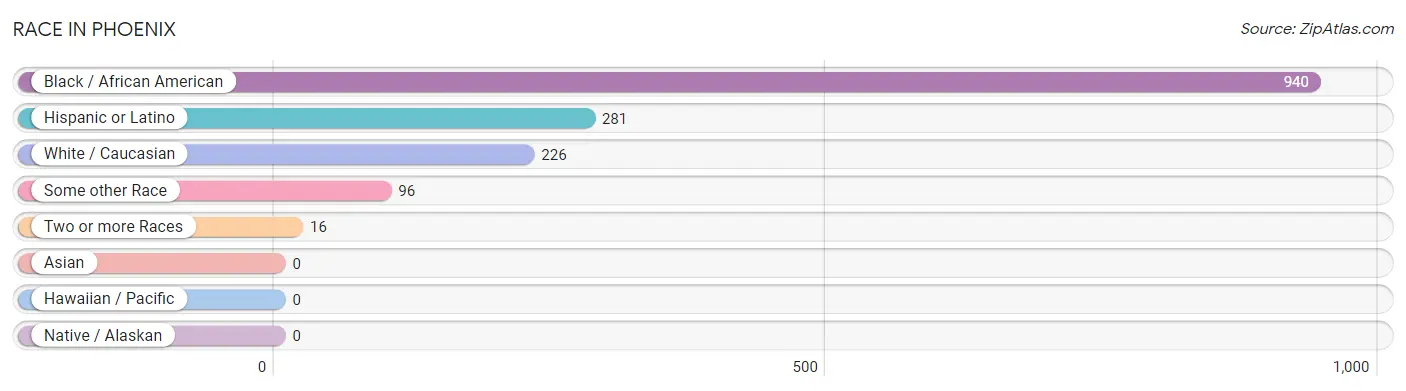
Race in Phoenix
The most populous races in Phoenix are Black / African American (940 | 73.6%), Hispanic or Latino (281 | 22.0%), and White / Caucasian (226 | 17.7%).
| Race | # Population | % Population |
| Asian | 0 | 0.0% |
| Black / African American | 940 | 73.6% |
| Hawaiian / Pacific | 0 | 0.0% |
| Hispanic or Latino | 281 | 22.0% |
| Native / Alaskan | 0 | 0.0% |
| White / Caucasian | 226 | 17.7% |
| Two or more Races | 16 | 1.3% |
| Some other Race | 96 | 7.5% |
| Total | 1,278 | 100.0% |
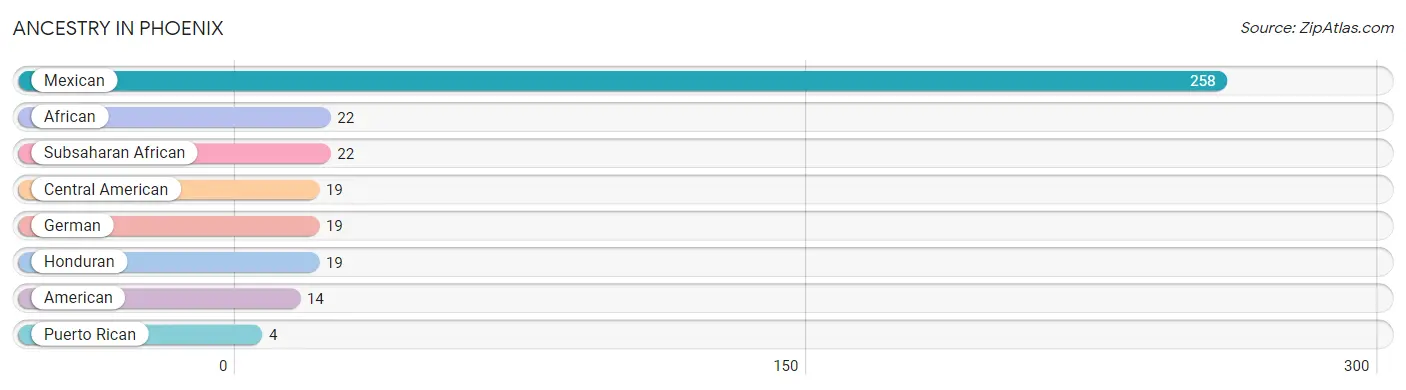
Ancestry in Phoenix
The most populous ancestries reported in Phoenix are Mexican (258 | 20.2%), African (22 | 1.7%), Subsaharan African (22 | 1.7%), Central American (19 | 1.5%), and German (19 | 1.5%), together accounting for 26.6% of all Phoenix residents.
| Ancestry | # Population | % Population |
| African | 22 | 1.7% |
| American | 14 | 1.1% |
| Central American | 19 | 1.5% |
| German | 19 | 1.5% |
| Honduran | 19 | 1.5% |
| Mexican | 258 | 20.2% |
| Puerto Rican | 4 | 0.3% |
| Subsaharan African | 22 | 1.7% | View All 8 Rows |
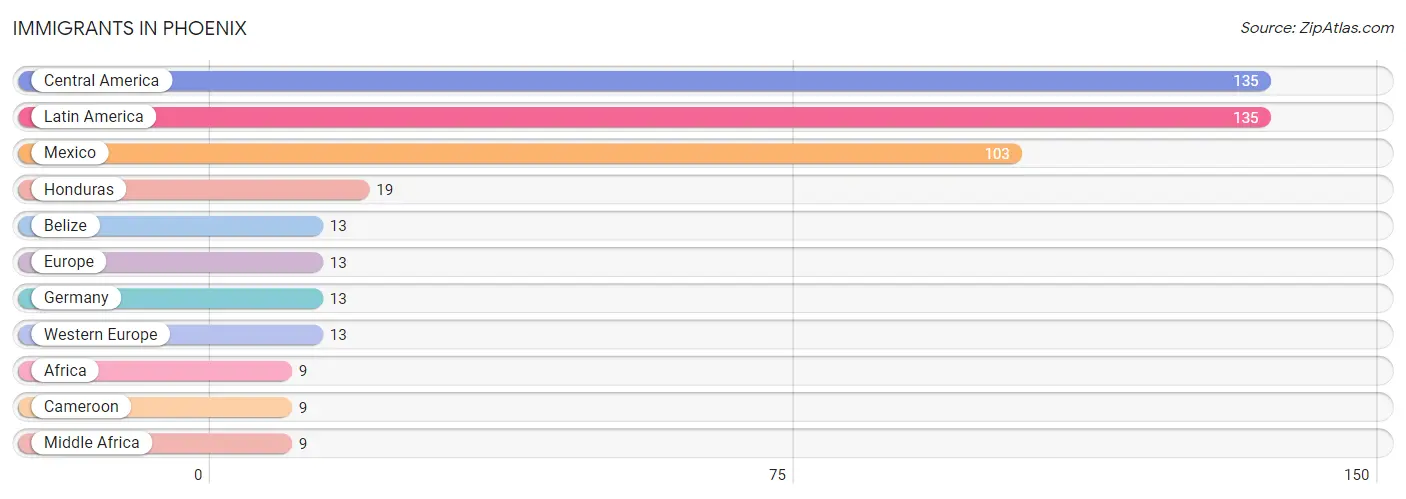
Immigrants in Phoenix
The most numerous immigrant groups reported in Phoenix came from Central America (135 | 10.6%), Latin America (135 | 10.6%), Mexico (103 | 8.1%), Honduras (19 | 1.5%), and Belize (13 | 1.0%), together accounting for 31.7% of all Phoenix residents.
| Immigration Origin | # Population | % Population |
| Africa | 9 | 0.7% |
| Belize | 13 | 1.0% |
| Cameroon | 9 | 0.7% |
| Central America | 135 | 10.6% |
| Europe | 13 | 1.0% |
| Germany | 13 | 1.0% |
| Honduras | 19 | 1.5% |
| Latin America | 135 | 10.6% |
| Mexico | 103 | 8.1% |
| Middle Africa | 9 | 0.7% |
| Western Europe | 13 | 1.0% | View All 11 Rows |
Sex and Age in Phoenix
Sex and Age in Phoenix
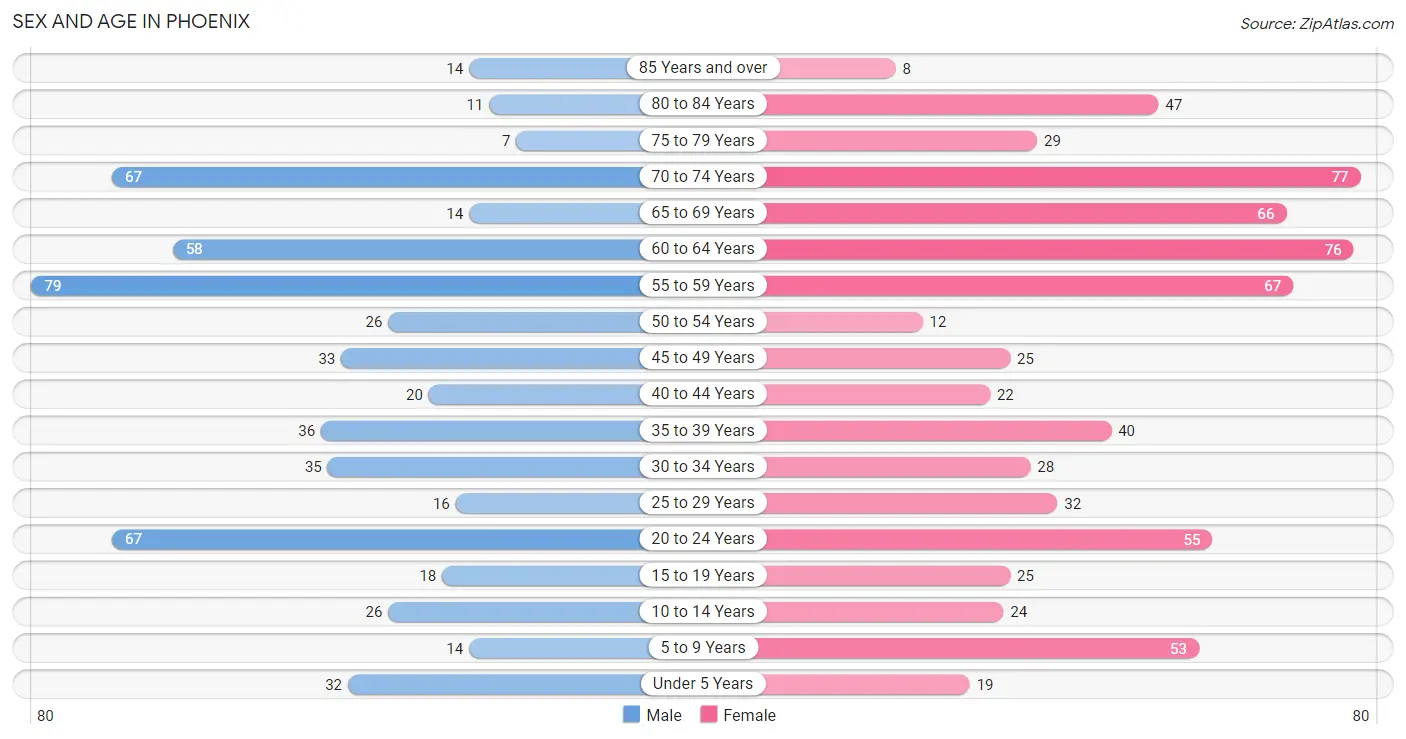
The most populous age groups in Phoenix are 55 to 59 Years (79 | 13.8%) for men and 70 to 74 Years (77 | 10.9%) for women.
| Age Bracket | Male | Female |
| Under 5 Years | 32 (5.6%) | 19 (2.7%) |
| 5 to 9 Years | 14 (2.4%) | 53 (7.5%) |
| 10 to 14 Years | 26 (4.5%) | 24 (3.4%) |
| 15 to 19 Years | 18 (3.1%) | 25 (3.5%) |
| 20 to 24 Years | 67 (11.7%) | 55 (7.8%) |
| 25 to 29 Years | 16 (2.8%) | 32 (4.5%) |
| 30 to 34 Years | 35 (6.1%) | 28 (4.0%) |
| 35 to 39 Years | 36 (6.3%) | 40 (5.7%) |
| 40 to 44 Years | 20 (3.5%) | 22 (3.1%) |
| 45 to 49 Years | 33 (5.8%) | 25 (3.5%) |
| 50 to 54 Years | 26 (4.5%) | 12 (1.7%) |
| 55 to 59 Years | 79 (13.8%) | 67 (9.5%) |
| 60 to 64 Years | 58 (10.1%) | 76 (10.8%) |
| 65 to 69 Years | 14 (2.4%) | 66 (9.4%) |
| 70 to 74 Years | 67 (11.7%) | 77 (10.9%) |
| 75 to 79 Years | 7 (1.2%) | 29 (4.1%) |
| 80 to 84 Years | 11 (1.9%) | 47 (6.7%) |
| 85 Years and over | 14 (2.4%) | 8 (1.1%) |
| Total | 573 (100.0%) | 705 (100.0%) |
Families and Households in Phoenix
Median Family Size in Phoenix
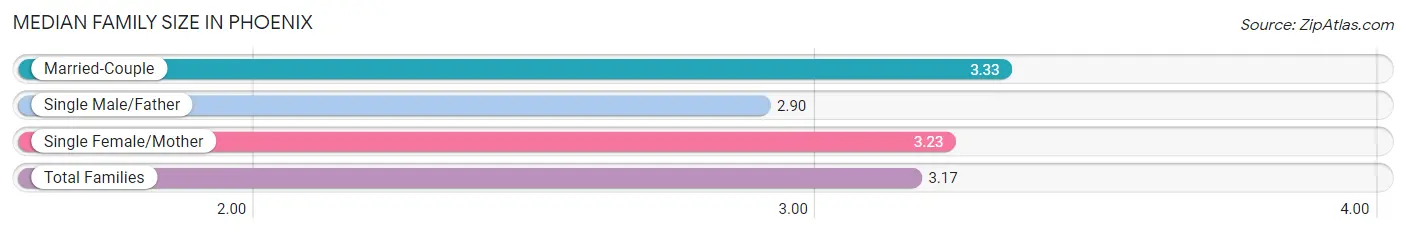
The median family size in Phoenix is 3.17 persons per family, with married-couple families (78 | 30.2%) accounting for the largest median family size of 3.33 persons per family. On the other hand, single male/father families (67 | 26.0%) represent the smallest median family size with 2.90 persons per family.
| Family Type | # Families | Family Size |
| Married-Couple | 78 (30.2%) | 3.33 |
| Single Male/Father | 67 (26.0%) | 2.90 |
| Single Female/Mother | 113 (43.8%) | 3.23 |
| Total Families | 258 (100.0%) | 3.17 |
Median Household Size in Phoenix
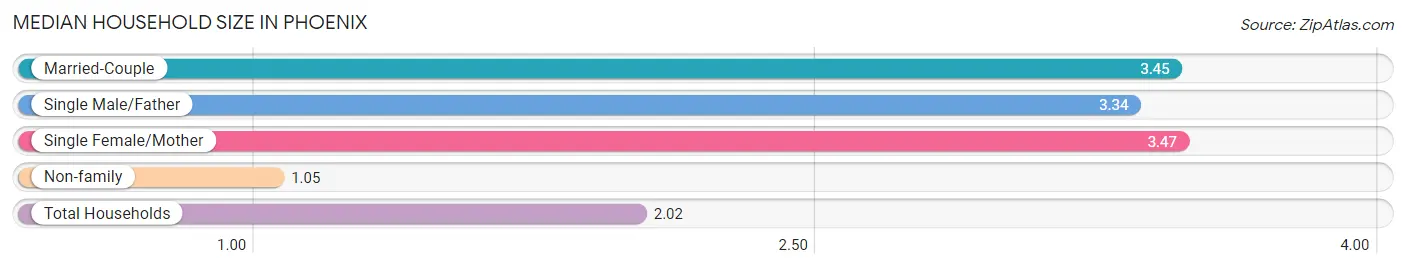
The median household size in Phoenix is 2.02 persons per household, with single female/mother households (113 | 17.8%) accounting for the largest median household size of 3.47 persons per household. non-family households (375 | 59.2%) represent the smallest median household size with 1.05 persons per household.
| Household Type | # Households | Household Size |
| Married-Couple | 78 (12.3%) | 3.45 |
| Single Male/Father | 67 (10.6%) | 3.34 |
| Single Female/Mother | 113 (17.8%) | 3.47 |
| Non-family | 375 (59.2%) | 1.05 |
| Total Households | 633 (100.0%) | 2.02 |
Household Size by Marriage Status in Phoenix
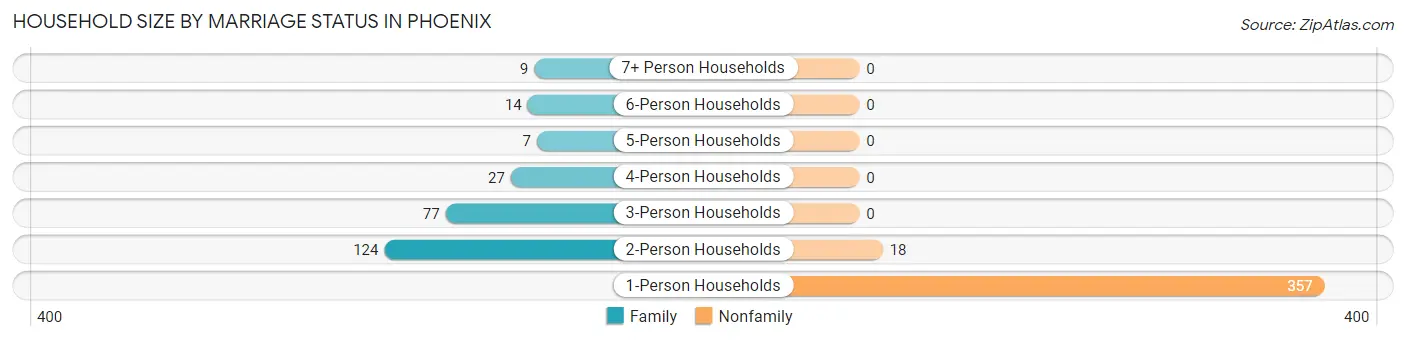
Out of a total of 633 households in Phoenix, 258 (40.8%) are family households, while 375 (59.2%) are nonfamily households. The most numerous type of family households are 2-person households, comprising 124, and the most common type of nonfamily households are 1-person households, comprising 357.
| Household Size | Family Households | Nonfamily Households |
| 1-Person Households | - | 357 (56.4%) |
| 2-Person Households | 124 (19.6%) | 18 (2.8%) |
| 3-Person Households | 77 (12.2%) | 0 (0.0%) |
| 4-Person Households | 27 (4.3%) | 0 (0.0%) |
| 5-Person Households | 7 (1.1%) | 0 (0.0%) |
| 6-Person Households | 14 (2.2%) | 0 (0.0%) |
| 7+ Person Households | 9 (1.4%) | 0 (0.0%) |
| Total | 258 (40.8%) | 375 (59.2%) |
Female Fertility in Phoenix
Fertility by Age in Phoenix
| Age Bracket | Women with Births | Births / 1,000 Women |
| 15 to 19 years | 0 (0.0%) | 0.0 |
| 20 to 34 years | 0 (0.0%) | 0.0 |
| 35 to 50 years | 0 (0.0%) | 0.0 |
| Total | 0 (0.0%) | 0.0 |
Fertility by Age by Marriage Status in Phoenix
| Age Bracket | Married | Unmarried |
| 15 to 19 years | 0 (0.0%) | 0 (0.0%) |
| 20 to 34 years | 0 (0.0%) | 0 (0.0%) |
| 35 to 50 years | 0 (0.0%) | 0 (0.0%) |
| Total | 0 (0.0%) | 0 (0.0%) |
Fertility by Education in Phoenix
| Educational Attainment | Women with Births | Births / 1,000 Women |
| Less than High School | 0 (0.0%) | 0.0 |
| High School Diploma | 0 (0.0%) | 0.0 |
| College or Associate's Degree | 0 (0.0%) | 0.0 |
| Bachelor's Degree | 0 (0.0%) | 0.0 |
| Graduate Degree | 0 (0.0%) | 0.0 |
| Total | 0 (0.0%) | 0.0 |
Fertility by Education by Marriage Status in Phoenix
| Educational Attainment | Married | Unmarried |
| Less than High School | 0 (0.0%) | 0 (0.0%) |
| High School Diploma | 0 (0.0%) | 0 (0.0%) |
| College or Associate's Degree | 0 (0.0%) | 0 (0.0%) |
| Bachelor's Degree | 0 (0.0%) | 0 (0.0%) |
| Graduate Degree | 0 (0.0%) | 0 (0.0%) |
| Total | 0 (0.0%) | 0 (0.0%) |
Income in Phoenix
Income Overview in Phoenix
Per Capita Income in Phoenix is $24,007, while median incomes of families and households are $40,179 and $24,491 respectively.
| Characteristic | Number | Measure |
| Per Capita Income | 1,278 | $24,007 |
| Median Family Income | 258 | $40,179 |
| Mean Family Income | 258 | $54,712 |
| Median Household Income | 633 | $24,491 |
| Mean Household Income | 633 | $46,069 |
| Income Deficit | 258 | $11,451 |
| Wage / Income Gap (%) | 1,278 | 21.71% |
| Wage / Income Gap ($) | 1,278 | 78.29¢ per $1 |
| Gini / Inequality Index | 1,278 | 0.47 |
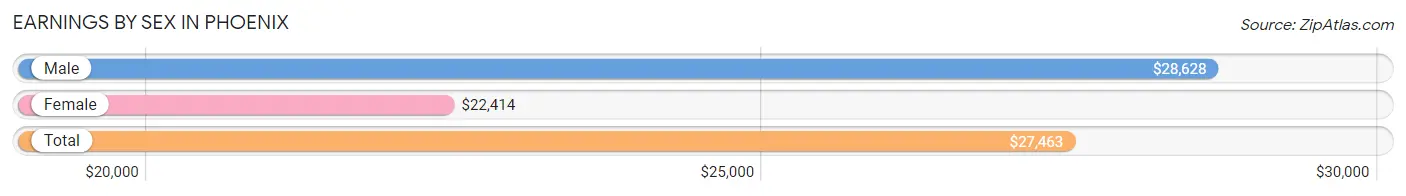
Earnings by Sex in Phoenix
Average Earnings in Phoenix are $27,463, $28,628 for men and $22,414 for women, a difference of 21.7%.
| Sex | Number | Average Earnings |
| Male | 315 (54.2%) | $28,628 |
| Female | 266 (45.8%) | $22,414 |
| Total | 581 (100.0%) | $27,463 |
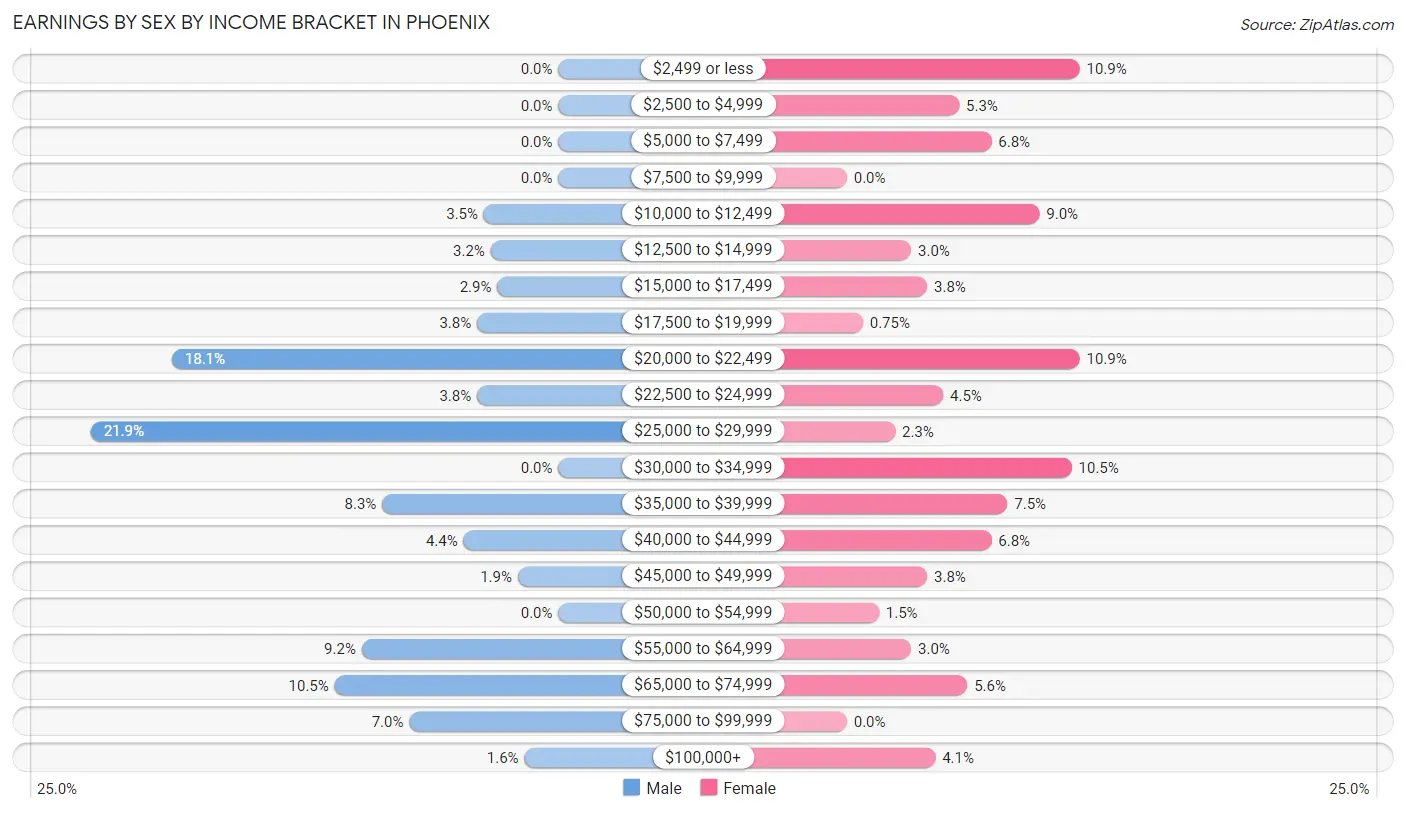
Earnings by Sex by Income Bracket in Phoenix
The most common earnings brackets in Phoenix are $25,000 to $29,999 for men (69 | 21.9%) and $2,499 or less for women (29 | 10.9%).
| Income | Male | Female |
| $2,499 or less | 0 (0.0%) | 29 (10.9%) |
| $2,500 to $4,999 | 0 (0.0%) | 14 (5.3%) |
| $5,000 to $7,499 | 0 (0.0%) | 18 (6.8%) |
| $7,500 to $9,999 | 0 (0.0%) | 0 (0.0%) |
| $10,000 to $12,499 | 11 (3.5%) | 24 (9.0%) |
| $12,500 to $14,999 | 10 (3.2%) | 8 (3.0%) |
| $15,000 to $17,499 | 9 (2.9%) | 10 (3.8%) |
| $17,500 to $19,999 | 12 (3.8%) | 2 (0.7%) |
| $20,000 to $22,499 | 57 (18.1%) | 29 (10.9%) |
| $22,500 to $24,999 | 12 (3.8%) | 12 (4.5%) |
| $25,000 to $29,999 | 69 (21.9%) | 6 (2.3%) |
| $30,000 to $34,999 | 0 (0.0%) | 28 (10.5%) |
| $35,000 to $39,999 | 26 (8.3%) | 20 (7.5%) |
| $40,000 to $44,999 | 14 (4.4%) | 18 (6.8%) |
| $45,000 to $49,999 | 6 (1.9%) | 10 (3.8%) |
| $50,000 to $54,999 | 0 (0.0%) | 4 (1.5%) |
| $55,000 to $64,999 | 29 (9.2%) | 8 (3.0%) |
| $65,000 to $74,999 | 33 (10.5%) | 15 (5.6%) |
| $75,000 to $99,999 | 22 (7.0%) | 0 (0.0%) |
| $100,000+ | 5 (1.6%) | 11 (4.1%) |
| Total | 315 (100.0%) | 266 (100.0%) |
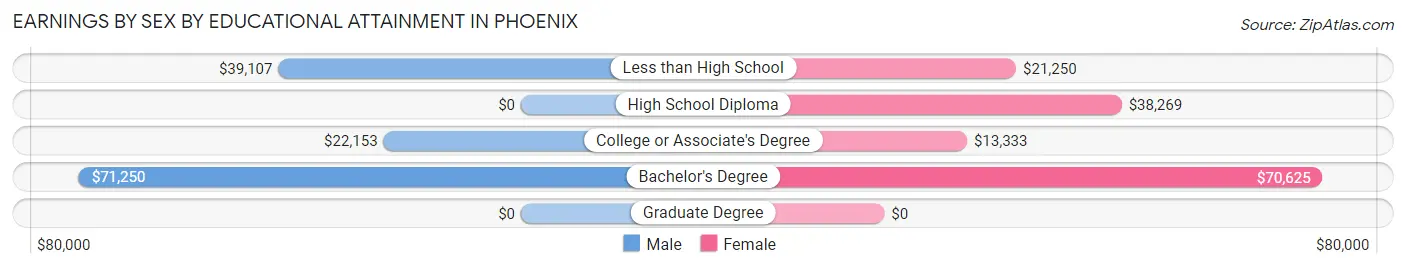
Earnings by Sex by Educational Attainment in Phoenix
Average earnings in Phoenix are $29,595 for men and $23,750 for women, a difference of 19.8%. Men with an educational attainment of bachelor's degree enjoy the highest average annual earnings of $71,250, while those with college or associate's degree education earn the least with $22,153. Women with an educational attainment of bachelor's degree earn the most with the average annual earnings of $70,625, while those with college or associate's degree education have the smallest earnings of $13,333.
| Educational Attainment | Male Income | Female Income |
| Less than High School | $39,107 | $21,250 |
| High School Diploma | - | - |
| College or Associate's Degree | $22,153 | $13,333 |
| Bachelor's Degree | $71,250 | $70,625 |
| Graduate Degree | - | - |
| Total | $29,595 | $23,750 |
Family Income in Phoenix
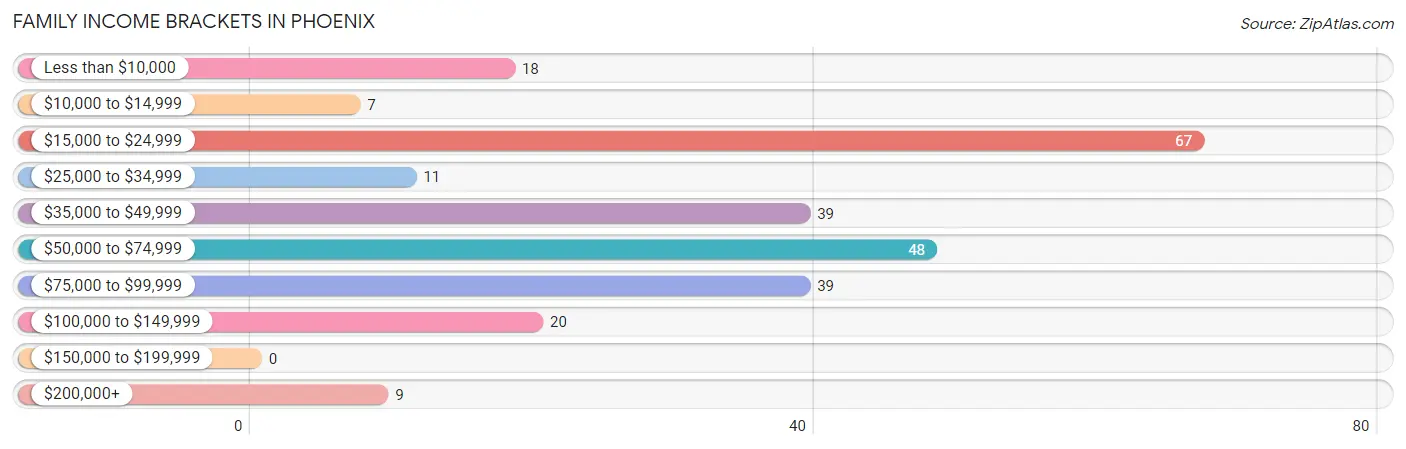
Family Income Brackets in Phoenix
According to the Phoenix family income data, there are 67 families falling into the $15,000 to $24,999 income range, which is the most common income bracket and makes up 26.0% of all families.
| Income Bracket | # Families | % Families |
| Less than $10,000 | 18 | 7.0% |
| $10,000 to $14,999 | 7 | 2.7% |
| $15,000 to $24,999 | 67 | 26.0% |
| $25,000 to $34,999 | 11 | 4.3% |
| $35,000 to $49,999 | 39 | 15.1% |
| $50,000 to $74,999 | 48 | 18.6% |
| $75,000 to $99,999 | 39 | 15.1% |
| $100,000 to $149,999 | 20 | 7.8% |
| $150,000 to $199,999 | 0 | 0.0% |
| $200,000+ | 9 | 3.5% |
Family Income by Famaliy Size in Phoenix
3-person families (61 | 23.6%) account for the highest median family income in Phoenix with $54,375 per family, while 2-person families (154 | 59.7%) have the highest median income of $19,062 per family member.
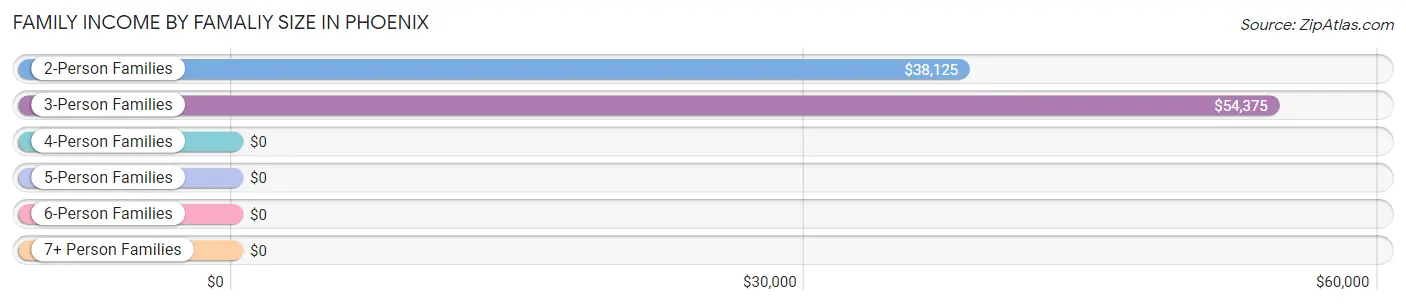
| Income Bracket | # Families | Median Income |
| 2-Person Families | 154 (59.7%) | $38,125 |
| 3-Person Families | 61 (23.6%) | $54,375 |
| 4-Person Families | 13 (5.0%) | $0 |
| 5-Person Families | 21 (8.1%) | $0 |
| 6-Person Families | 9 (3.5%) | $0 |
| 7+ Person Families | 0 (0.0%) | $0 |
| Total | 258 (100.0%) | $40,179 |
Family Income by Number of Earners in Phoenix
The median family income in Phoenix is $40,179, with families comprising 3+ earners (18) having the highest median family income of $118,750, while families with no earners (60) have the lowest median family income of $19,375, accounting for 7.0% and 23.3% of families, respectively.
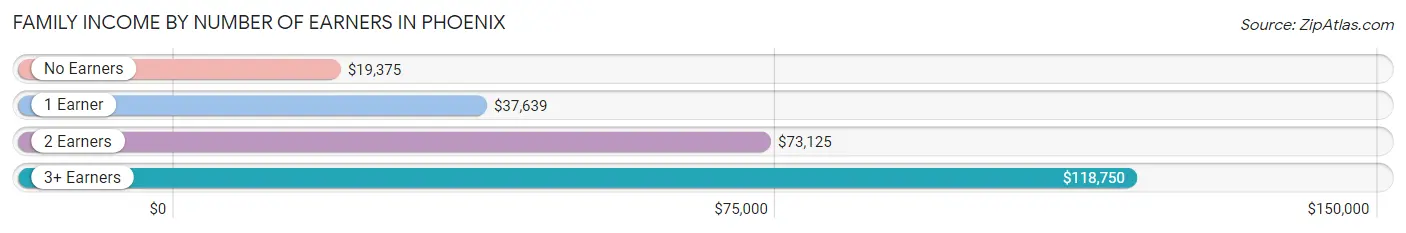
| Number of Earners | # Families | Median Income |
| No Earners | 60 (23.3%) | $19,375 |
| 1 Earner | 108 (41.9%) | $37,639 |
| 2 Earners | 72 (27.9%) | $73,125 |
| 3+ Earners | 18 (7.0%) | $118,750 |
| Total | 258 (100.0%) | $40,179 |
Household Income in Phoenix
Household Income Brackets in Phoenix
With 202 households falling in the category, the $15,000 to $24,999 income range is the most frequent in Phoenix, accounting for 31.9% of all households.
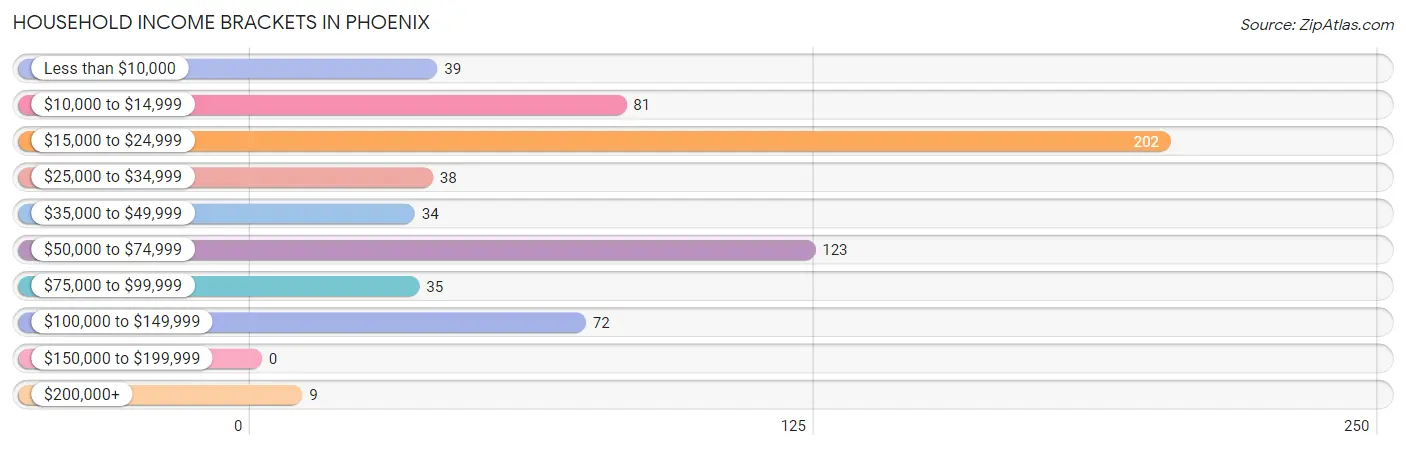
| Income Bracket | # Households | % Households |
| Less than $10,000 | 39 | 6.2% |
| $10,000 to $14,999 | 81 | 12.8% |
| $15,000 to $24,999 | 202 | 31.9% |
| $25,000 to $34,999 | 38 | 6.0% |
| $35,000 to $49,999 | 34 | 5.4% |
| $50,000 to $74,999 | 123 | 19.4% |
| $75,000 to $99,999 | 35 | 5.5% |
| $100,000 to $149,999 | 72 | 11.4% |
| $150,000 to $199,999 | 0 | 0.0% |
| $200,000+ | 9 | 1.4% |
Household Income by Householder Age in Phoenix
The median household income in Phoenix is $24,491, with the highest median household income of $46,250 found in the 25 to 44 years age bracket for the primary householder. A total of 72 households (11.4%) fall into this category. Meanwhile, the 15 to 24 years age bracket for the primary householder has the lowest median household income of $0, with 21 households (3.3%) in this group.
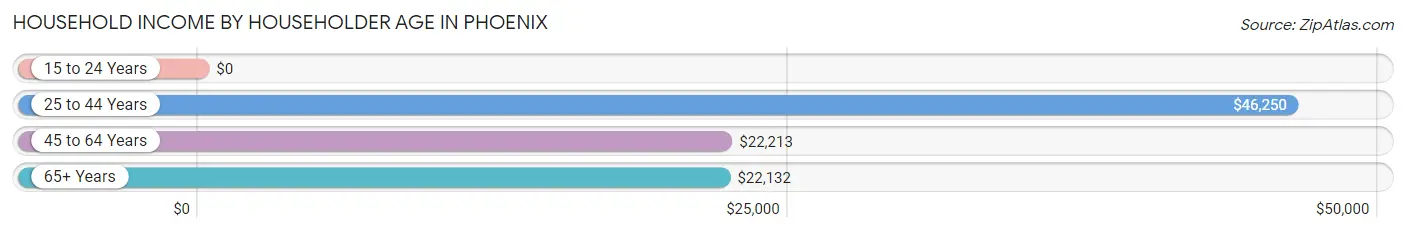
| Income Bracket | # Households | Median Income |
| 15 to 24 Years | 21 (3.3%) | $0 |
| 25 to 44 Years | 72 (11.4%) | $46,250 |
| 45 to 64 Years | 250 (39.5%) | $22,213 |
| 65+ Years | 290 (45.8%) | $22,132 |
| Total | 633 (100.0%) | $24,491 |
Poverty in Phoenix
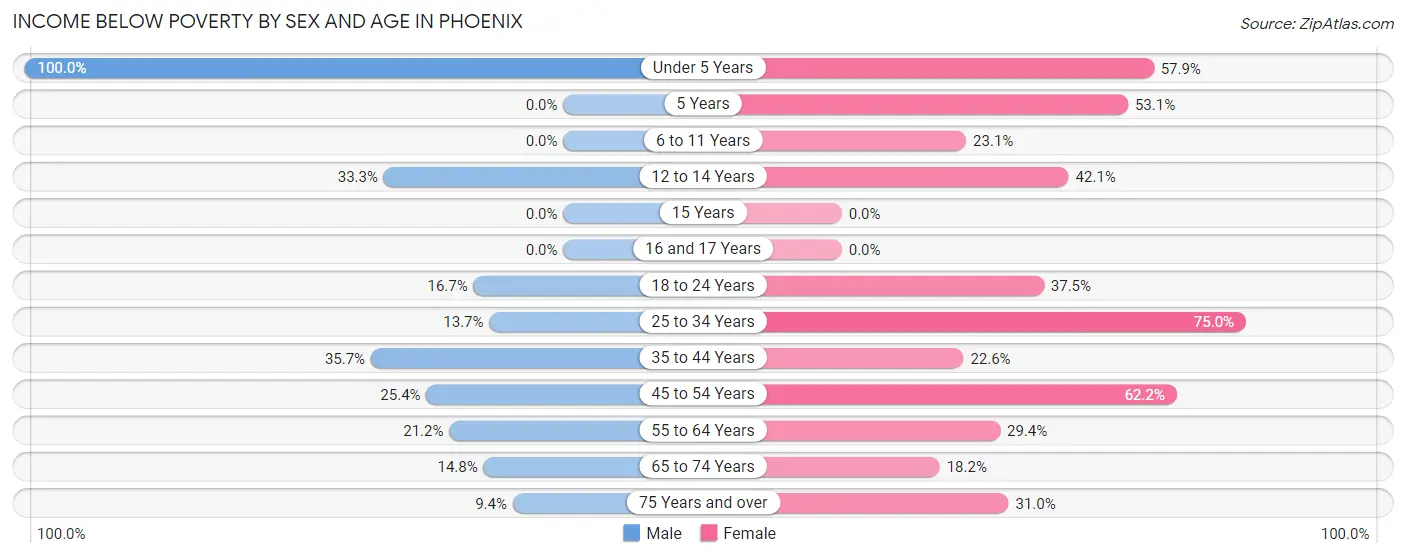
Income Below Poverty by Sex and Age in Phoenix
With 23.6% poverty level for males and 35.2% for females among the residents of Phoenix, under 5 year old males and 25 to 34 year old females are the most vulnerable to poverty, with 32 males (100.0%) and 45 females (75.0%) in their respective age groups living below the poverty level.
| Age Bracket | Male | Female |
| Under 5 Years | 32 (100.0%) | 11 (57.9%) |
| 5 Years | 0 (0.0%) | 17 (53.1%) |
| 6 to 11 Years | 0 (0.0%) | 6 (23.1%) |
| 12 to 14 Years | 4 (33.3%) | 8 (42.1%) |
| 15 Years | 0 (0.0%) | 0 (0.0%) |
| 16 and 17 Years | 0 (0.0%) | 0 (0.0%) |
| 18 to 24 Years | 13 (16.7%) | 30 (37.5%) |
| 25 to 34 Years | 7 (13.7%) | 45 (75.0%) |
| 35 to 44 Years | 20 (35.7%) | 14 (22.6%) |
| 45 to 54 Years | 15 (25.4%) | 23 (62.2%) |
| 55 to 64 Years | 29 (21.2%) | 42 (29.4%) |
| 65 to 74 Years | 12 (14.8%) | 26 (18.2%) |
| 75 Years and over | 3 (9.4%) | 26 (30.9%) |
| Total | 135 (23.6%) | 248 (35.2%) |
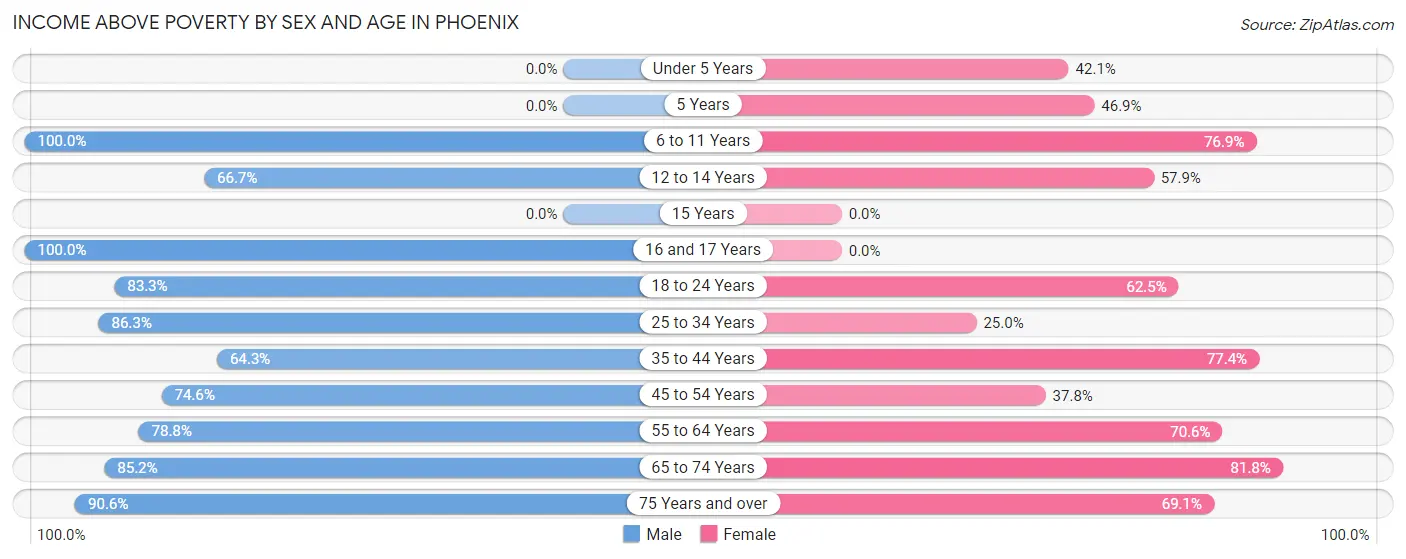
Income Above Poverty by Sex and Age in Phoenix
According to the poverty statistics in Phoenix, males aged 6 to 11 years and females aged 65 to 74 years are the age groups that are most secure financially, with 100.0% of males and 81.8% of females in these age groups living above the poverty line.
| Age Bracket | Male | Female |
| Under 5 Years | 0 (0.0%) | 8 (42.1%) |
| 5 Years | 0 (0.0%) | 15 (46.9%) |
| 6 to 11 Years | 28 (100.0%) | 20 (76.9%) |
| 12 to 14 Years | 8 (66.7%) | 11 (57.9%) |
| 15 Years | 0 (0.0%) | 0 (0.0%) |
| 16 and 17 Years | 7 (100.0%) | 0 (0.0%) |
| 18 to 24 Years | 65 (83.3%) | 50 (62.5%) |
| 25 to 34 Years | 44 (86.3%) | 15 (25.0%) |
| 35 to 44 Years | 36 (64.3%) | 48 (77.4%) |
| 45 to 54 Years | 44 (74.6%) | 14 (37.8%) |
| 55 to 64 Years | 108 (78.8%) | 101 (70.6%) |
| 65 to 74 Years | 69 (85.2%) | 117 (81.8%) |
| 75 Years and over | 29 (90.6%) | 58 (69.1%) |
| Total | 438 (76.4%) | 457 (64.8%) |
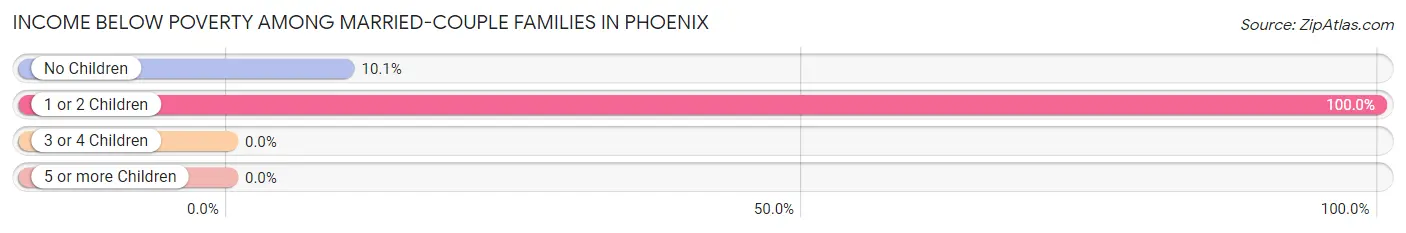
Income Below Poverty Among Married-Couple Families in Phoenix
The poverty statistics for married-couple families in Phoenix show that 20.5% or 16 of the total 78 families live below the poverty line. Families with 1 or 2 children have the highest poverty rate of 100.0%, comprising of 9 families. On the other hand, families with no children have the lowest poverty rate of 10.1%, which includes 7 families.
| Children | Above Poverty | Below Poverty |
| No Children | 62 (89.9%) | 7 (10.1%) |
| 1 or 2 Children | 0 (0.0%) | 9 (100.0%) |
| 3 or 4 Children | 0 (0.0%) | 0 (0.0%) |
| 5 or more Children | 0 (0.0%) | 0 (0.0%) |
| Total | 62 (79.5%) | 16 (20.5%) |
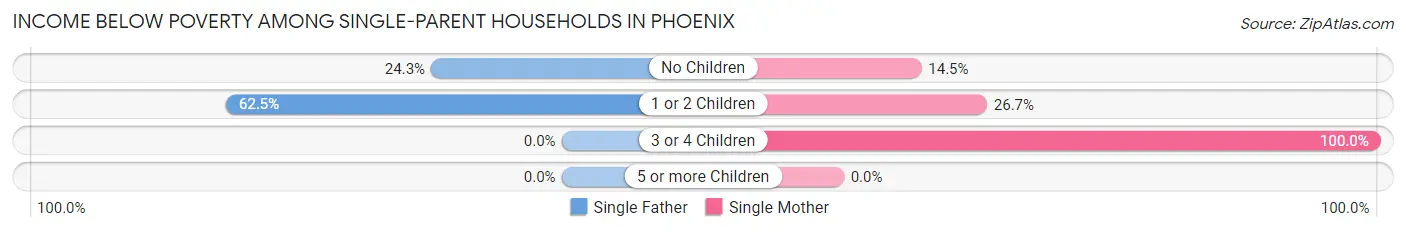
Income Below Poverty Among Single-Parent Households in Phoenix
According to the poverty data in Phoenix, 28.4% or 19 single-father households and 23.0% or 26 single-mother households are living below the poverty line. Among single-father households, those with 1 or 2 children have the highest poverty rate, with 10 households (62.5%) experiencing poverty. Likewise, among single-mother households, those with 3 or 4 children have the highest poverty rate, with 7 households (100.0%) falling below the poverty line.
| Children | Single Father | Single Mother |
| No Children | 9 (24.3%) | 11 (14.5%) |
| 1 or 2 Children | 10 (62.5%) | 8 (26.7%) |
| 3 or 4 Children | 0 (0.0%) | 7 (100.0%) |
| 5 or more Children | 0 (0.0%) | 0 (0.0%) |
| Total | 19 (28.4%) | 26 (23.0%) |
Income Below Poverty Among Married-Couple vs Single-Parent Households in Phoenix
The poverty data for Phoenix shows that 16 of the married-couple family households (20.5%) and 45 of the single-parent households (25.0%) are living below the poverty level. Within the married-couple family households, those with 1 or 2 children have the highest poverty rate, with 9 households (100.0%) falling below the poverty line. Among the single-parent households, those with 1 or 2 children have the highest poverty rate, with 18 household (39.1%) living below poverty.
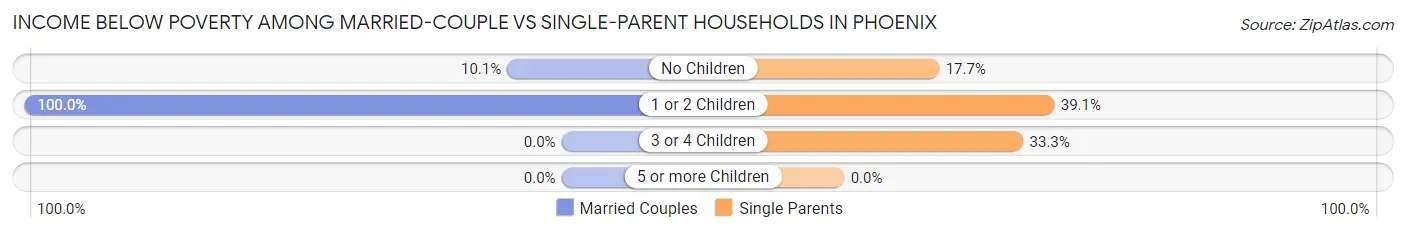
| Children | Married-Couple Families | Single-Parent Households |
| No Children | 7 (10.1%) | 20 (17.7%) |
| 1 or 2 Children | 9 (100.0%) | 18 (39.1%) |
| 3 or 4 Children | 0 (0.0%) | 7 (33.3%) |
| 5 or more Children | 0 (0.0%) | 0 (0.0%) |
| Total | 16 (20.5%) | 45 (25.0%) |
Employment Characteristics in Phoenix
Employment by Class of Employer in Phoenix
Among the 507 employed individuals in Phoenix, private company employees (289 | 57.0%), not-for-profit organizations (61 | 12.0%), and self-employed (incorporated) (55 | 10.8%) make up the most common classes of employment.
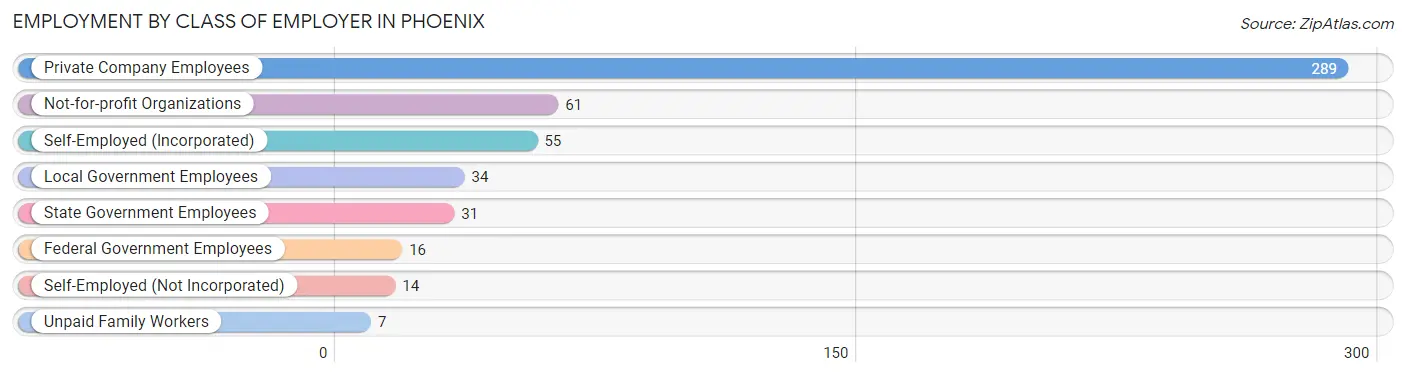
| Employer Class | # Employees | % Employees |
| Private Company Employees | 289 | 57.0% |
| Self-Employed (Incorporated) | 55 | 10.8% |
| Self-Employed (Not Incorporated) | 14 | 2.8% |
| Not-for-profit Organizations | 61 | 12.0% |
| Local Government Employees | 34 | 6.7% |
| State Government Employees | 31 | 6.1% |
| Federal Government Employees | 16 | 3.2% |
| Unpaid Family Workers | 7 | 1.4% |
| Total | 507 | 100.0% |
Employment Status by Age in Phoenix
According to the labor force statistics for Phoenix, out of the total population over 16 years of age (1,110), 58.9% or 654 individuals are in the labor force, with 20.5% or 134 of them unemployed. The age group with the highest labor force participation rate is 20 to 24 years, with 89.3% or 109 individuals in the labor force. Within the labor force, the 16 to 19 years age range has the highest percentage of unemployed individuals, with 57.7% or 15 of them being unemployed.
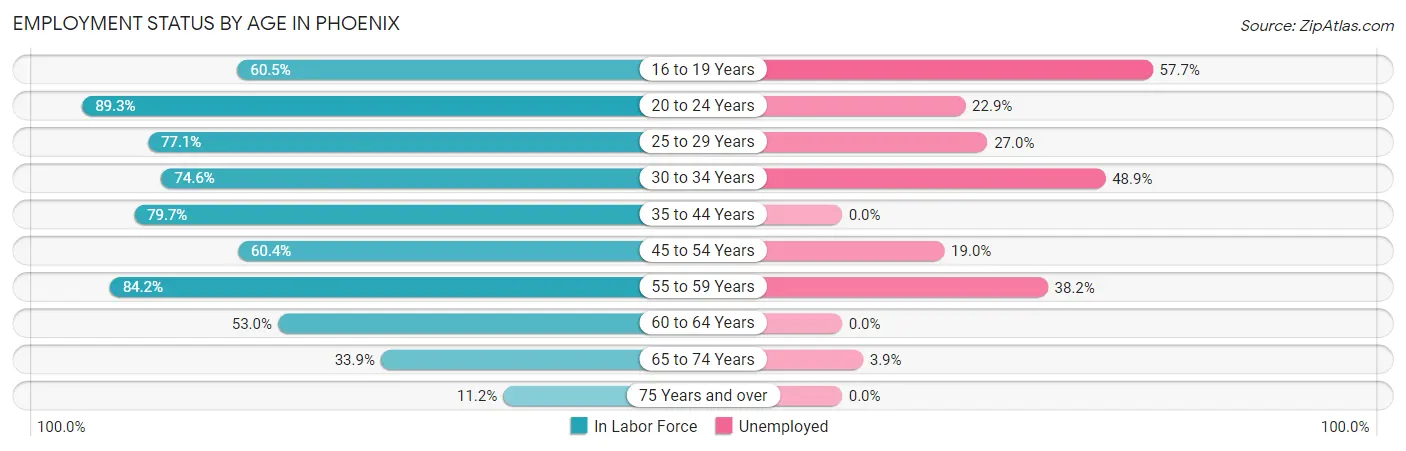
| Age Bracket | In Labor Force | Unemployed |
| 16 to 19 Years | 26 (60.5%) | 15 (57.7%) |
| 20 to 24 Years | 109 (89.3%) | 25 (22.9%) |
| 25 to 29 Years | 37 (77.1%) | 10 (27.0%) |
| 30 to 34 Years | 47 (74.6%) | 23 (48.9%) |
| 35 to 44 Years | 94 (79.7%) | 0 (0.0%) |
| 45 to 54 Years | 58 (60.4%) | 11 (19.0%) |
| 55 to 59 Years | 123 (84.2%) | 47 (38.2%) |
| 60 to 64 Years | 71 (53.0%) | 0 (0.0%) |
| 65 to 74 Years | 76 (33.9%) | 3 (3.9%) |
| 75 Years and over | 13 (11.2%) | 0 (0.0%) |
| Total | 654 (58.9%) | 134 (20.5%) |
Employment Status by Educational Attainment in Phoenix
According to labor force statistics for Phoenix, 71.1% of individuals (430) out of the total population between 25 and 64 years of age (605) are in the labor force, with 21.2% or 91 of them being unemployed. The group with the highest labor force participation rate are those with the educational attainment of bachelor's degree or higher, with 100.0% or 64 individuals in the labor force. Within the labor force, individuals with college / associate degree education have the highest percentage of unemployment, with 37.6% or 64 of them being unemployed.
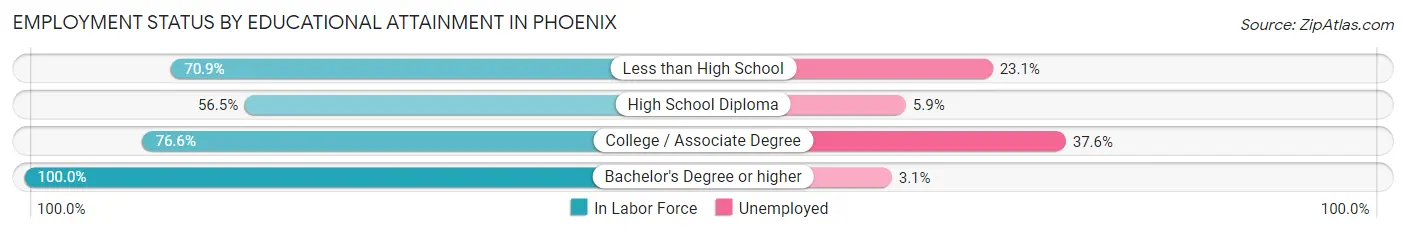
| Educational Attainment | In Labor Force | Unemployed |
| Less than High School | 78 (70.9%) | 25 (23.1%) |
| High School Diploma | 118 (56.5%) | 12 (5.9%) |
| College / Associate Degree | 170 (76.6%) | 83 (37.6%) |
| Bachelor's Degree or higher | 64 (100.0%) | 2 (3.1%) |
| Total | 430 (71.1%) | 128 (21.2%) |
Employment Occupations by Sex in Phoenix
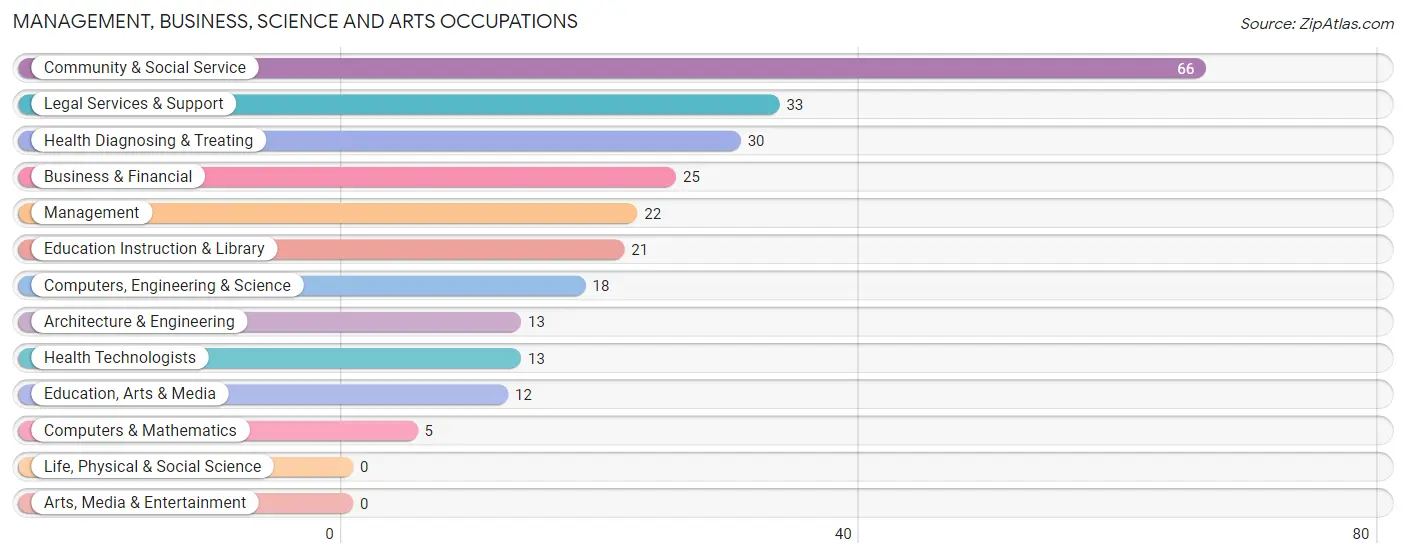
Management, Business, Science and Arts Occupations
The most common Management, Business, Science and Arts occupations in Phoenix are Community & Social Service (66 | 12.7%), Legal Services & Support (33 | 6.4%), Health Diagnosing & Treating (30 | 5.8%), Business & Financial (25 | 4.8%), and Management (22 | 4.2%).
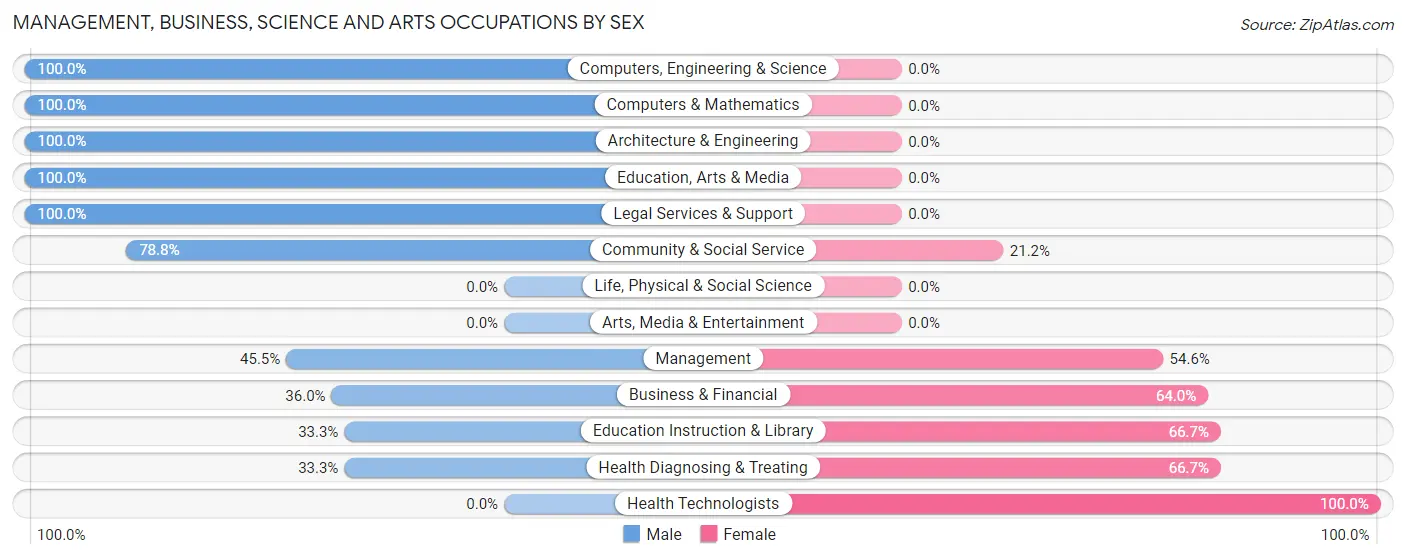
Management, Business, Science and Arts Occupations by Sex
Within the Management, Business, Science and Arts occupations in Phoenix, the most male-oriented occupations are Computers, Engineering & Science (100.0%), Computers & Mathematics (100.0%), and Architecture & Engineering (100.0%), while the most female-oriented occupations are Health Technologists (100.0%), Education Instruction & Library (66.7%), and Health Diagnosing & Treating (66.7%).
| Occupation | Male | Female |
| Management | 10 (45.5%) | 12 (54.5%) |
| Business & Financial | 9 (36.0%) | 16 (64.0%) |
| Computers, Engineering & Science | 18 (100.0%) | 0 (0.0%) |
| Computers & Mathematics | 5 (100.0%) | 0 (0.0%) |
| Architecture & Engineering | 13 (100.0%) | 0 (0.0%) |
| Life, Physical & Social Science | 0 (0.0%) | 0 (0.0%) |
| Community & Social Service | 52 (78.8%) | 14 (21.2%) |
| Education, Arts & Media | 12 (100.0%) | 0 (0.0%) |
| Legal Services & Support | 33 (100.0%) | 0 (0.0%) |
| Education Instruction & Library | 7 (33.3%) | 14 (66.7%) |
| Arts, Media & Entertainment | 0 (0.0%) | 0 (0.0%) |
| Health Diagnosing & Treating | 10 (33.3%) | 20 (66.7%) |
| Health Technologists | 0 (0.0%) | 13 (100.0%) |
| Total (Category) | 99 (61.5%) | 62 (38.5%) |
| Total (Overall) | 294 (56.5%) | 226 (43.5%) |
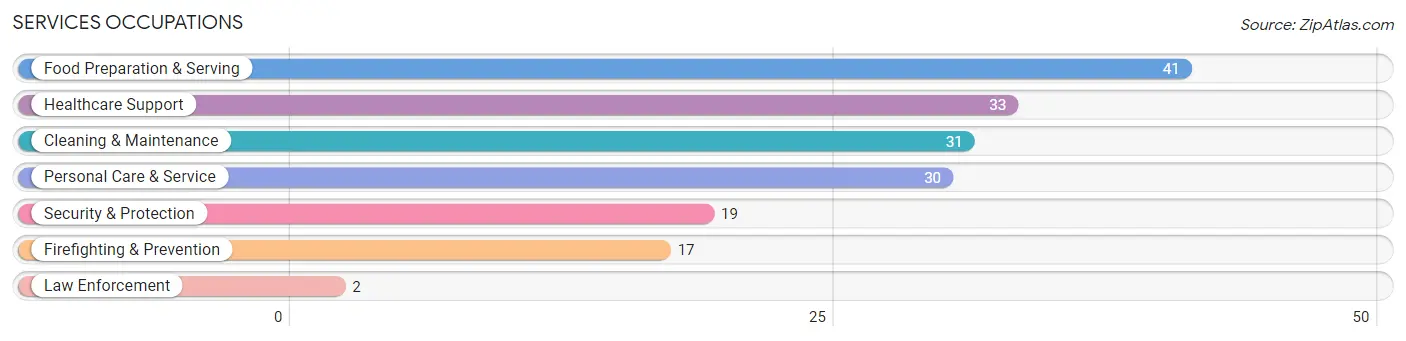
Services Occupations
The most common Services occupations in Phoenix are Food Preparation & Serving (41 | 7.9%), Healthcare Support (33 | 6.4%), Cleaning & Maintenance (31 | 6.0%), Personal Care & Service (30 | 5.8%), and Security & Protection (19 | 3.6%).
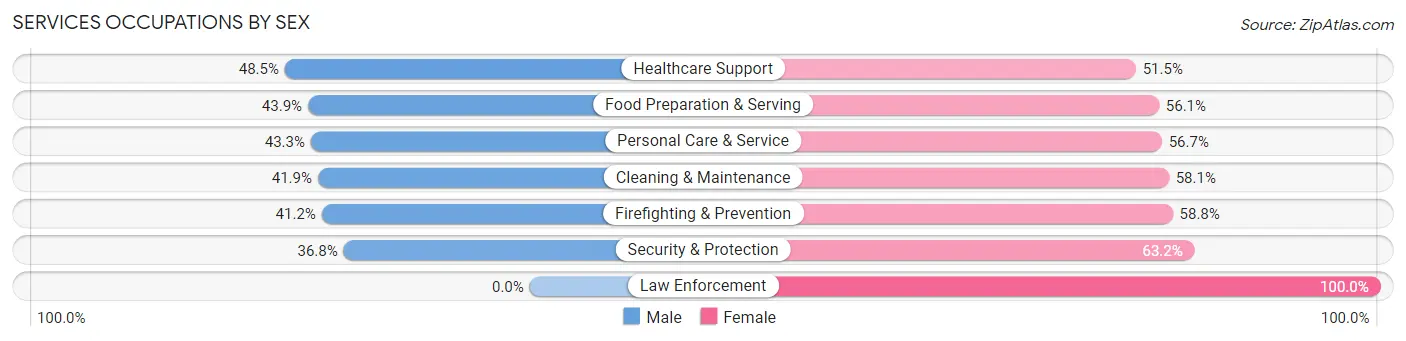
Services Occupations by Sex
Within the Services occupations in Phoenix, the most male-oriented occupations are Healthcare Support (48.5%), Food Preparation & Serving (43.9%), and Personal Care & Service (43.3%), while the most female-oriented occupations are Law Enforcement (100.0%), Security & Protection (63.2%), and Firefighting & Prevention (58.8%).
| Occupation | Male | Female |
| Healthcare Support | 16 (48.5%) | 17 (51.5%) |
| Security & Protection | 7 (36.8%) | 12 (63.2%) |
| Firefighting & Prevention | 7 (41.2%) | 10 (58.8%) |
| Law Enforcement | 0 (0.0%) | 2 (100.0%) |
| Food Preparation & Serving | 18 (43.9%) | 23 (56.1%) |
| Cleaning & Maintenance | 13 (41.9%) | 18 (58.1%) |
| Personal Care & Service | 13 (43.3%) | 17 (56.7%) |
| Total (Category) | 67 (43.5%) | 87 (56.5%) |
| Total (Overall) | 294 (56.5%) | 226 (43.5%) |
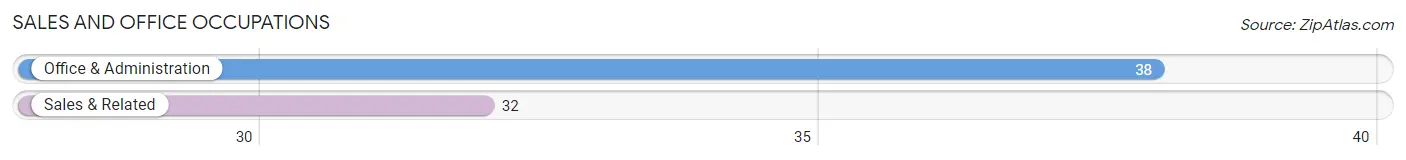
Sales and Office Occupations
The most common Sales and Office occupations in Phoenix are Office & Administration (38 | 7.3%), and Sales & Related (32 | 6.1%).
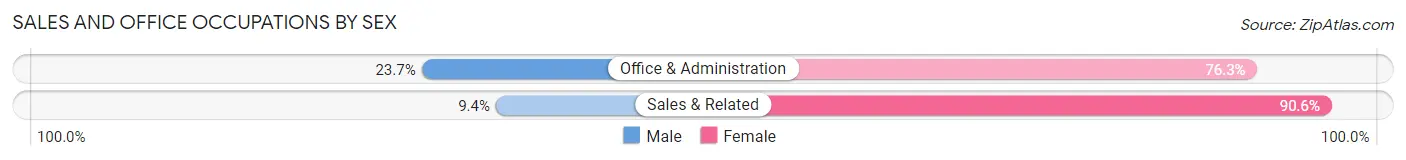
Sales and Office Occupations by Sex
| Occupation | Male | Female |
| Sales & Related | 3 (9.4%) | 29 (90.6%) |
| Office & Administration | 9 (23.7%) | 29 (76.3%) |
| Total (Category) | 12 (17.1%) | 58 (82.9%) |
| Total (Overall) | 294 (56.5%) | 226 (43.5%) |
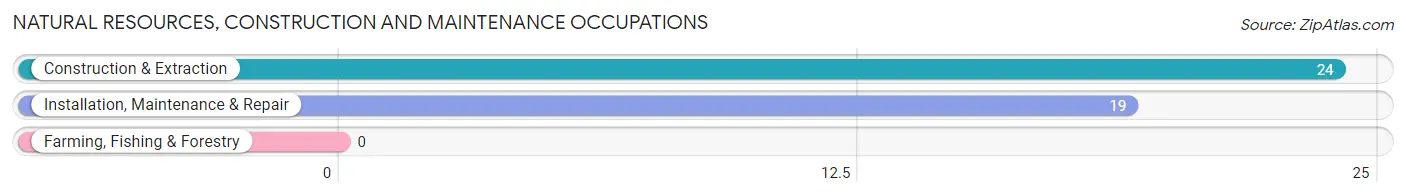
Natural Resources, Construction and Maintenance Occupations
The most common Natural Resources, Construction and Maintenance occupations in Phoenix are Construction & Extraction (24 | 4.6%), and Installation, Maintenance & Repair (19 | 3.6%).
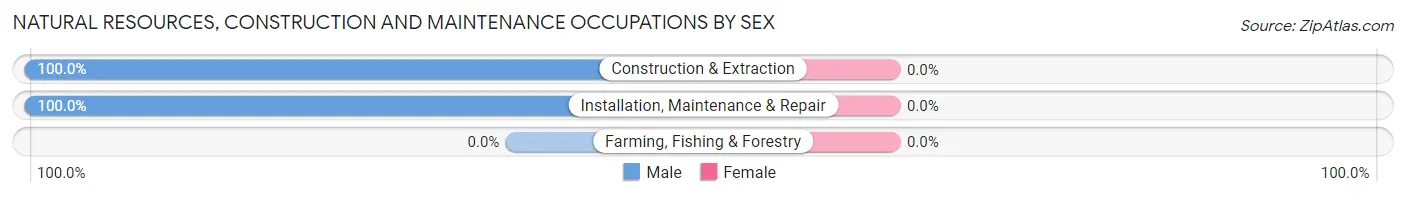
Natural Resources, Construction and Maintenance Occupations by Sex
| Occupation | Male | Female |
| Farming, Fishing & Forestry | 0 (0.0%) | 0 (0.0%) |
| Construction & Extraction | 24 (100.0%) | 0 (0.0%) |
| Installation, Maintenance & Repair | 19 (100.0%) | 0 (0.0%) |
| Total (Category) | 43 (100.0%) | 0 (0.0%) |
| Total (Overall) | 294 (56.5%) | 226 (43.5%) |
Production, Transportation and Moving Occupations
The most common Production, Transportation and Moving occupations in Phoenix are Transportation (38 | 7.3%), Material Moving (37 | 7.1%), and Production (17 | 3.3%).
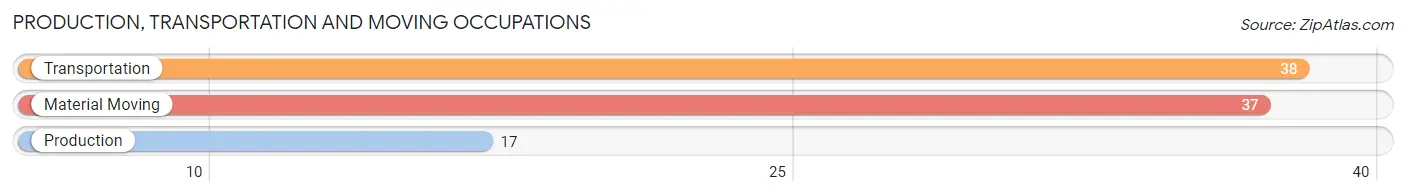
Production, Transportation and Moving Occupations by Sex
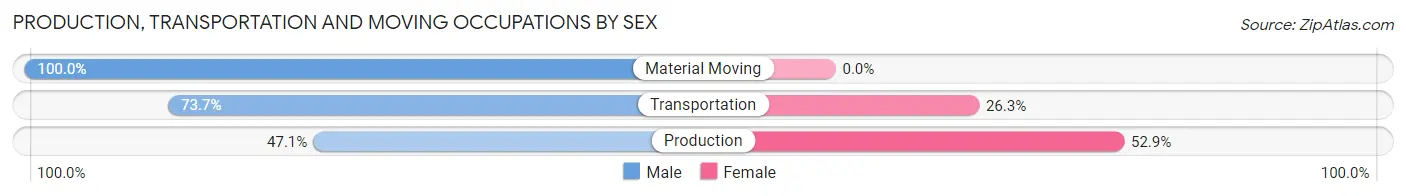
| Occupation | Male | Female |
| Production | 8 (47.1%) | 9 (52.9%) |
| Transportation | 28 (73.7%) | 10 (26.3%) |
| Material Moving | 37 (100.0%) | 0 (0.0%) |
| Total (Category) | 73 (79.3%) | 19 (20.6%) |
| Total (Overall) | 294 (56.5%) | 226 (43.5%) |
Employment Industries by Sex in Phoenix
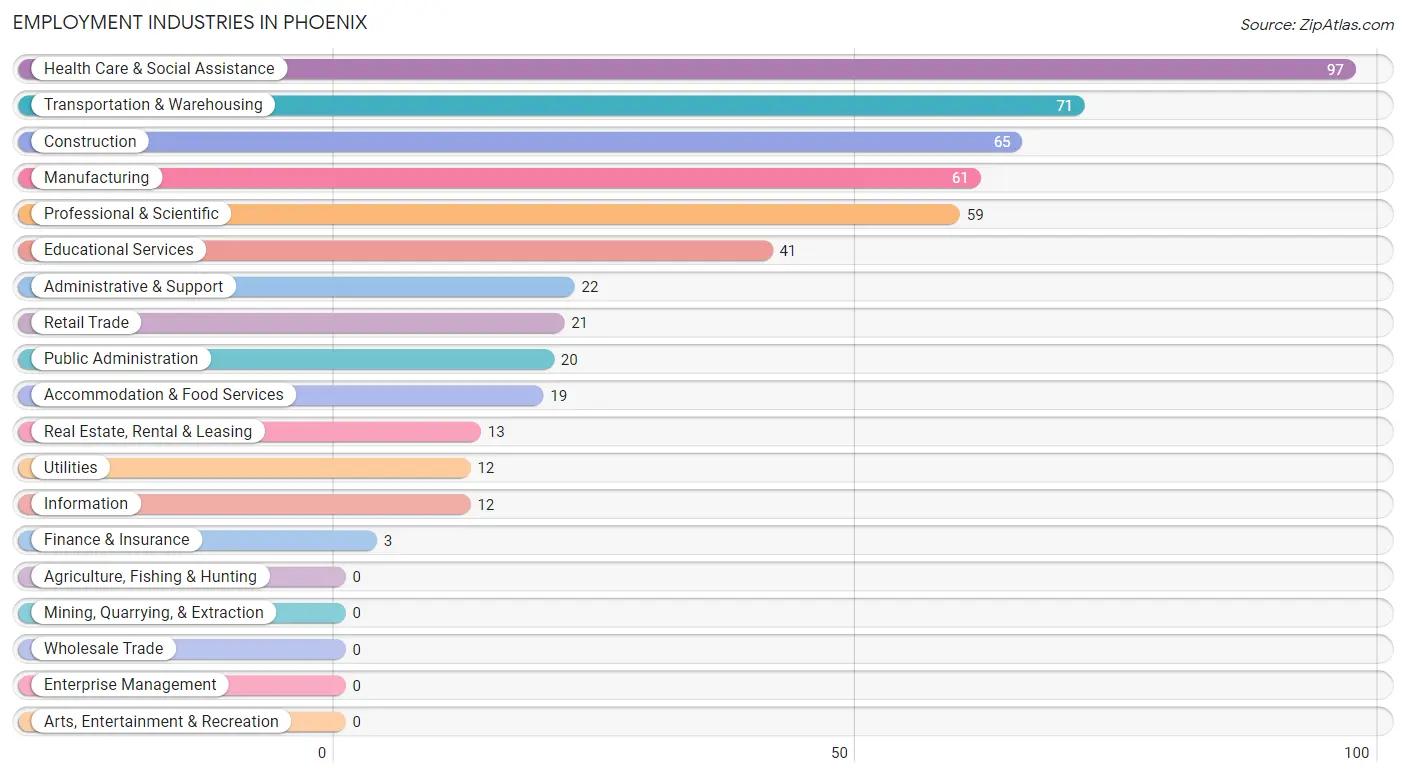
Employment Industries in Phoenix
The major employment industries in Phoenix include Health Care & Social Assistance (97 | 18.6%), Transportation & Warehousing (71 | 13.7%), Construction (65 | 12.5%), Manufacturing (61 | 11.7%), and Professional & Scientific (59 | 11.4%).
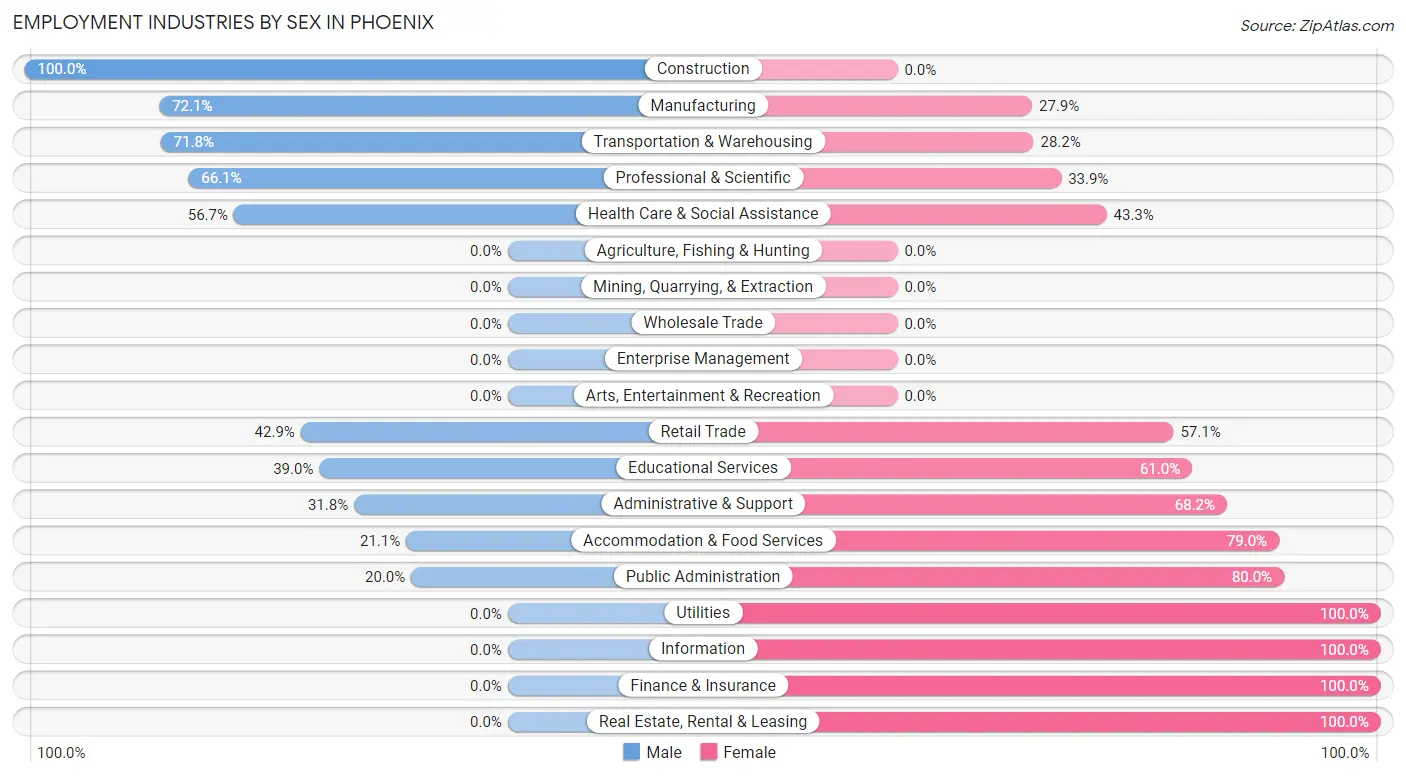
Employment Industries by Sex in Phoenix
The Phoenix industries that see more men than women are Construction (100.0%), Manufacturing (72.1%), and Transportation & Warehousing (71.8%), whereas the industries that tend to have a higher number of women are Utilities (100.0%), Information (100.0%), and Finance & Insurance (100.0%).
| Industry | Male | Female |
| Agriculture, Fishing & Hunting | 0 (0.0%) | 0 (0.0%) |
| Mining, Quarrying, & Extraction | 0 (0.0%) | 0 (0.0%) |
| Construction | 65 (100.0%) | 0 (0.0%) |
| Manufacturing | 44 (72.1%) | 17 (27.9%) |
| Wholesale Trade | 0 (0.0%) | 0 (0.0%) |
| Retail Trade | 9 (42.9%) | 12 (57.1%) |
| Transportation & Warehousing | 51 (71.8%) | 20 (28.2%) |
| Utilities | 0 (0.0%) | 12 (100.0%) |
| Information | 0 (0.0%) | 12 (100.0%) |
| Finance & Insurance | 0 (0.0%) | 3 (100.0%) |
| Real Estate, Rental & Leasing | 0 (0.0%) | 13 (100.0%) |
| Professional & Scientific | 39 (66.1%) | 20 (33.9%) |
| Enterprise Management | 0 (0.0%) | 0 (0.0%) |
| Administrative & Support | 7 (31.8%) | 15 (68.2%) |
| Educational Services | 16 (39.0%) | 25 (61.0%) |
| Health Care & Social Assistance | 55 (56.7%) | 42 (43.3%) |
| Arts, Entertainment & Recreation | 0 (0.0%) | 0 (0.0%) |
| Accommodation & Food Services | 4 (21.0%) | 15 (78.9%) |
| Public Administration | 4 (20.0%) | 16 (80.0%) |
| Total | 294 (56.5%) | 226 (43.5%) |
Education in Phoenix
School Enrollment in Phoenix
The most common levels of schooling among the 174 students in Phoenix are elementary school (54 | 31.0%), high school (38 | 21.8%), and college / undergraduate (34 | 19.5%).
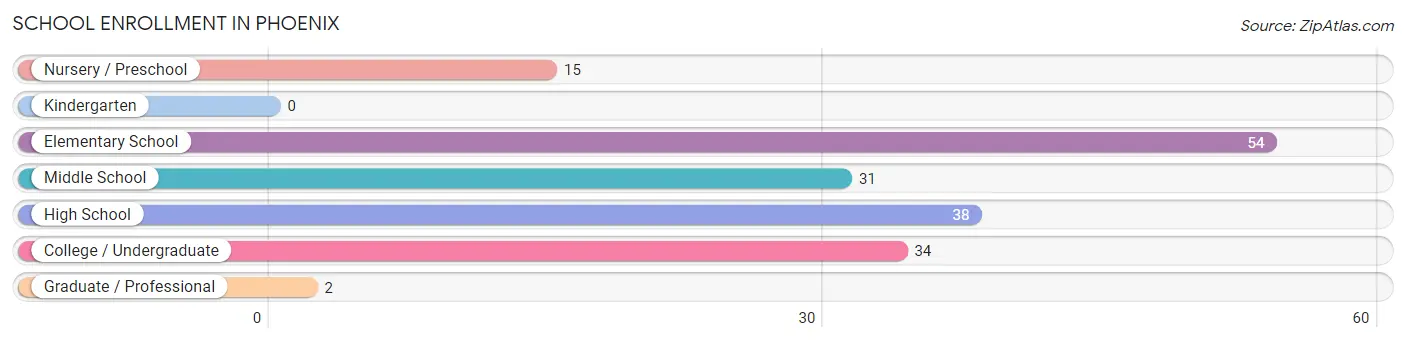
| School Level | # Students | % Students |
| Nursery / Preschool | 15 | 8.6% |
| Kindergarten | 0 | 0.0% |
| Elementary School | 54 | 31.0% |
| Middle School | 31 | 17.8% |
| High School | 38 | 21.8% |
| College / Undergraduate | 34 | 19.5% |
| Graduate / Professional | 2 | 1.1% |
| Total | 174 | 100.0% |
School Enrollment by Age by Funding Source in Phoenix
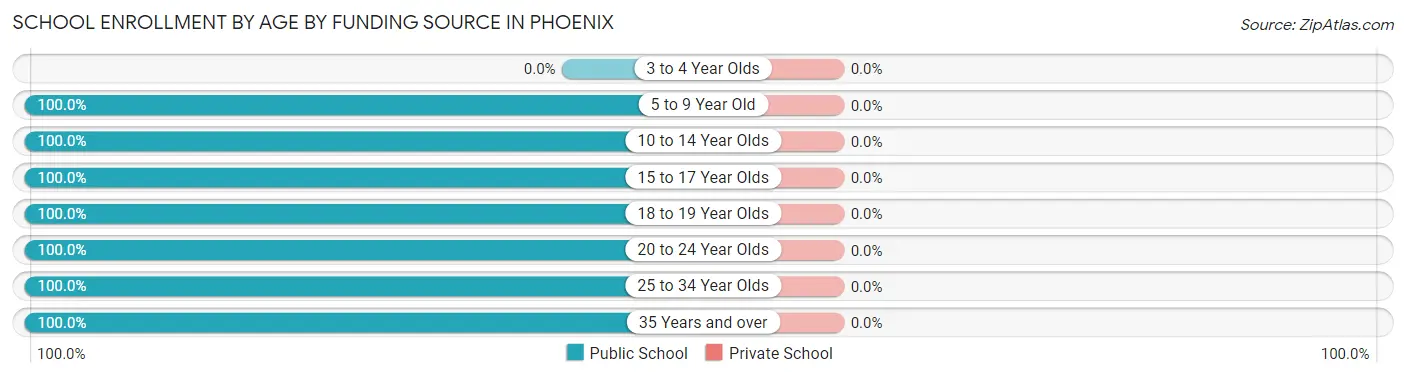
| Age Bracket | Public School | Private School |
| 3 to 4 Year Olds | 0 (0.0%) | 0 (0.0%) |
| 5 to 9 Year Old | 50 (100.0%) | 0 (0.0%) |
| 10 to 14 Year Olds | 50 (100.0%) | 0 (0.0%) |
| 15 to 17 Year Olds | 7 (100.0%) | 0 (0.0%) |
| 18 to 19 Year Olds | 36 (100.0%) | 0 (0.0%) |
| 20 to 24 Year Olds | 9 (100.0%) | 0 (0.0%) |
| 25 to 34 Year Olds | 6 (100.0%) | 0 (0.0%) |
| 35 Years and over | 16 (100.0%) | 0 (0.0%) |
| Total | 174 (100.0%) | 0 (0.0%) |
Educational Attainment by Field of Study in Phoenix
Business (30 | 28.0%), science & technology (20 | 18.7%), psychology (17 | 15.9%), arts & humanities (10 | 9.3%), and visual & performing arts (9 | 8.4%) are the most common fields of study among 107 individuals in Phoenix who have obtained a bachelor's degree or higher.
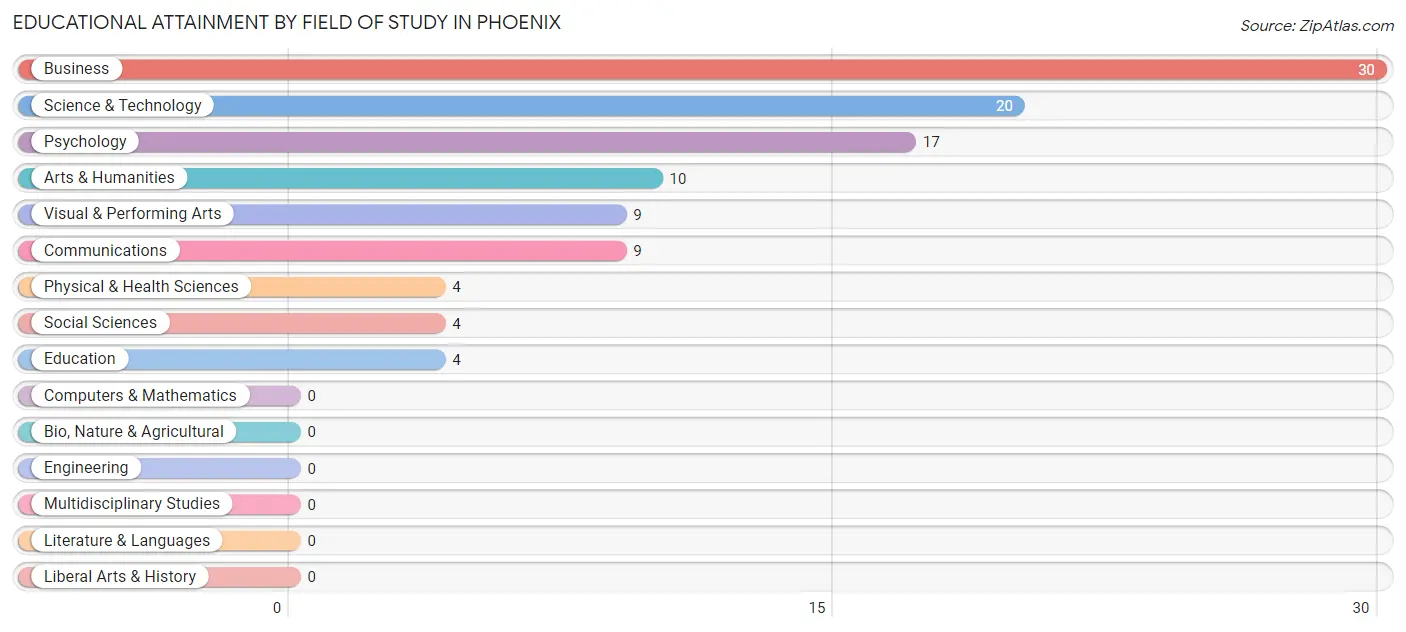
| Field of Study | # Graduates | % Graduates |
| Computers & Mathematics | 0 | 0.0% |
| Bio, Nature & Agricultural | 0 | 0.0% |
| Physical & Health Sciences | 4 | 3.7% |
| Psychology | 17 | 15.9% |
| Social Sciences | 4 | 3.7% |
| Engineering | 0 | 0.0% |
| Multidisciplinary Studies | 0 | 0.0% |
| Science & Technology | 20 | 18.7% |
| Business | 30 | 28.0% |
| Education | 4 | 3.7% |
| Literature & Languages | 0 | 0.0% |
| Liberal Arts & History | 0 | 0.0% |
| Visual & Performing Arts | 9 | 8.4% |
| Communications | 9 | 8.4% |
| Arts & Humanities | 10 | 9.3% |
| Total | 107 | 100.0% |
Transportation & Commute in Phoenix
Vehicle Availability by Sex in Phoenix
The most prevalent vehicle ownership categories in Phoenix are males with 1 vehicle (108, accounting for 36.7%) and females with 1 vehicle (84, making up 50.7%).
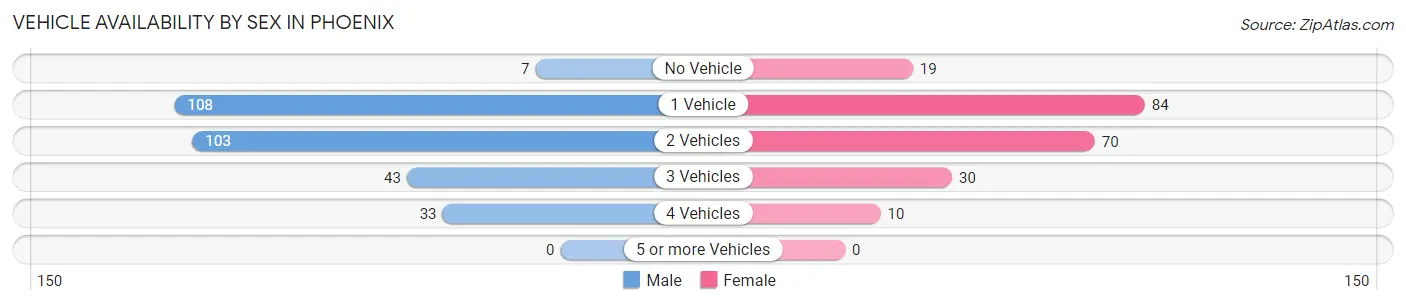
| Vehicles Available | Male | Female |
| No Vehicle | 7 (2.4%) | 19 (8.9%) |
| 1 Vehicle | 108 (36.7%) | 84 (39.4%) |
| 2 Vehicles | 103 (35.0%) | 70 (32.9%) |
| 3 Vehicles | 43 (14.6%) | 30 (14.1%) |
| 4 Vehicles | 33 (11.2%) | 10 (4.7%) |
| 5 or more Vehicles | 0 (0.0%) | 0 (0.0%) |
| Total | 294 (100.0%) | 213 (100.0%) |
Commute Time in Phoenix
The most frequently occuring commute durations in Phoenix are 5 to 9 minutes (89 commuters, 19.6%), 30 to 34 minutes (83 commuters, 18.3%), and 15 to 19 minutes (67 commuters, 14.8%).
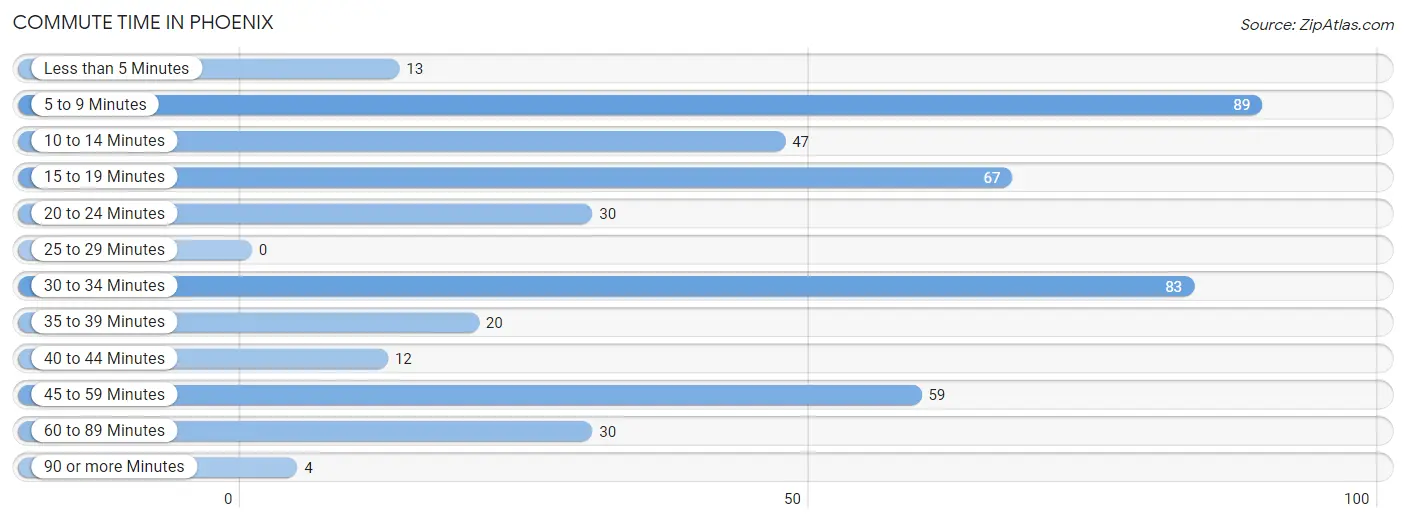
| Commute Time | # Commuters | % Commuters |
| Less than 5 Minutes | 13 | 2.9% |
| 5 to 9 Minutes | 89 | 19.6% |
| 10 to 14 Minutes | 47 | 10.3% |
| 15 to 19 Minutes | 67 | 14.8% |
| 20 to 24 Minutes | 30 | 6.6% |
| 25 to 29 Minutes | 0 | 0.0% |
| 30 to 34 Minutes | 83 | 18.3% |
| 35 to 39 Minutes | 20 | 4.4% |
| 40 to 44 Minutes | 12 | 2.6% |
| 45 to 59 Minutes | 59 | 13.0% |
| 60 to 89 Minutes | 30 | 6.6% |
| 90 or more Minutes | 4 | 0.9% |
Commute Time by Sex in Phoenix
The most common commute times in Phoenix are 5 to 9 minutes (60 commuters, 22.5%) for males and 30 to 34 minutes (63 commuters, 33.7%) for females.
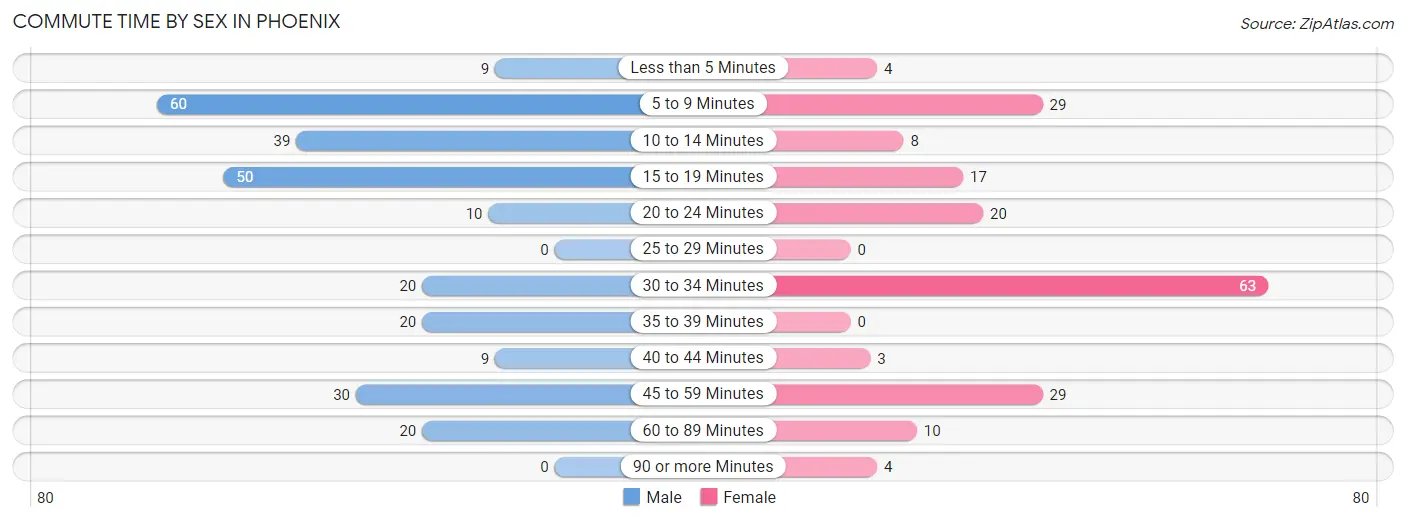
| Commute Time | Male | Female |
| Less than 5 Minutes | 9 (3.4%) | 4 (2.1%) |
| 5 to 9 Minutes | 60 (22.5%) | 29 (15.5%) |
| 10 to 14 Minutes | 39 (14.6%) | 8 (4.3%) |
| 15 to 19 Minutes | 50 (18.7%) | 17 (9.1%) |
| 20 to 24 Minutes | 10 (3.7%) | 20 (10.7%) |
| 25 to 29 Minutes | 0 (0.0%) | 0 (0.0%) |
| 30 to 34 Minutes | 20 (7.5%) | 63 (33.7%) |
| 35 to 39 Minutes | 20 (7.5%) | 0 (0.0%) |
| 40 to 44 Minutes | 9 (3.4%) | 3 (1.6%) |
| 45 to 59 Minutes | 30 (11.2%) | 29 (15.5%) |
| 60 to 89 Minutes | 20 (7.5%) | 10 (5.3%) |
| 90 or more Minutes | 0 (0.0%) | 4 (2.1%) |
Time of Departure to Work by Sex in Phoenix
The most frequent times of departure to work in Phoenix are 6:00 AM to 6:29 AM (67, 25.1%) for males and 8:30 AM to 8:59 AM (33, 17.6%) for females.
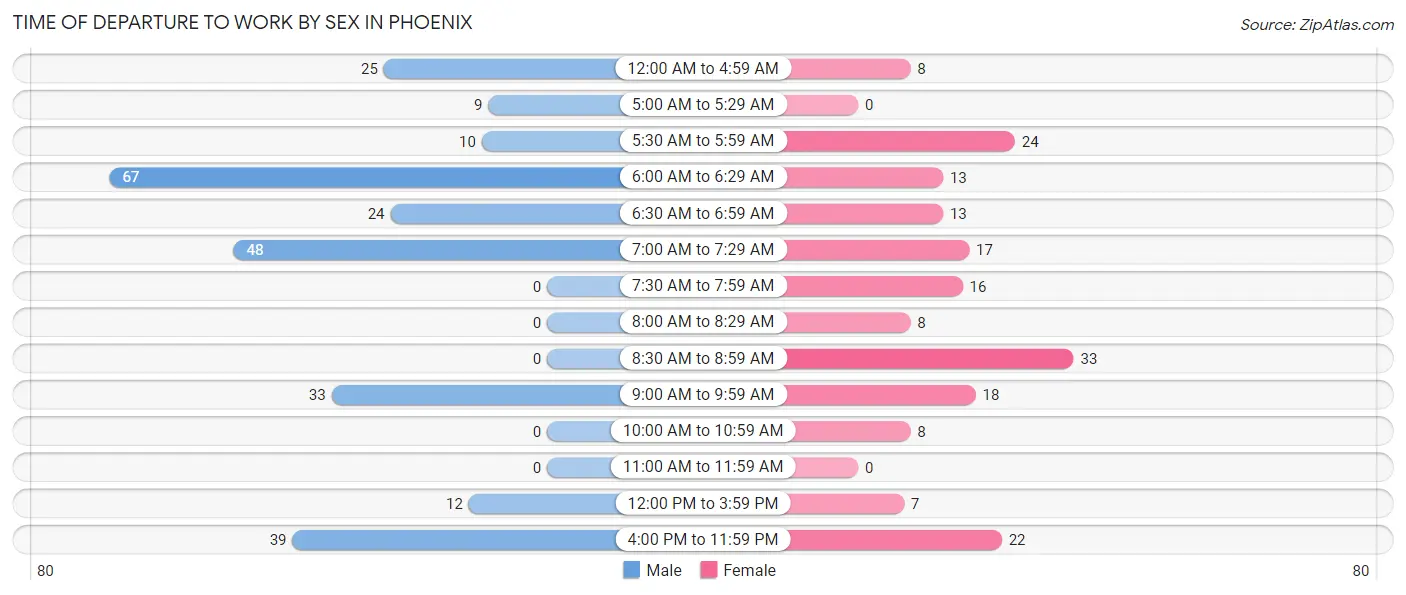
| Time of Departure | Male | Female |
| 12:00 AM to 4:59 AM | 25 (9.4%) | 8 (4.3%) |
| 5:00 AM to 5:29 AM | 9 (3.4%) | 0 (0.0%) |
| 5:30 AM to 5:59 AM | 10 (3.7%) | 24 (12.8%) |
| 6:00 AM to 6:29 AM | 67 (25.1%) | 13 (7.0%) |
| 6:30 AM to 6:59 AM | 24 (9.0%) | 13 (7.0%) |
| 7:00 AM to 7:29 AM | 48 (18.0%) | 17 (9.1%) |
| 7:30 AM to 7:59 AM | 0 (0.0%) | 16 (8.6%) |
| 8:00 AM to 8:29 AM | 0 (0.0%) | 8 (4.3%) |
| 8:30 AM to 8:59 AM | 0 (0.0%) | 33 (17.6%) |
| 9:00 AM to 9:59 AM | 33 (12.4%) | 18 (9.6%) |
| 10:00 AM to 10:59 AM | 0 (0.0%) | 8 (4.3%) |
| 11:00 AM to 11:59 AM | 0 (0.0%) | 0 (0.0%) |
| 12:00 PM to 3:59 PM | 12 (4.5%) | 7 (3.7%) |
| 4:00 PM to 11:59 PM | 39 (14.6%) | 22 (11.8%) |
| Total | 267 (100.0%) | 187 (100.0%) |
Housing Occupancy in Phoenix
Occupancy by Ownership in Phoenix
Of the total 633 dwellings in Phoenix, owner-occupied units account for 393 (62.1%), while renter-occupied units make up 240 (37.9%).
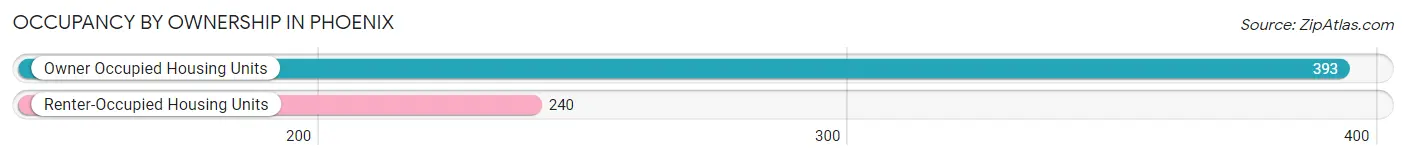
| Occupancy | # Housing Units | % Housing Units |
| Owner Occupied Housing Units | 393 | 62.1% |
| Renter-Occupied Housing Units | 240 | 37.9% |
| Total Occupied Housing Units | 633 | 100.0% |
Occupancy by Household Size in Phoenix
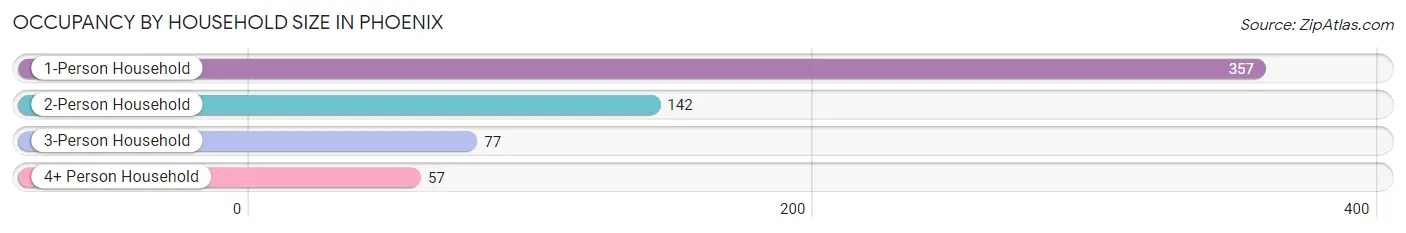
| Household Size | # Housing Units | % Housing Units |
| 1-Person Household | 357 | 56.4% |
| 2-Person Household | 142 | 22.4% |
| 3-Person Household | 77 | 12.2% |
| 4+ Person Household | 57 | 9.0% |
| Total Housing Units | 633 | 100.0% |
Occupancy by Ownership by Household Size in Phoenix
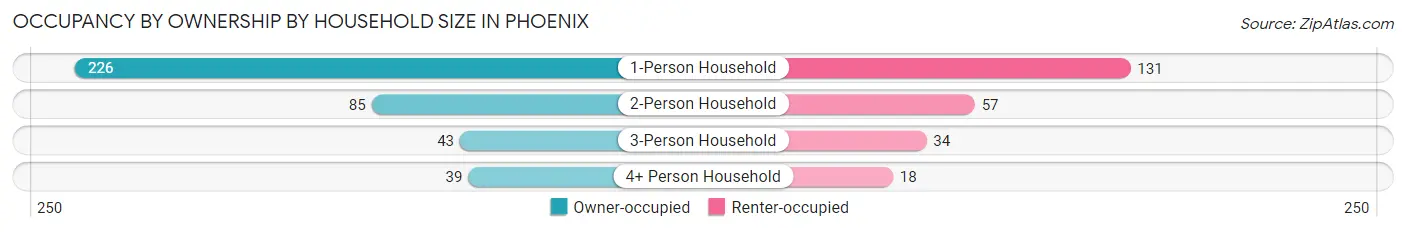
| Household Size | Owner-occupied | Renter-occupied |
| 1-Person Household | 226 (63.3%) | 131 (36.7%) |
| 2-Person Household | 85 (59.9%) | 57 (40.1%) |
| 3-Person Household | 43 (55.8%) | 34 (44.2%) |
| 4+ Person Household | 39 (68.4%) | 18 (31.6%) |
| Total Housing Units | 393 (62.1%) | 240 (37.9%) |
Occupancy by Educational Attainment in Phoenix
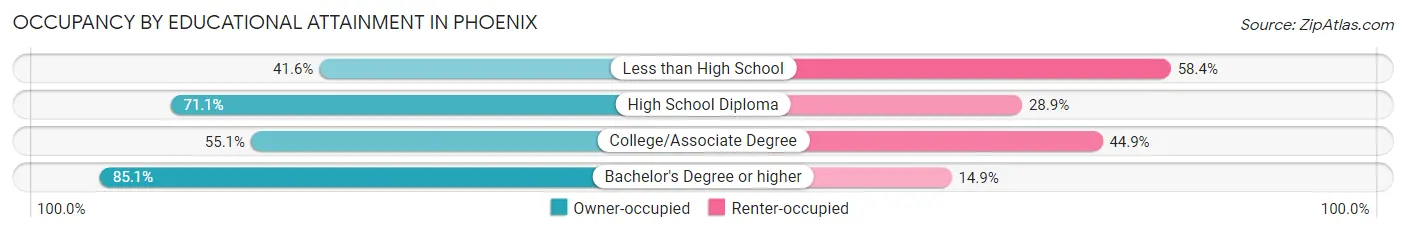
| Household Size | Owner-occupied | Renter-occupied |
| Less than High School | 52 (41.6%) | 73 (58.4%) |
| High School Diploma | 182 (71.1%) | 74 (28.9%) |
| College/Associate Degree | 102 (55.1%) | 83 (44.9%) |
| Bachelor's Degree or higher | 57 (85.1%) | 10 (14.9%) |
Occupancy by Age of Householder in Phoenix
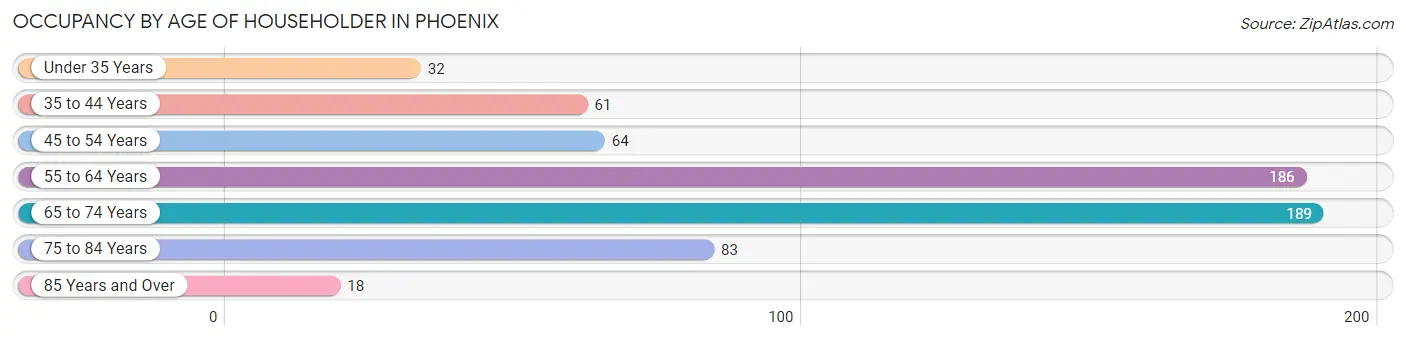
| Age Bracket | # Households | % Households |
| Under 35 Years | 32 | 5.1% |
| 35 to 44 Years | 61 | 9.6% |
| 45 to 54 Years | 64 | 10.1% |
| 55 to 64 Years | 186 | 29.4% |
| 65 to 74 Years | 189 | 29.9% |
| 75 to 84 Years | 83 | 13.1% |
| 85 Years and Over | 18 | 2.8% |
| Total | 633 | 100.0% |
Housing Finances in Phoenix
Median Income by Occupancy in Phoenix
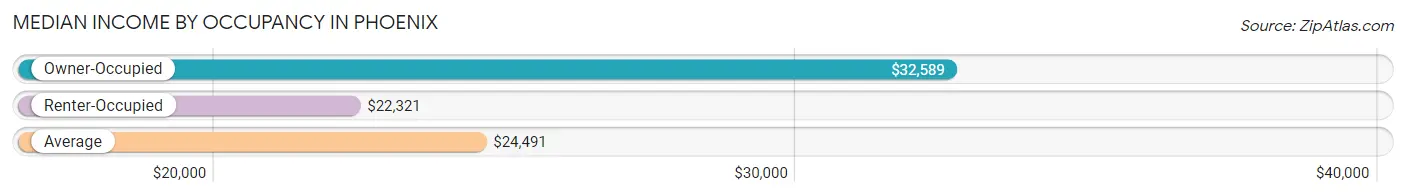
| Occupancy Type | # Households | Median Income |
| Owner-Occupied | 393 (62.1%) | $32,589 |
| Renter-Occupied | 240 (37.9%) | $22,321 |
| Average | 633 (100.0%) | $24,491 |
Occupancy by Householder Income Bracket in Phoenix
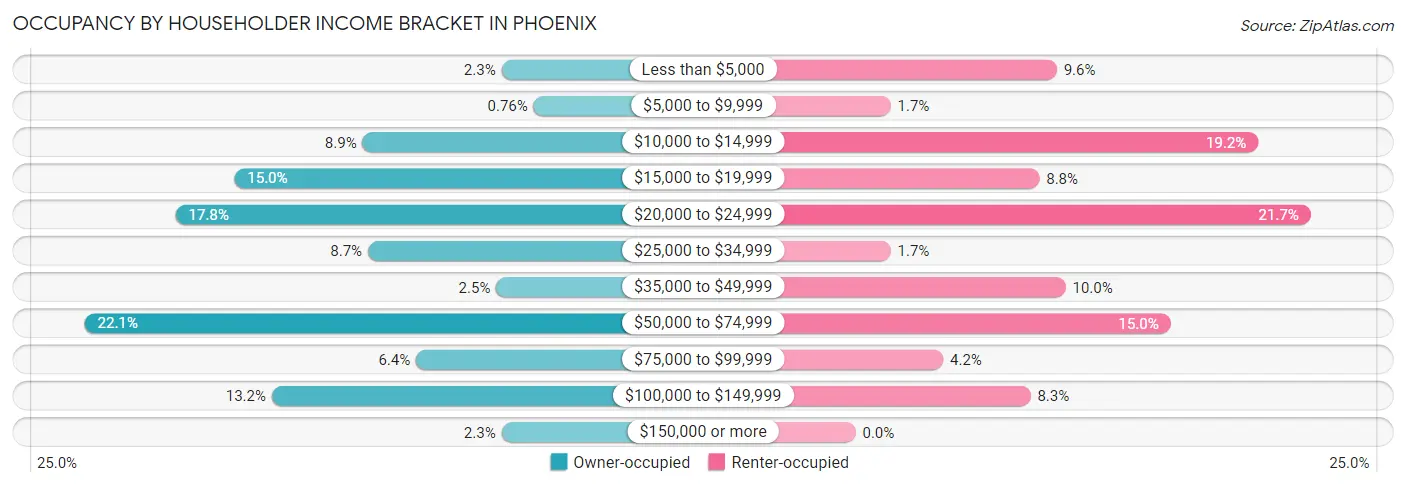
| Income Bracket | Owner-occupied | Renter-occupied |
| Less than $5,000 | 9 (2.3%) | 23 (9.6%) |
| $5,000 to $9,999 | 3 (0.8%) | 4 (1.7%) |
| $10,000 to $14,999 | 35 (8.9%) | 46 (19.2%) |
| $15,000 to $19,999 | 59 (15.0%) | 21 (8.7%) |
| $20,000 to $24,999 | 70 (17.8%) | 52 (21.7%) |
| $25,000 to $34,999 | 34 (8.6%) | 4 (1.7%) |
| $35,000 to $49,999 | 10 (2.5%) | 24 (10.0%) |
| $50,000 to $74,999 | 87 (22.1%) | 36 (15.0%) |
| $75,000 to $99,999 | 25 (6.4%) | 10 (4.2%) |
| $100,000 to $149,999 | 52 (13.2%) | 20 (8.3%) |
| $150,000 or more | 9 (2.3%) | 0 (0.0%) |
| Total | 393 (100.0%) | 240 (100.0%) |
Monthly Housing Cost Tiers in Phoenix
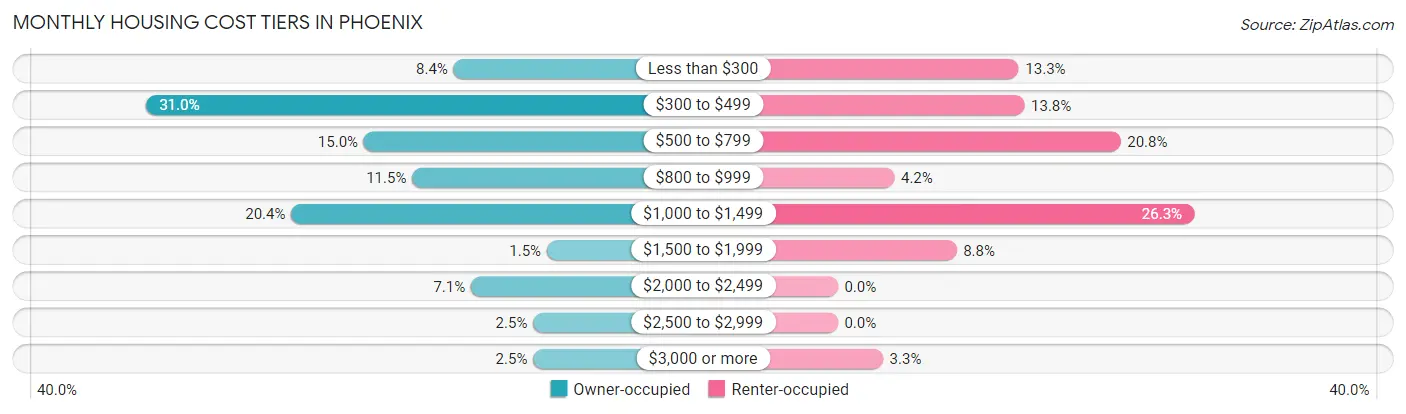
| Monthly Cost | Owner-occupied | Renter-occupied |
| Less than $300 | 33 (8.4%) | 32 (13.3%) |
| $300 to $499 | 122 (31.0%) | 33 (13.8%) |
| $500 to $799 | 59 (15.0%) | 50 (20.8%) |
| $800 to $999 | 45 (11.5%) | 10 (4.2%) |
| $1,000 to $1,499 | 80 (20.4%) | 63 (26.3%) |
| $1,500 to $1,999 | 6 (1.5%) | 21 (8.7%) |
| $2,000 to $2,499 | 28 (7.1%) | 0 (0.0%) |
| $2,500 to $2,999 | 10 (2.5%) | 0 (0.0%) |
| $3,000 or more | 10 (2.5%) | 8 (3.3%) |
| Total | 393 (100.0%) | 240 (100.0%) |
Physical Housing Characteristics in Phoenix
Housing Structures in Phoenix
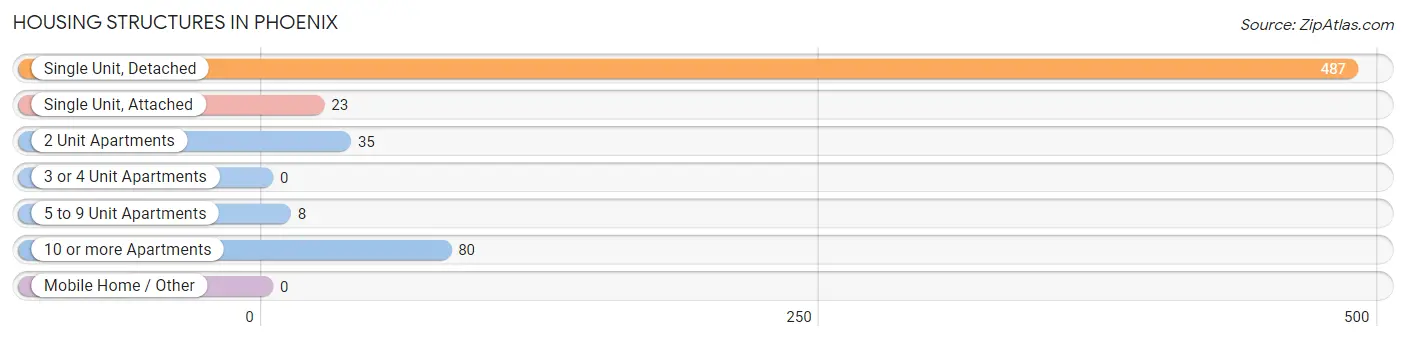
| Structure Type | # Housing Units | % Housing Units |
| Single Unit, Detached | 487 | 76.9% |
| Single Unit, Attached | 23 | 3.6% |
| 2 Unit Apartments | 35 | 5.5% |
| 3 or 4 Unit Apartments | 0 | 0.0% |
| 5 to 9 Unit Apartments | 8 | 1.3% |
| 10 or more Apartments | 80 | 12.6% |
| Mobile Home / Other | 0 | 0.0% |
| Total | 633 | 100.0% |
Housing Structures by Occupancy in Phoenix
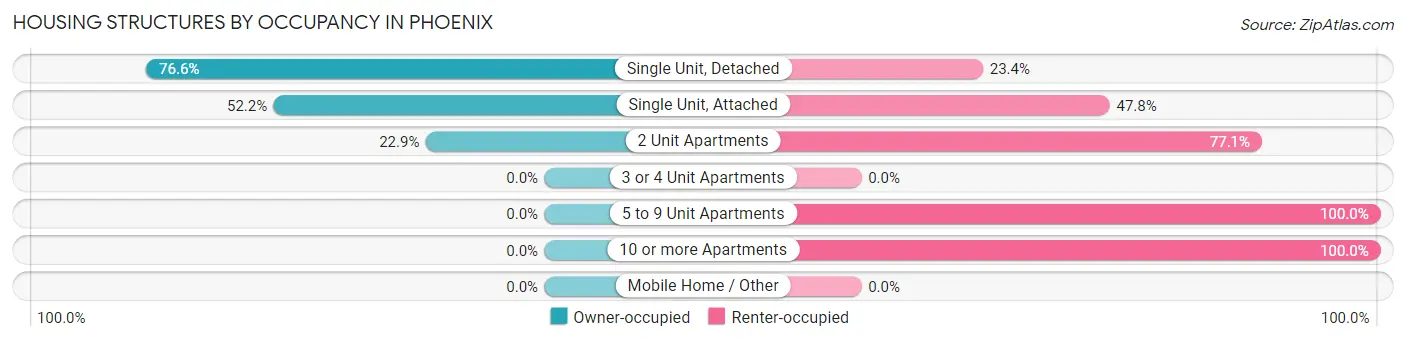
| Structure Type | Owner-occupied | Renter-occupied |
| Single Unit, Detached | 373 (76.6%) | 114 (23.4%) |
| Single Unit, Attached | 12 (52.2%) | 11 (47.8%) |
| 2 Unit Apartments | 8 (22.9%) | 27 (77.1%) |
| 3 or 4 Unit Apartments | 0 (0.0%) | 0 (0.0%) |
| 5 to 9 Unit Apartments | 0 (0.0%) | 8 (100.0%) |
| 10 or more Apartments | 0 (0.0%) | 80 (100.0%) |
| Mobile Home / Other | 0 (0.0%) | 0 (0.0%) |
| Total | 393 (62.1%) | 240 (37.9%) |
Housing Structures by Number of Rooms in Phoenix
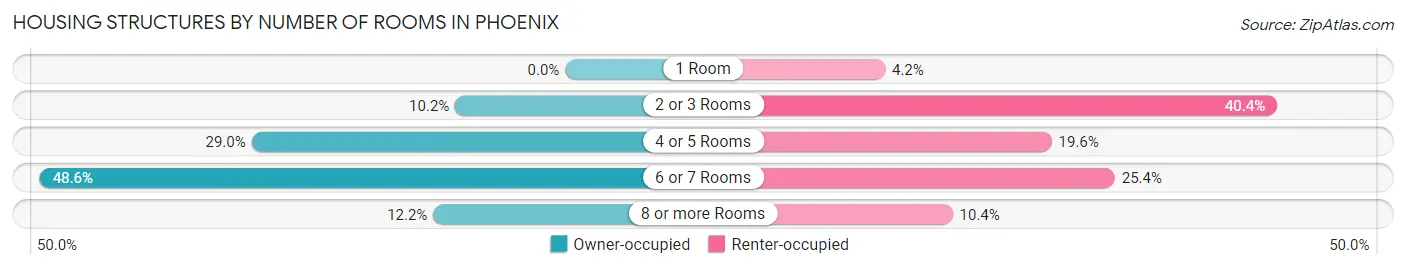
| Number of Rooms | Owner-occupied | Renter-occupied |
| 1 Room | 0 (0.0%) | 10 (4.2%) |
| 2 or 3 Rooms | 40 (10.2%) | 97 (40.4%) |
| 4 or 5 Rooms | 114 (29.0%) | 47 (19.6%) |
| 6 or 7 Rooms | 191 (48.6%) | 61 (25.4%) |
| 8 or more Rooms | 48 (12.2%) | 25 (10.4%) |
| Total | 393 (100.0%) | 240 (100.0%) |
Housing Structure by Heating Type in Phoenix
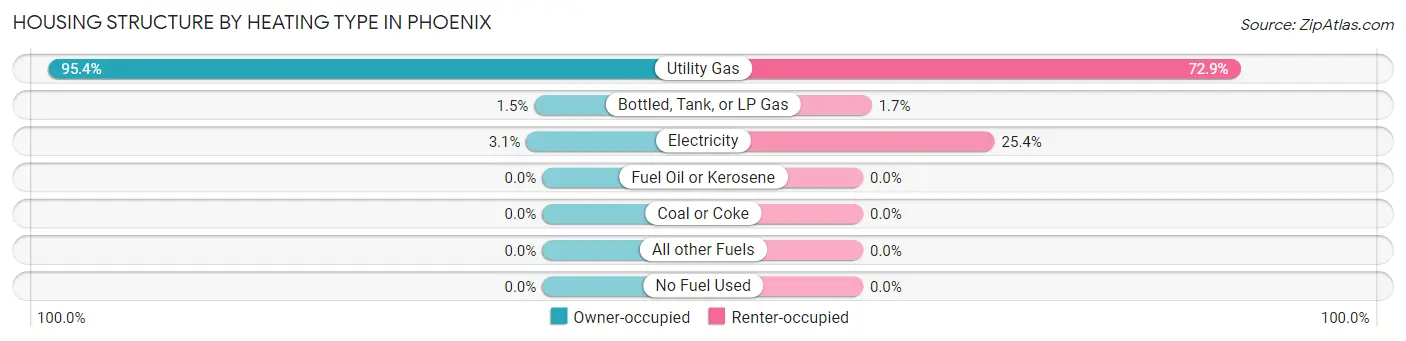
| Heating Type | Owner-occupied | Renter-occupied |
| Utility Gas | 375 (95.4%) | 175 (72.9%) |
| Bottled, Tank, or LP Gas | 6 (1.5%) | 4 (1.7%) |
| Electricity | 12 (3.0%) | 61 (25.4%) |
| Fuel Oil or Kerosene | 0 (0.0%) | 0 (0.0%) |
| Coal or Coke | 0 (0.0%) | 0 (0.0%) |
| All other Fuels | 0 (0.0%) | 0 (0.0%) |
| No Fuel Used | 0 (0.0%) | 0 (0.0%) |
| Total | 393 (100.0%) | 240 (100.0%) |
Household Vehicle Usage in Phoenix
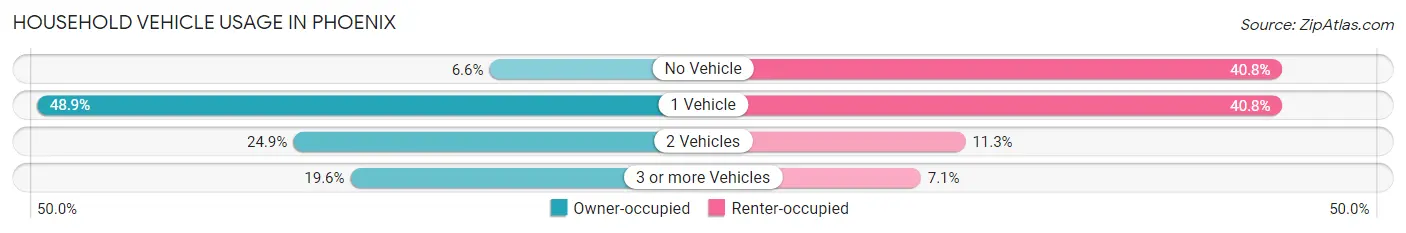
| Vehicles per Household | Owner-occupied | Renter-occupied |
| No Vehicle | 26 (6.6%) | 98 (40.8%) |
| 1 Vehicle | 192 (48.8%) | 98 (40.8%) |
| 2 Vehicles | 98 (24.9%) | 27 (11.3%) |
| 3 or more Vehicles | 77 (19.6%) | 17 (7.1%) |
| Total | 393 (100.0%) | 240 (100.0%) |
Real Estate & Mortgages in Phoenix
Real Estate and Mortgage Overview in Phoenix
| Characteristic | Without Mortgage | With Mortgage |
| Housing Units | 272 | 121 |
| Median Property Value | $70,000 | $109,200 |
| Median Household Income | $31,667 | $9 |
| Monthly Housing Costs | $447 | $10 |
| Real Estate Taxes | $1,844 | $7 |
Property Value by Mortgage Status in Phoenix
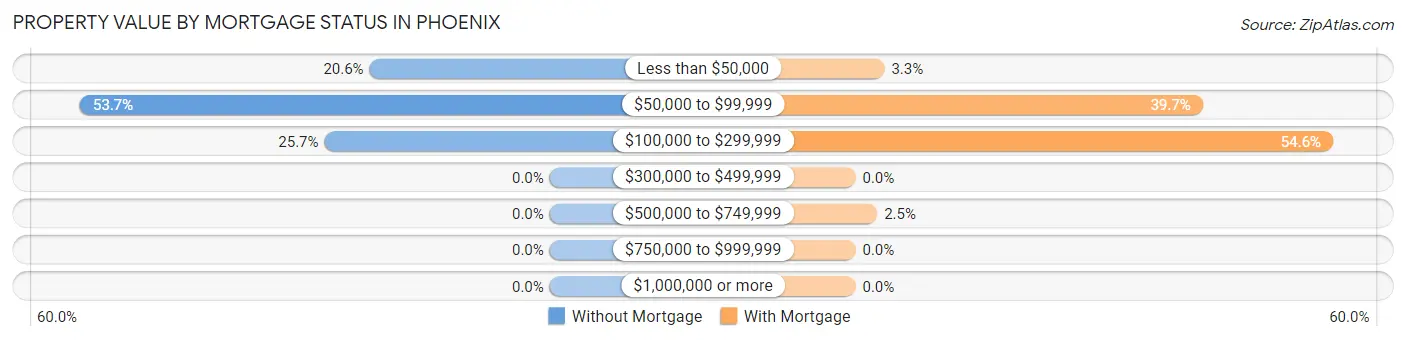
| Property Value | Without Mortgage | With Mortgage |
| Less than $50,000 | 56 (20.6%) | 4 (3.3%) |
| $50,000 to $99,999 | 146 (53.7%) | 48 (39.7%) |
| $100,000 to $299,999 | 70 (25.7%) | 66 (54.5%) |
| $300,000 to $499,999 | 0 (0.0%) | 0 (0.0%) |
| $500,000 to $749,999 | 0 (0.0%) | 3 (2.5%) |
| $750,000 to $999,999 | 0 (0.0%) | 0 (0.0%) |
| $1,000,000 or more | 0 (0.0%) | 0 (0.0%) |
| Total | 272 (100.0%) | 121 (100.0%) |
Household Income by Mortgage Status in Phoenix
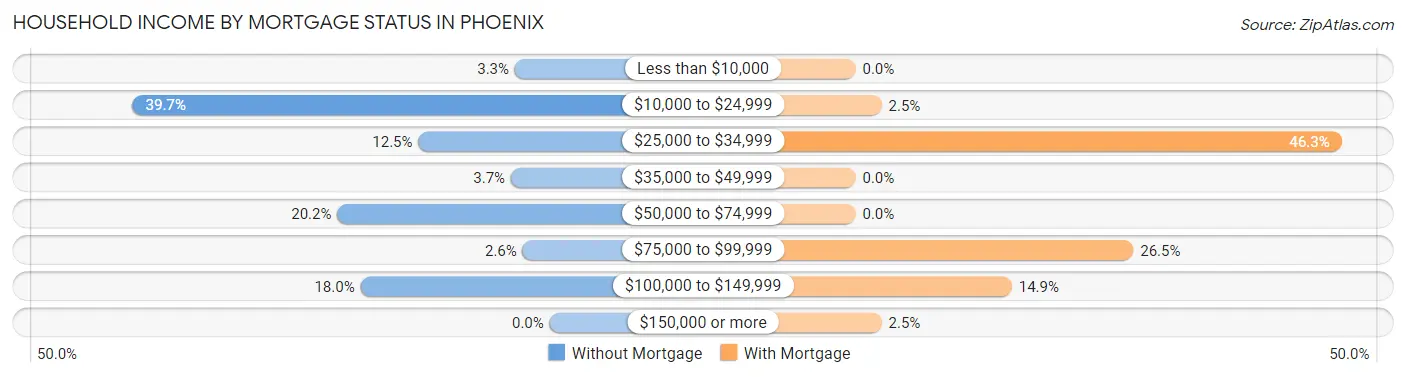
| Household Income | Without Mortgage | With Mortgage |
| Less than $10,000 | 9 (3.3%) | 0 (0.0%) |
| $10,000 to $24,999 | 108 (39.7%) | 3 (2.5%) |
| $25,000 to $34,999 | 34 (12.5%) | 56 (46.3%) |
| $35,000 to $49,999 | 10 (3.7%) | 0 (0.0%) |
| $50,000 to $74,999 | 55 (20.2%) | 0 (0.0%) |
| $75,000 to $99,999 | 7 (2.6%) | 32 (26.5%) |
| $100,000 to $149,999 | 49 (18.0%) | 18 (14.9%) |
| $150,000 or more | 0 (0.0%) | 3 (2.5%) |
| Total | 272 (100.0%) | 121 (100.0%) |
Property Value to Household Income Ratio in Phoenix
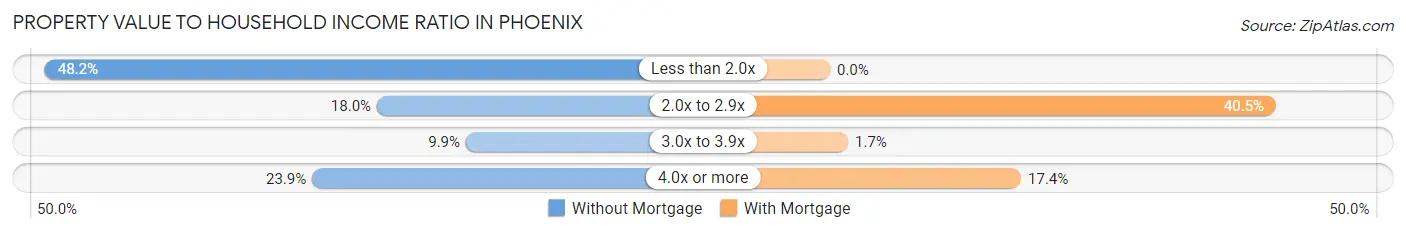
| Value-to-Income Ratio | Without Mortgage | With Mortgage |
| Less than 2.0x | 131 (48.2%) | 0 (0.0%) |
| 2.0x to 2.9x | 49 (18.0%) | 49 (40.5%) |
| 3.0x to 3.9x | 27 (9.9%) | 2 (1.7%) |
| 4.0x or more | 65 (23.9%) | 21 (17.4%) |
| Total | 272 (100.0%) | 121 (100.0%) |
Real Estate Taxes by Mortgage Status in Phoenix
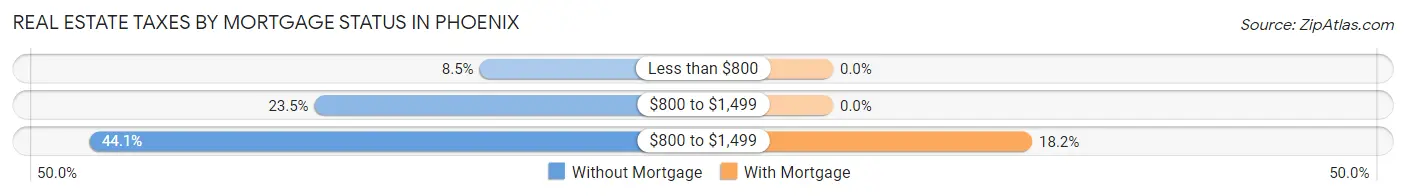
| Property Taxes | Without Mortgage | With Mortgage |
| Less than $800 | 23 (8.5%) | 0 (0.0%) |
| $800 to $1,499 | 64 (23.5%) | 0 (0.0%) |
| $800 to $1,499 | 120 (44.1%) | 22 (18.2%) |
| Total | 272 (100.0%) | 121 (100.0%) |
Health & Disability in Phoenix
Health Insurance Coverage by Age in Phoenix
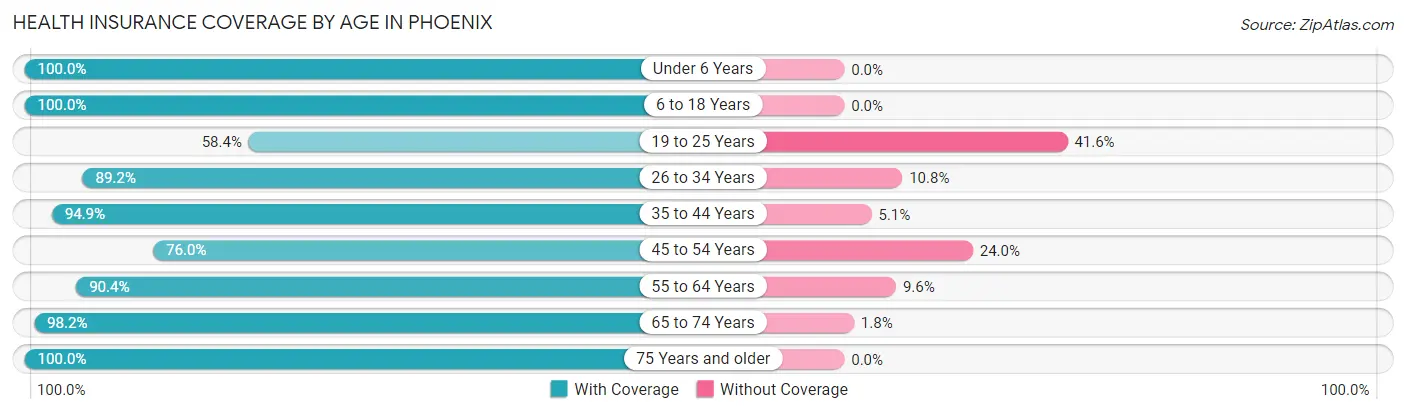
| Age Bracket | With Coverage | Without Coverage |
| Under 6 Years | 83 (100.0%) | 0 (0.0%) |
| 6 to 18 Years | 113 (100.0%) | 0 (0.0%) |
| 19 to 25 Years | 80 (58.4%) | 57 (41.6%) |
| 26 to 34 Years | 99 (89.2%) | 12 (10.8%) |
| 35 to 44 Years | 112 (94.9%) | 6 (5.1%) |
| 45 to 54 Years | 73 (76.0%) | 23 (24.0%) |
| 55 to 64 Years | 253 (90.4%) | 27 (9.6%) |
| 65 to 74 Years | 220 (98.2%) | 4 (1.8%) |
| 75 Years and older | 116 (100.0%) | 0 (0.0%) |
| Total | 1,149 (89.9%) | 129 (10.1%) |
Health Insurance Coverage by Citizenship Status in Phoenix
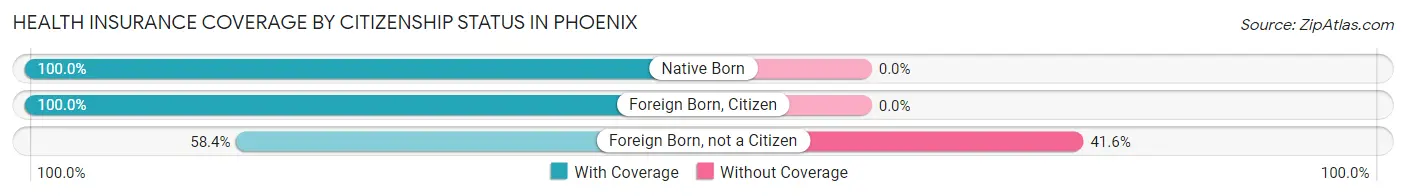
| Citizenship Status | With Coverage | Without Coverage |
| Native Born | 83 (100.0%) | 0 (0.0%) |
| Foreign Born, Citizen | 113 (100.0%) | 0 (0.0%) |
| Foreign Born, not a Citizen | 80 (58.4%) | 57 (41.6%) |
Health Insurance Coverage by Household Income in Phoenix
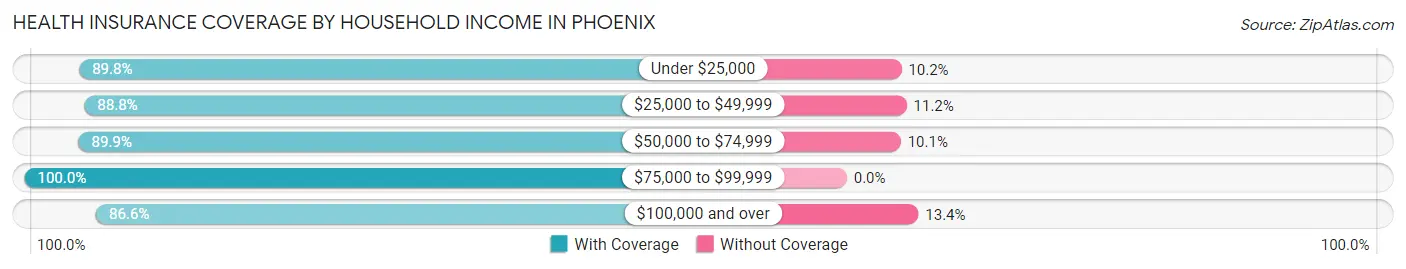
| Household Income | With Coverage | Without Coverage |
| Under $25,000 | 482 (89.8%) | 55 (10.2%) |
| $25,000 to $49,999 | 103 (88.8%) | 13 (11.2%) |
| $50,000 to $74,999 | 329 (89.9%) | 37 (10.1%) |
| $75,000 to $99,999 | 80 (100.0%) | 0 (0.0%) |
| $100,000 and over | 155 (86.6%) | 24 (13.4%) |
Public vs Private Health Insurance Coverage by Age in Phoenix
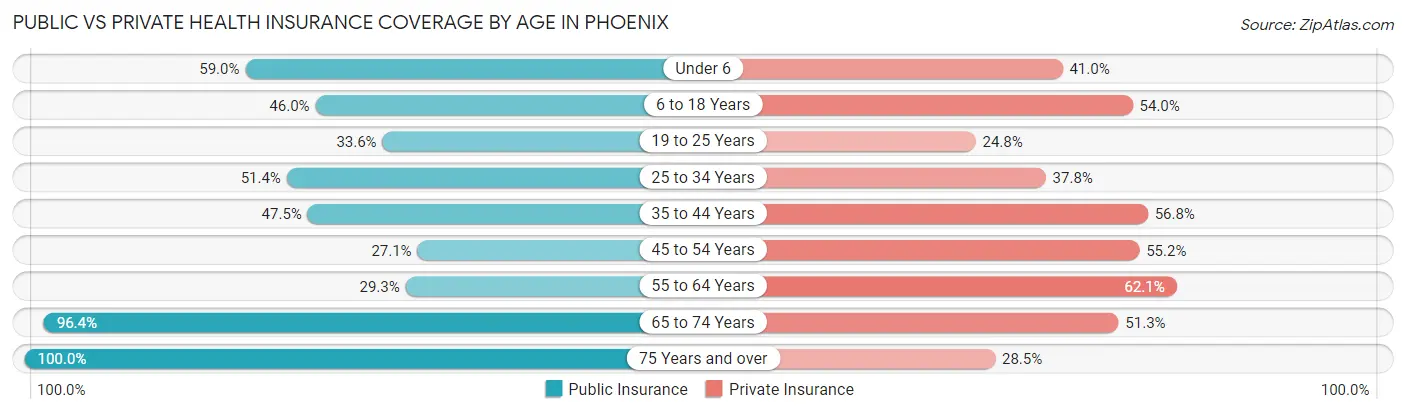
| Age Bracket | Public Insurance | Private Insurance |
| Under 6 | 49 (59.0%) | 34 (41.0%) |
| 6 to 18 Years | 52 (46.0%) | 61 (54.0%) |
| 19 to 25 Years | 46 (33.6%) | 34 (24.8%) |
| 25 to 34 Years | 57 (51.3%) | 42 (37.8%) |
| 35 to 44 Years | 56 (47.5%) | 67 (56.8%) |
| 45 to 54 Years | 26 (27.1%) | 53 (55.2%) |
| 55 to 64 Years | 82 (29.3%) | 174 (62.1%) |
| 65 to 74 Years | 216 (96.4%) | 115 (51.3%) |
| 75 Years and over | 116 (100.0%) | 33 (28.4%) |
| Total | 700 (54.8%) | 613 (48.0%) |
Disability Status by Sex by Age in Phoenix
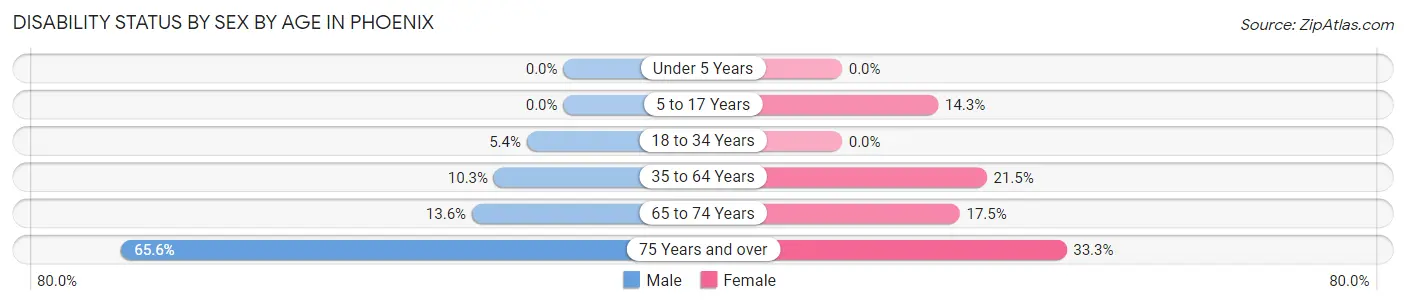
| Age Bracket | Male | Female |
| Under 5 Years | 0 (0.0%) | 0 (0.0%) |
| 5 to 17 Years | 0 (0.0%) | 11 (14.3%) |
| 18 to 34 Years | 7 (5.4%) | 0 (0.0%) |
| 35 to 64 Years | 26 (10.3%) | 52 (21.5%) |
| 65 to 74 Years | 11 (13.6%) | 25 (17.5%) |
| 75 Years and over | 21 (65.6%) | 28 (33.3%) |
Disability Class by Sex by Age in Phoenix
Disability Class: Hearing Difficulty
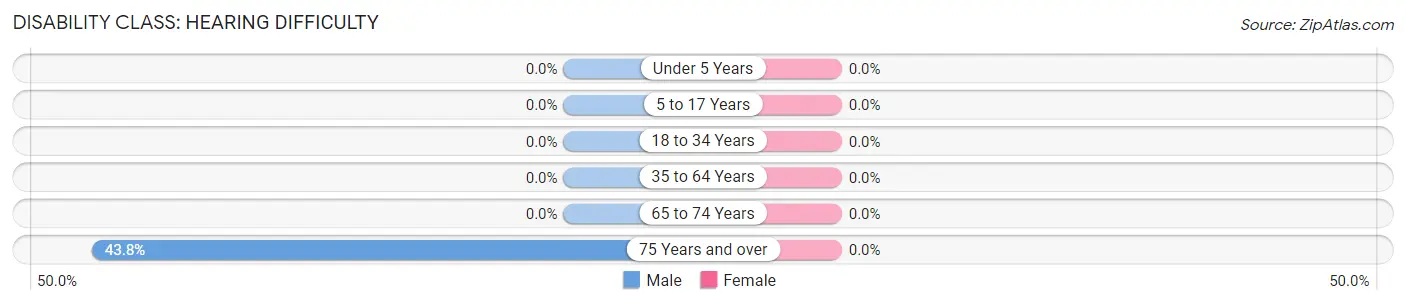
| Age Bracket | Male | Female |
| Under 5 Years | 0 (0.0%) | 0 (0.0%) |
| 5 to 17 Years | 0 (0.0%) | 0 (0.0%) |
| 18 to 34 Years | 0 (0.0%) | 0 (0.0%) |
| 35 to 64 Years | 0 (0.0%) | 0 (0.0%) |
| 65 to 74 Years | 0 (0.0%) | 0 (0.0%) |
| 75 Years and over | 14 (43.8%) | 0 (0.0%) |
Disability Class: Vision Difficulty
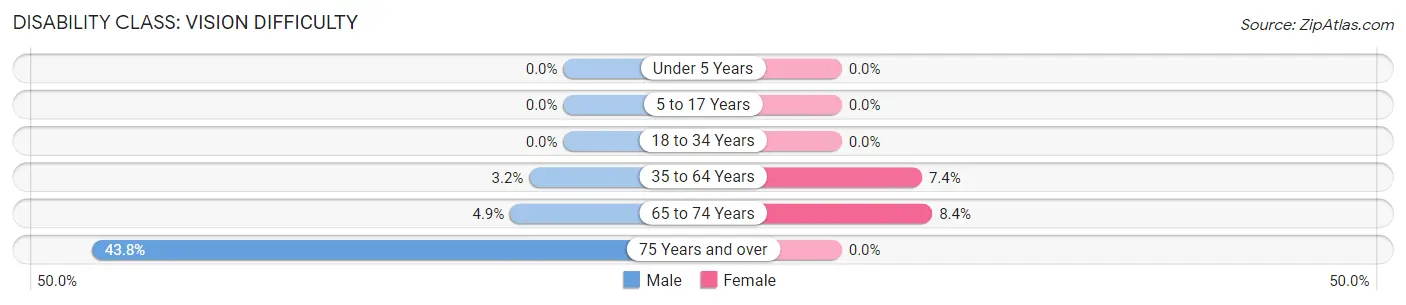
| Age Bracket | Male | Female |
| Under 5 Years | 0 (0.0%) | 0 (0.0%) |
| 5 to 17 Years | 0 (0.0%) | 0 (0.0%) |
| 18 to 34 Years | 0 (0.0%) | 0 (0.0%) |
| 35 to 64 Years | 8 (3.2%) | 18 (7.4%) |
| 65 to 74 Years | 4 (4.9%) | 12 (8.4%) |
| 75 Years and over | 14 (43.8%) | 0 (0.0%) |
Disability Class: Cognitive Difficulty
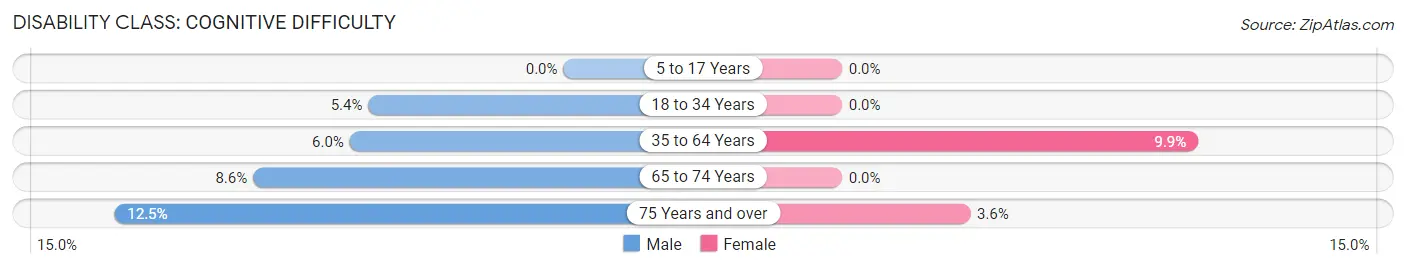
| Age Bracket | Male | Female |
| 5 to 17 Years | 0 (0.0%) | 0 (0.0%) |
| 18 to 34 Years | 7 (5.4%) | 0 (0.0%) |
| 35 to 64 Years | 15 (5.9%) | 24 (9.9%) |
| 65 to 74 Years | 7 (8.6%) | 0 (0.0%) |
| 75 Years and over | 4 (12.5%) | 3 (3.6%) |
Disability Class: Ambulatory Difficulty
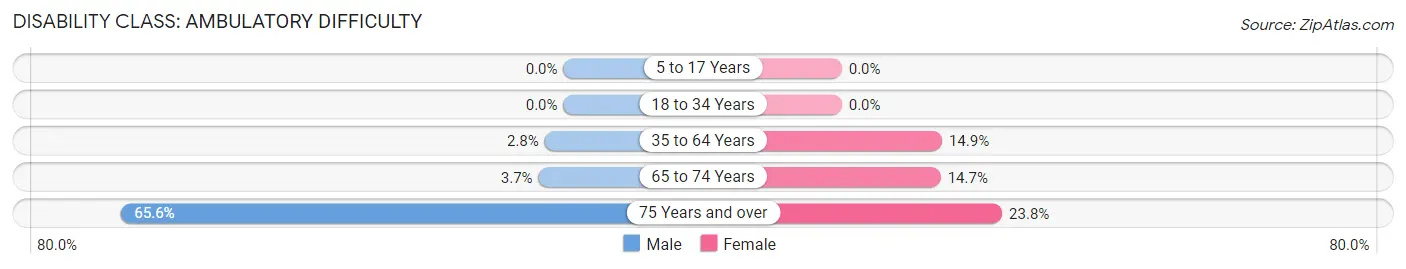
| Age Bracket | Male | Female |
| 5 to 17 Years | 0 (0.0%) | 0 (0.0%) |
| 18 to 34 Years | 0 (0.0%) | 0 (0.0%) |
| 35 to 64 Years | 7 (2.8%) | 36 (14.9%) |
| 65 to 74 Years | 3 (3.7%) | 21 (14.7%) |
| 75 Years and over | 21 (65.6%) | 20 (23.8%) |
Disability Class: Self-Care Difficulty
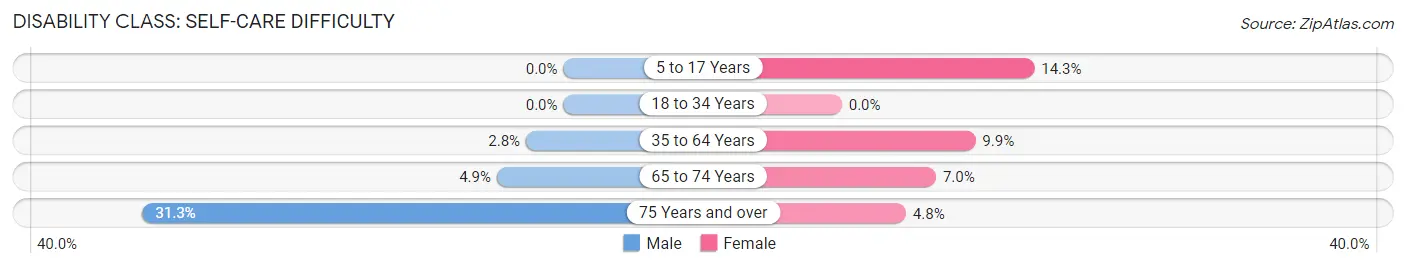
| Age Bracket | Male | Female |
| 5 to 17 Years | 0 (0.0%) | 11 (14.3%) |
| 18 to 34 Years | 0 (0.0%) | 0 (0.0%) |
| 35 to 64 Years | 7 (2.8%) | 24 (9.9%) |
| 65 to 74 Years | 4 (4.9%) | 10 (7.0%) |
| 75 Years and over | 10 (31.2%) | 4 (4.8%) |
Technology Access in Phoenix
Computing Device Access in Phoenix
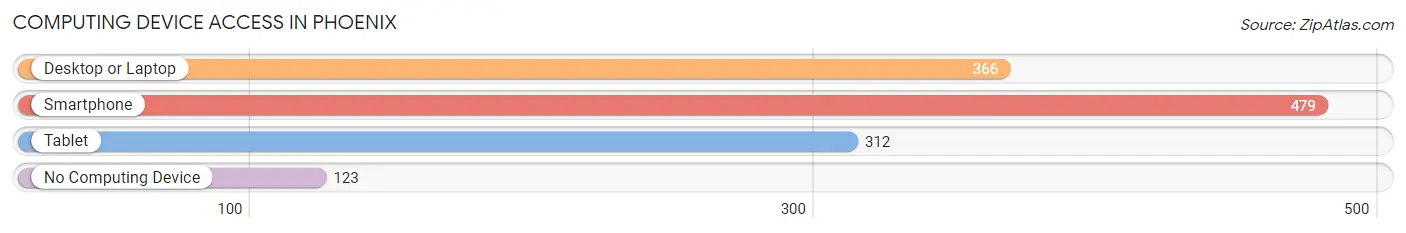
| Device Type | # Households | % Households |
| Desktop or Laptop | 366 | 57.8% |
| Smartphone | 479 | 75.7% |
| Tablet | 312 | 49.3% |
| No Computing Device | 123 | 19.4% |
| Total | 633 | 100.0% |
Internet Access in Phoenix
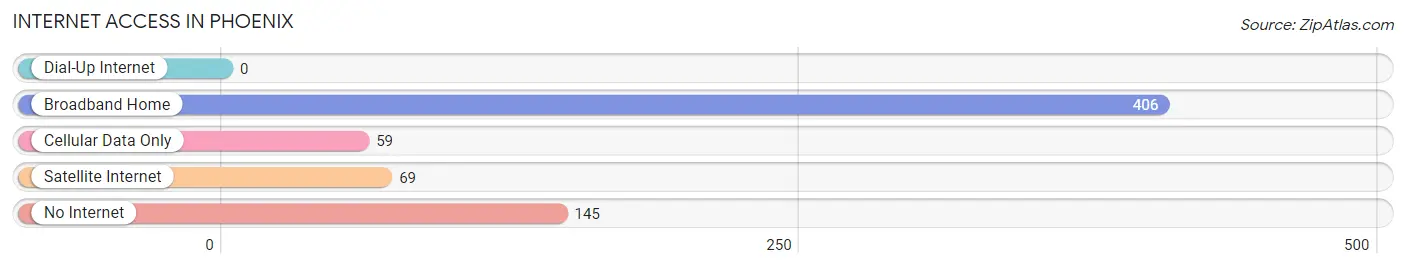
| Internet Type | # Households | % Households |
| Dial-Up Internet | 0 | 0.0% |
| Broadband Home | 406 | 64.1% |
| Cellular Data Only | 59 | 9.3% |
| Satellite Internet | 69 | 10.9% |
| No Internet | 145 | 22.9% |
| Total | 633 | 100.0% |
Phoenix Summary
Phoenix, Illinois is a small village located in Cook County, Illinois, United States. It is a part of the Chicago metropolitan area and is located approximately 25 miles southwest of the city. The village has a population of approximately 4,500 people and is a predominantly white community.
Geography
Phoenix is located in the southwestern corner of Cook County, Illinois, and is bordered by the villages of Tinley Park, Orland Park, and Oak Forest. The village is situated on the Des Plaines River, which is a tributary of the Illinois River. The village is located in the Tinley Moraine, which is a region of rolling hills and glacial deposits. The village is located in a temperate climate zone, with average temperatures ranging from the mid-30s in the winter to the mid-80s in the summer.
Economy
The economy of Phoenix is largely based on the service industry, with many businesses providing services to the surrounding communities. The village is home to a variety of retail stores, restaurants, and other businesses. The village also has a number of industrial and manufacturing businesses, including a steel mill and a plastics factory. The village is also home to a number of medical facilities, including a hospital and several clinics.
Demographics
As of the 2010 census, the population of Phoenix was 4,491. The racial makeup of the village was 94.3% White, 1.2% African American, 0.3% Native American, 1.2% Asian, 0.1% Pacific Islander, 1.2% from other races, and 1.9% from two or more races. Hispanic or Latino of any race were 4.2% of the population.
The median income for a household in the village was $50,972, and the median income for a family was $60,972. The per capita income for the village was $22,972. About 4.2% of families and 5.2% of the population were below the poverty line, including 6.2% of those under age 18 and 4.2% of those age 65 or over.
Conclusion
Phoenix, Illinois is a small village located in Cook County, Illinois, United States. It is a part of the Chicago metropolitan area and is located approximately 25 miles southwest of the city. The village has a population of approximately 4,500 people and is a predominantly white community. The economy of Phoenix is largely based on the service industry, with many businesses providing services to the surrounding communities. The village is home to a variety of retail stores, restaurants, and other businesses. The racial makeup of the village was 94.3% White, 1.2% African American, 0.3% Native American, 1.2% Asian, 0.1% Pacific Islander, 1.2% from other races, and 1.9% from two or more races. The median income for a household in the village was $50,972, and the median income for a family was $60,972. Phoenix is a small but vibrant community that offers its residents a variety of services and amenities.
Common Questions
What is the Total Population of Phoenix?
Total Population of Phoenix is 1,278.
What is the Total Male Population of Phoenix?
Total Male Population of Phoenix is 573.
What is the Total Female Population of Phoenix?
Total Female Population of Phoenix is 705.
What is the Ratio of Males per 100 Females in Phoenix?
There are 81.28 Males per 100 Females in Phoenix.
What is the Ratio of Females per 100 Males in Phoenix?
There are 123.04 Females per 100 Males in Phoenix.
What is the Median Population Age in Phoenix?
Median Population Age in Phoenix is 52.5 Years.
What is the Average Family Size in Phoenix
Average Family Size in Phoenix is 3.2 People.
What is the Average Household Size in Phoenix
Average Household Size in Phoenix is 2.0 People.
What is Per Capita Income in Phoenix?
Per Capita income in Phoenix is $24,007.
What is the Median Family Income in Phoenix?
Median Family Income in Phoenix is $40,179.
What is the Median Household income in Phoenix?
Median Household Income in Phoenix is $24,491.
What is Income or Wage Gap in Phoenix?
Income or Wage Gap in Phoenix is 21.7%.
Women in Phoenix earn 78.3 cents for every dollar earned by a man.
What is Family Income Deficit in Phoenix?
Family Income Deficit in Phoenix is $11,451.
Families that are below poverty line in Phoenix earn $11,451 less on average than the poverty threshold level.
What is Inequality or Gini Index in Phoenix?
Inequality or Gini Index in Phoenix is 0.47.
How Large is the Labor Force in Phoenix?
There are 654 People in the Labor Forcein in Phoenix.
What is the Percentage of People in the Labor Force in Phoenix?
58.9% of People are in the Labor Force in Phoenix.
What is the Unemployment Rate in Phoenix?
Unemployment Rate in Phoenix is 20.5%.