Cities with the Highest Percentage of Immigrants from Africa in Kentucky
RELATED REPORTS & OPTIONS
Africa
Kentucky
Compare Cities
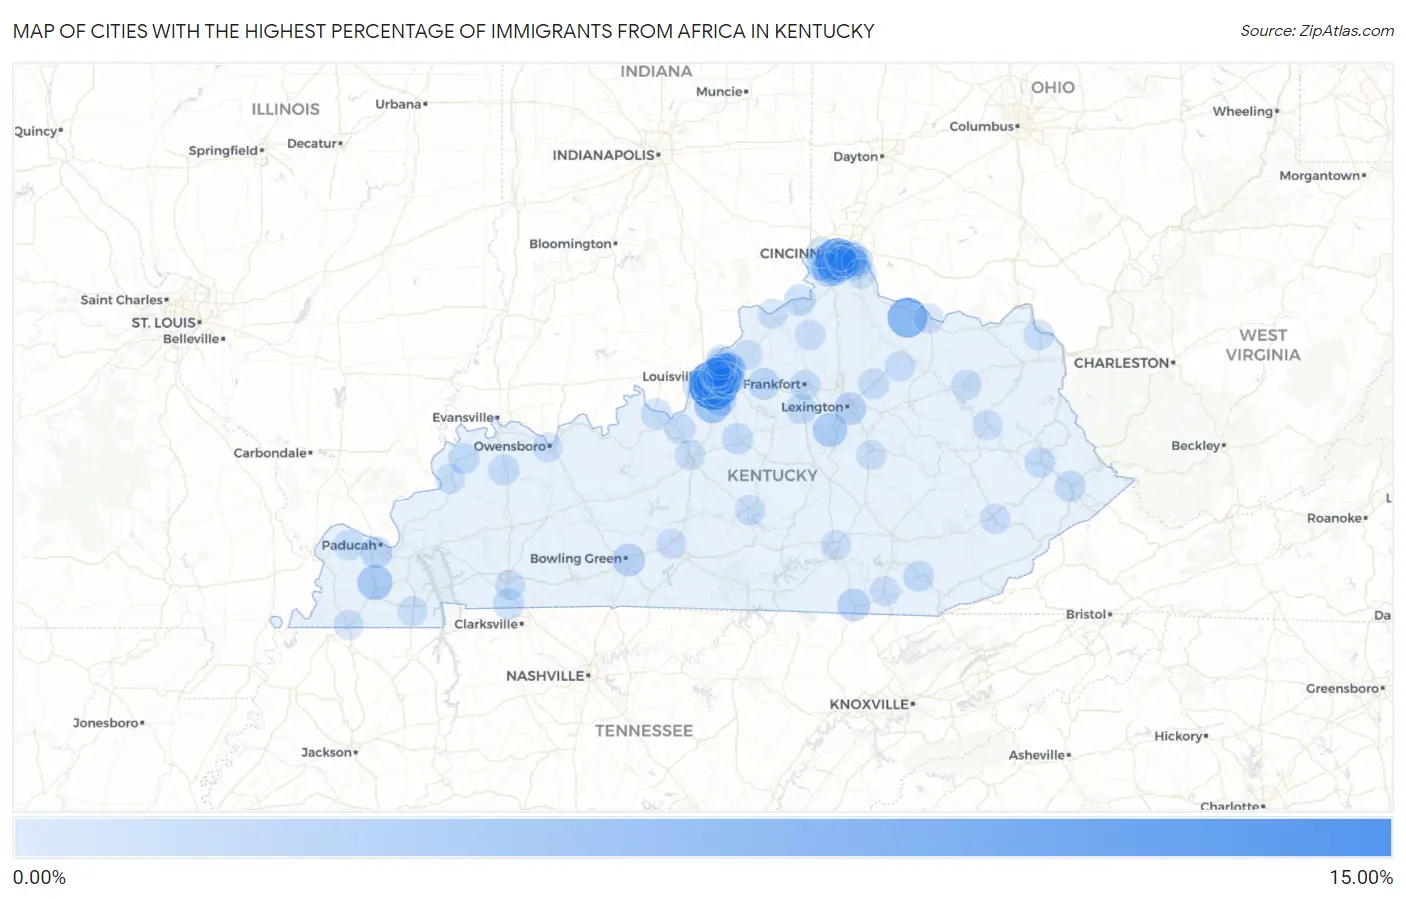
Map of Cities with the Highest Percentage of Immigrants from Africa in Kentucky
0.00%
15.00%
Cities with the Highest Percentage of Immigrants from Africa in Kentucky
| City | Africa | vs State | vs National | |
| 1. | West Buechel | 13.53% | 0.54%(+13.0)#-1 | 0.78%(+12.8)#0 |
| 2. | Crescent Springs | 9.40% | 0.54%(+8.87)#0 | 0.78%(+8.62)#1 |
| 3. | Germantown | 6.84% | 0.54%(+6.30)#1 | 0.78%(+6.06)#2 |
| 4. | Pleasant Ridge | 5.51% | 0.54%(+4.97)#2 | 0.78%(+4.73)#3 |
| 5. | Briarwood | 5.19% | 0.54%(+4.66)#3 | 0.78%(+4.42)#4 |
| 6. | Watterson Park | 4.58% | 0.54%(+4.05)#4 | 0.78%(+3.81)#5 |
| 7. | Hillview | 4.23% | 0.54%(+3.69)#5 | 0.78%(+3.45)#6 |
| 8. | Hickory | 3.48% | 0.54%(+2.94)#6 | 0.78%(+2.70)#7 |
| 9. | Poplar Hills | 3.47% | 0.54%(+2.93)#7 | 0.78%(+2.69)#8 |
| 10. | Wilmore | 2.88% | 0.54%(+2.34)#8 | 0.78%(+2.10)#9 |
| 11. | Forest Hills | 2.73% | 0.54%(+2.19)#9 | 0.78%(+1.95)#10 |
| 12. | Elsmere | 2.62% | 0.54%(+2.08)#10 | 0.78%(+1.84)#11 |
| 13. | Creekside | 2.47% | 0.54%(+1.94)#11 | 0.78%(+1.69)#12 |
| 14. | Florence | 2.41% | 0.54%(+1.87)#12 | 0.78%(+1.63)#13 |
| 15. | Lyndon | 2.18% | 0.54%(+1.65)#13 | 0.78%(+1.40)#14 |
| 16. | Bowling Green | 1.86% | 0.54%(+1.32)#14 | 0.78%(+1.08)#15 |
| 17. | Broeck Pointe | 1.85% | 0.54%(+1.31)#15 | 0.78%(+1.07)#16 |
| 18. | Pine Knot | 1.82% | 0.54%(+1.29)#16 | 0.78%(+1.04)#17 |
| 19. | Lexington | 1.82% | 0.54%(+1.28)#17 | 0.78%(+1.04)#18 |
| 20. | Heritage Creek | 1.80% | 0.54%(+1.27)#18 | 0.78%(+1.02)#19 |
| 21. | Southgate | 1.74% | 0.54%(+1.20)#19 | 0.78%(+0.961)#20 |
| 22. | Thornhill | 1.69% | 0.54%(+1.16)#20 | 0.78%(+0.916)#21 |
| 23. | Wildwood | 1.68% | 0.54%(+1.15)#21 | 0.78%(+0.901)#22 |
| 24. | Westwood | 1.61% | 0.54%(+1.08)#22 | 0.78%(+0.834)#23 |
| 25. | Spring Valley | 1.51% | 0.54%(+0.978)#23 | 0.78%(+0.734)#24 |
| 26. | Louisville | 1.49% | 0.54%(+0.950)#24 | 0.78%(+0.707)#418 |
| 27. | Plantation | 1.46% | 0.54%(+0.925)#25 | 0.78%(+0.681)#419 |
| 28. | Worthington Hills | 1.42% | 0.54%(+0.885)#26 | 0.78%(+0.641)#420 |
| 29. | Windy Hills | 1.41% | 0.54%(+0.878)#27 | 0.78%(+0.634)#421 |
| 30. | Hendron | 1.37% | 0.54%(+0.834)#28 | 0.78%(+0.590)#422 |
| 31. | Fincastle | 1.36% | 0.54%(+0.825)#29 | 0.78%(+0.581)#423 |
| 32. | Shelbyville | 1.34% | 0.54%(+0.804)#30 | 0.78%(+0.561)#424 |
| 33. | St Regis Park | 1.20% | 0.54%(+0.661)#31 | 0.78%(+0.418)#425 |
| 34. | Warsaw | 1.06% | 0.54%(+0.519)#32 | 0.78%(+0.276)#426 |
| 35. | Fort Campbell North | 1.00% | 0.54%(+0.463)#33 | 0.78%(+0.220)#427 |
| 36. | Parkway Village | 0.96% | 0.54%(+0.429)#34 | 0.78%(+0.185)#428 |
| 37. | Bardstown | 0.92% | 0.54%(+0.386)#35 | 0.78%(+0.142)#429 |
| 38. | Pikeville | 0.90% | 0.54%(+0.364)#36 | 0.78%(+0.120)#430 |
| 39. | Fort Mitchell | 0.89% | 0.54%(+0.353)#37 | 0.78%(+0.109)#431 |
| 40. | Barbourville | 0.81% | 0.54%(+0.278)#38 | 0.78%(+0.034)#432 |
| 41. | Breckinridge Center | 0.79% | 0.54%(+0.255)#39 | 0.78%(+0.012)#433 |
| 42. | Strathmoor Village | 0.76% | 0.54%(+0.226)#40 | 0.78%(-0.017)#434 |
| 43. | Sebree | 0.72% | 0.54%(+0.187)#41 | 0.78%(-0.056)#435 |
| 44. | Sycamore | 0.71% | 0.54%(+0.179)#42 | 0.78%(-0.065)#436 |
| 45. | Lawrenceburg | 0.70% | 0.54%(+0.162)#43 | 0.78%(-0.081)#437 |
| 46. | Paris | 0.69% | 0.54%(+0.155)#44 | 0.78%(-0.089)#438 |
| 47. | Middletown | 0.69% | 0.54%(+0.152)#45 | 0.78%(-0.091)#439 |
| 48. | Cold Spring | 0.69% | 0.54%(+0.152)#46 | 0.78%(-0.092)#440 |
| 49. | Burlington | 0.68% | 0.54%(+0.149)#47 | 0.78%(-0.095)#441 |
| 50. | Houston Acres | 0.67% | 0.54%(+0.130)#48 | 0.78%(-0.113)#442 |
| 51. | Fort Thomas | 0.61% | 0.54%(+0.077)#49 | 0.78%(-0.167)#443 |
| 52. | Oakbrook | 0.60% | 0.54%(+0.062)#50 | 0.78%(-0.182)#444 |
| 53. | Highland Heights | 0.59% | 0.54%(+0.058)#51 | 0.78%(-0.185)#445 |
| 54. | Hollow Creek | 0.57% | 0.54%(+0.034)#52 | 0.78%(-0.209)#446 |
| 55. | Covington | 0.57% | 0.54%(+0.034)#53 | 0.78%(-0.210)#447 |
| 56. | Prestonsburg | 0.57% | 0.54%(+0.033)#54 | 0.78%(-0.211)#448 |
| 57. | Douglass Hills | 0.57% | 0.54%(+0.032)#55 | 0.78%(-0.212)#449 |
| 58. | Erlanger | 0.57% | 0.54%(+0.031)#56 | 0.78%(-0.212)#450 |
| 59. | Greenup | 0.56% | 0.54%(+0.026)#57 | 0.78%(-0.217)#451 |
| 60. | Brandenburg | 0.55% | 0.54%(+0.017)#58 | 0.78%(-0.227)#452 |
| 61. | Northfield | 0.54% | 0.54%(+0.007)#59 | 0.78%(-0.237)#453 |
| 62. | Ludlow | 0.50% | 0.54%(-0.034)#60 | 0.78%(-0.277)#454 |
| 63. | Kevil | 0.47% | 0.54%(-0.062)#61 | 0.78%(-0.306)#455 |
| 64. | St Matthews | 0.45% | 0.54%(-0.084)#62 | 0.78%(-0.328)#456 |
| 65. | Frankfort | 0.44% | 0.54%(-0.096)#63 | 0.78%(-0.340)#457 |
| 66. | Bellewood | 0.43% | 0.54%(-0.110)#64 | 0.78%(-0.354)#458 |
| 67. | Bellemeade | 0.42% | 0.54%(-0.112)#65 | 0.78%(-0.356)#459 |
| 68. | Francisville | 0.41% | 0.54%(-0.127)#66 | 0.78%(-0.371)#460 |
| 69. | Beechwood Village | 0.38% | 0.54%(-0.152)#67 | 0.78%(-0.395)#461 |
| 70. | Fort Knox | 0.38% | 0.54%(-0.154)#68 | 0.78%(-0.398)#462 |
| 71. | Carlisle | 0.38% | 0.54%(-0.155)#69 | 0.78%(-0.399)#463 |
| 72. | Jeffersontown | 0.37% | 0.54%(-0.164)#70 | 0.78%(-0.408)#464 |
| 73. | Morehead | 0.36% | 0.54%(-0.179)#71 | 0.78%(-0.422)#465 |
| 74. | Hurstbourne Acres | 0.35% | 0.54%(-0.185)#72 | 0.78%(-0.429)#466 |
| 75. | Elizabethtown | 0.33% | 0.54%(-0.201)#73 | 0.78%(-0.445)#467 |
| 76. | Hazard | 0.33% | 0.54%(-0.208)#74 | 0.78%(-0.452)#468 |
| 77. | Bromley | 0.31% | 0.54%(-0.222)#75 | 0.78%(-0.465)#469 |
| 78. | Maysville | 0.31% | 0.54%(-0.230)#76 | 0.78%(-0.474)#470 |
| 79. | Owenton | 0.30% | 0.54%(-0.231)#77 | 0.78%(-0.474)#471 |
| 80. | Silver Grove | 0.30% | 0.54%(-0.236)#78 | 0.78%(-0.480)#472 |
| 81. | Campbellsville | 0.30% | 0.54%(-0.238)#79 | 0.78%(-0.482)#473 |
| 82. | Fulton | 0.30% | 0.54%(-0.239)#80 | 0.78%(-0.482)#474 |
| 83. | Park City | 0.29% | 0.54%(-0.250)#81 | 0.78%(-0.494)#475 |
| 84. | Old Brownsboro Place | 0.26% | 0.54%(-0.275)#82 | 0.78%(-0.519)#476 |
| 85. | Fort Wright | 0.26% | 0.54%(-0.279)#83 | 0.78%(-0.522)#477 |
| 86. | Williamsburg | 0.25% | 0.54%(-0.287)#84 | 0.78%(-0.531)#478 |
| 87. | La Grange | 0.25% | 0.54%(-0.287)#85 | 0.78%(-0.531)#479 |
| 88. | Prospect | 0.22% | 0.54%(-0.319)#86 | 0.78%(-0.563)#480 |
| 89. | West Liberty | 0.22% | 0.54%(-0.320)#87 | 0.78%(-0.564)#481 |
| 90. | Hopkinsville | 0.21% | 0.54%(-0.329)#88 | 0.78%(-0.573)#482 |
| 91. | River Bluff | 0.20% | 0.54%(-0.334)#89 | 0.78%(-0.578)#483 |
| 92. | Richmond | 0.20% | 0.54%(-0.338)#90 | 0.78%(-0.581)#484 |
| 93. | Somerset | 0.19% | 0.54%(-0.344)#91 | 0.78%(-0.588)#485 |
| 94. | Alexandria | 0.18% | 0.54%(-0.352)#92 | 0.78%(-0.595)#486 |
| 95. | Indian Hills | 0.17% | 0.54%(-0.363)#93 | 0.78%(-0.606)#487 |
| 96. | Murray | 0.16% | 0.54%(-0.381)#94 | 0.78%(-0.624)#488 |
| 97. | Owensboro | 0.15% | 0.54%(-0.386)#95 | 0.78%(-0.629)#489 |
| 98. | Shively | 0.14% | 0.54%(-0.395)#96 | 0.78%(-0.638)#490 |
| 99. | Carrollton | 0.13% | 0.54%(-0.407)#97 | 0.78%(-0.651)#491 |
| 100. | Sturgis | 0.12% | 0.54%(-0.417)#98 | 0.78%(-0.661)#492 |
Common Questions
What are the Top 10 Cities with the Highest Percentage of Immigrants from Africa in Kentucky?
Top 10 Cities with the Highest Percentage of Immigrants from Africa in Kentucky are:
#1
13.53%
#2
9.40%
#3
6.84%
#4
5.19%
#5
4.58%
#6
4.23%
#7
3.48%
#8
3.47%
#9
2.88%
#10
2.73%
What city has the Highest Percentage of Immigrants from Africa in Kentucky?
West Buechel has the Highest Percentage of Immigrants from Africa in Kentucky with 13.53%.
What is the Percentage of Immigrants from Africa in the State of Kentucky?
Percentage of Immigrants from Africa in Kentucky is 0.54%.
What is the Percentage of Immigrants from Africa in the United States?
Percentage of Immigrants from Africa in the United States is 0.78%.