Cities with the Highest Percentage of Immigrants from Africa in Michigan
RELATED REPORTS & OPTIONS
Africa
Michigan
Compare Cities
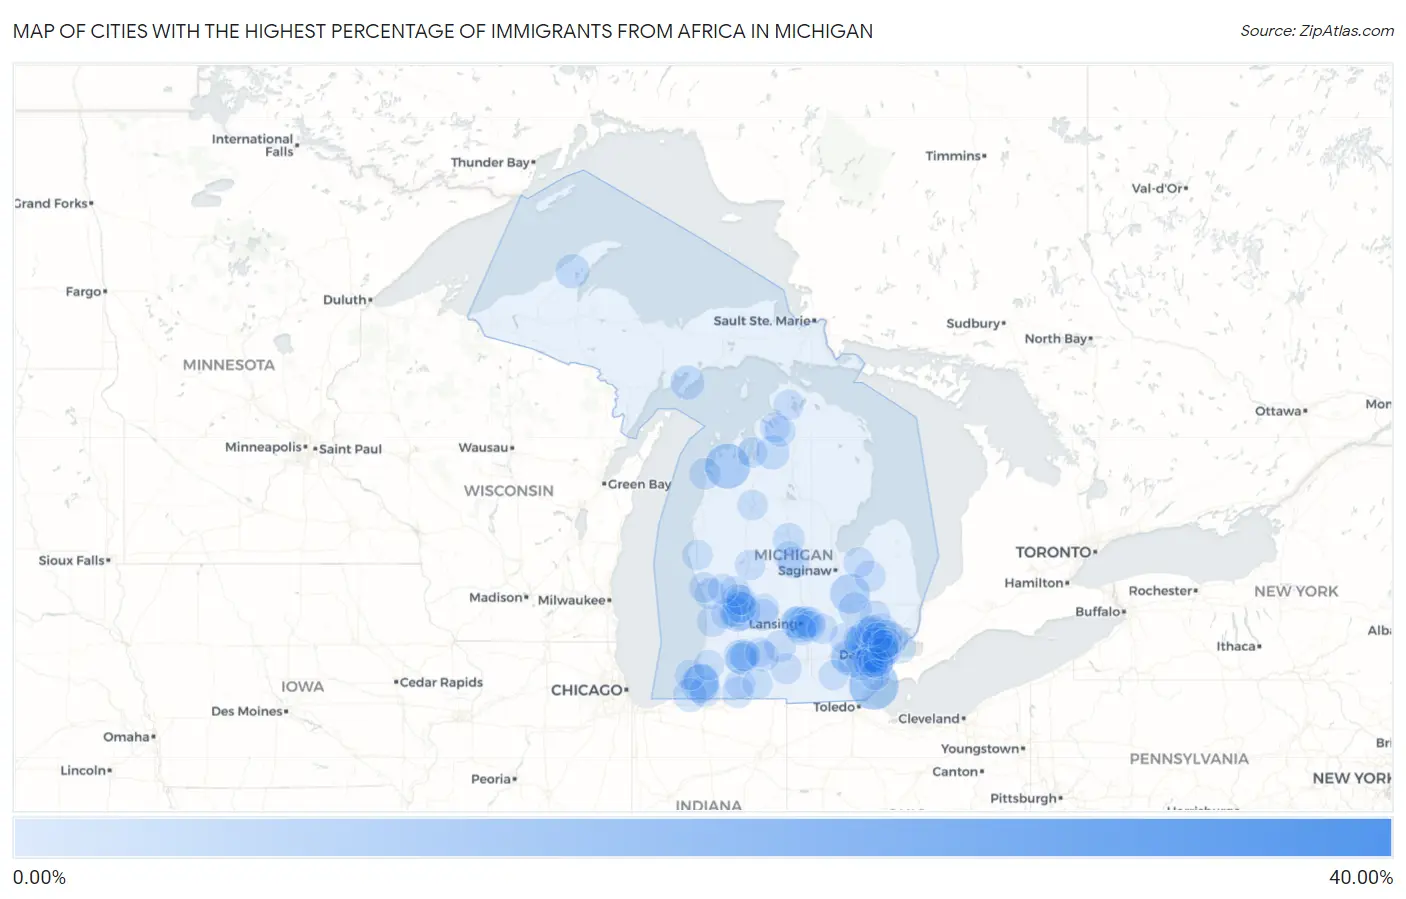
Map of Cities with the Highest Percentage of Immigrants from Africa in Michigan
0.00%
40.00%
Cities with the Highest Percentage of Immigrants from Africa in Michigan
| City | Africa | vs State | vs National | |
| 1. | Scotts | 32.97% | 0.39%(+32.6)#-1 | 0.78%(+32.2)#0 |
| 2. | Stony Point | 10.08% | 0.39%(+9.69)#0 | 0.78%(+9.30)#1 |
| 3. | Lake Ann | 7.80% | 0.39%(+7.41)#1 | 0.78%(+7.02)#2 |
| 4. | Mount Morris | 5.08% | 0.39%(+4.69)#2 | 0.78%(+4.30)#3 |
| 5. | Berrien Springs | 4.30% | 0.39%(+3.91)#3 | 0.78%(+3.52)#4 |
| 6. | Kentwood | 4.22% | 0.39%(+3.82)#4 | 0.78%(+3.44)#5 |
| 7. | Orchard Lake Village | 3.50% | 0.39%(+3.11)#5 | 0.78%(+2.72)#6 |
| 8. | Eau Claire | 2.81% | 0.39%(+2.42)#6 | 0.78%(+2.04)#7 |
| 9. | Garden | 2.37% | 0.39%(+1.97)#7 | 0.78%(+1.59)#8 |
| 10. | Houghton | 2.34% | 0.39%(+1.94)#8 | 0.78%(+1.56)#9 |
| 11. | Lansing | 2.29% | 0.39%(+1.90)#9 | 0.78%(+1.51)#10 |
| 12. | Mancelona | 2.22% | 0.39%(+1.83)#10 | 0.78%(+1.44)#11 |
| 13. | Galien | 2.04% | 0.39%(+1.65)#11 | 0.78%(+1.26)#12 |
| 14. | Wayne | 1.87% | 0.39%(+1.47)#12 | 0.78%(+1.09)#13 |
| 15. | Cutlerville | 1.86% | 0.39%(+1.47)#13 | 0.78%(+1.08)#14 |
| 16. | Grand Blanc | 1.84% | 0.39%(+1.45)#14 | 0.78%(+1.06)#15 |
| 17. | Westwood | 1.82% | 0.39%(+1.42)#15 | 0.78%(+1.04)#16 |
| 18. | Westland | 1.82% | 0.39%(+1.42)#16 | 0.78%(+1.04)#338 |
| 19. | Edgemont Park | 1.68% | 0.39%(+1.28)#17 | 0.78%(+0.898)#339 |
| 20. | Grand Rapids | 1.57% | 0.39%(+1.18)#18 | 0.78%(+0.792)#340 |
| 21. | East Lansing | 1.53% | 0.39%(+1.14)#19 | 0.78%(+0.749)#341 |
| 22. | Dearborn Heights | 1.41% | 0.39%(+1.02)#20 | 0.78%(+0.631)#342 |
| 23. | Novi | 1.31% | 0.39%(+0.914)#21 | 0.78%(+0.528)#343 |
| 24. | Ann Arbor | 1.29% | 0.39%(+0.895)#22 | 0.78%(+0.509)#344 |
| 25. | Village Of Grosse Pointe Shores | 1.23% | 0.39%(+0.833)#23 | 0.78%(+0.447)#345 |
| 26. | Wyoming | 1.18% | 0.39%(+0.788)#24 | 0.78%(+0.401)#346 |
| 27. | Farmington Hills | 1.15% | 0.39%(+0.760)#25 | 0.78%(+0.374)#472 |
| 28. | Southfield | 1.14% | 0.39%(+0.746)#26 | 0.78%(+0.360)#481 |
| 29. | Ypsilanti | 1.14% | 0.39%(+0.745)#27 | 0.78%(+0.359)#482 |
| 30. | Parchment | 1.13% | 0.39%(+0.734)#28 | 0.78%(+0.348)#483 |
| 31. | Barton Hills | 1.13% | 0.39%(+0.733)#29 | 0.78%(+0.347)#484 |
| 32. | Waverly | 1.12% | 0.39%(+0.728)#30 | 0.78%(+0.342)#485 |
| 33. | Fraser | 1.12% | 0.39%(+0.725)#31 | 0.78%(+0.339)#486 |
| 34. | Clarksville | 1.11% | 0.39%(+0.715)#32 | 0.78%(+0.329)#487 |
| 35. | Clare | 1.10% | 0.39%(+0.706)#33 | 0.78%(+0.320)#488 |
| 36. | Frankfort | 1.09% | 0.39%(+0.694)#34 | 0.78%(+0.308)#489 |
| 37. | Dearborn | 1.07% | 0.39%(+0.679)#35 | 0.78%(+0.293)#490 |
| 38. | Olivet | 1.07% | 0.39%(+0.672)#36 | 0.78%(+0.286)#491 |
| 39. | Shepherd | 1.06% | 0.39%(+0.667)#37 | 0.78%(+0.281)#492 |
| 40. | Kalamazoo | 1.03% | 0.39%(+0.639)#38 | 0.78%(+0.253)#493 |
| 41. | Comstock Park | 1.03% | 0.39%(+0.638)#39 | 0.78%(+0.252)#494 |
| 42. | Walled Lake | 1.02% | 0.39%(+0.626)#40 | 0.78%(+0.240)#495 |
| 43. | Melvindale | 0.98% | 0.39%(+0.588)#41 | 0.78%(+0.202)#496 |
| 44. | Holland | 0.97% | 0.39%(+0.581)#42 | 0.78%(+0.195)#497 |
| 45. | Troy | 0.97% | 0.39%(+0.574)#43 | 0.78%(+0.188)#498 |
| 46. | Niles | 0.95% | 0.39%(+0.559)#44 | 0.78%(+0.173)#499 |
| 47. | Fruitport | 0.94% | 0.39%(+0.543)#45 | 0.78%(+0.157)#500 |
| 48. | Oak Park | 0.92% | 0.39%(+0.529)#46 | 0.78%(+0.143)#501 |
| 49. | Constantine | 0.90% | 0.39%(+0.510)#47 | 0.78%(+0.124)#502 |
| 50. | Mayville | 0.86% | 0.39%(+0.464)#48 | 0.78%(+0.078)#503 |
| 51. | Wixom | 0.83% | 0.39%(+0.436)#49 | 0.78%(+0.050)#504 |
| 52. | Rochester Hills | 0.80% | 0.39%(+0.412)#50 | 0.78%(+0.026)#505 |
| 53. | Keego Harbor | 0.79% | 0.39%(+0.401)#51 | 0.78%(+0.015)#506 |
| 54. | Homer | 0.78% | 0.39%(+0.389)#52 | 0.78%(+0.002)#507 |
| 55. | Brighton | 0.77% | 0.39%(+0.382)#53 | 0.78%(-0.004)#508 |
| 56. | Haslett | 0.76% | 0.39%(+0.366)#54 | 0.78%(-0.020)#509 |
| 57. | Oxford | 0.69% | 0.39%(+0.295)#55 | 0.78%(-0.091)#510 |
| 58. | Okemos | 0.68% | 0.39%(+0.288)#56 | 0.78%(-0.098)#511 |
| 59. | Belleville | 0.68% | 0.39%(+0.285)#57 | 0.78%(-0.101)#512 |
| 60. | Lathrup Village | 0.64% | 0.39%(+0.245)#58 | 0.78%(-0.141)#513 |
| 61. | Fairgrove | 0.60% | 0.39%(+0.206)#59 | 0.78%(-0.180)#514 |
| 62. | Holt | 0.59% | 0.39%(+0.198)#60 | 0.78%(-0.188)#515 |
| 63. | Boyne Falls | 0.59% | 0.39%(+0.193)#61 | 0.78%(-0.193)#516 |
| 64. | Battle Creek | 0.59% | 0.39%(+0.192)#62 | 0.78%(-0.194)#517 |
| 65. | East Grand Rapids | 0.56% | 0.39%(+0.169)#63 | 0.78%(-0.217)#518 |
| 66. | Southgate | 0.55% | 0.39%(+0.161)#64 | 0.78%(-0.225)#519 |
| 67. | Cadillac | 0.55% | 0.39%(+0.155)#65 | 0.78%(-0.231)#520 |
| 68. | Inkster | 0.53% | 0.39%(+0.141)#66 | 0.78%(-0.245)#521 |
| 69. | Sterling Heights | 0.50% | 0.39%(+0.105)#67 | 0.78%(-0.281)#522 |
| 70. | Shelby | 0.48% | 0.39%(+0.083)#68 | 0.78%(-0.303)#523 |
| 71. | Brutus | 0.47% | 0.39%(+0.081)#69 | 0.78%(-0.305)#524 |
| 72. | Morley | 0.46% | 0.39%(+0.069)#70 | 0.78%(-0.317)#525 |
| 73. | Romulus | 0.46% | 0.39%(+0.066)#71 | 0.78%(-0.320)#526 |
| 74. | Mount Pleasant | 0.44% | 0.39%(+0.051)#72 | 0.78%(-0.335)#527 |
| 75. | Roosevelt Park | 0.43% | 0.39%(+0.042)#73 | 0.78%(-0.344)#528 |
| 76. | Shoreham | 0.43% | 0.39%(+0.041)#74 | 0.78%(-0.345)#529 |
| 77. | Hamtramck | 0.41% | 0.39%(+0.020)#75 | 0.78%(-0.366)#530 |
| 78. | Highland Park | 0.41% | 0.39%(+0.016)#76 | 0.78%(-0.370)#531 |
| 79. | Pontiac | 0.41% | 0.39%(+0.015)#77 | 0.78%(-0.371)#532 |
| 80. | Three Rivers | 0.40% | 0.39%(+0.011)#78 | 0.78%(-0.375)#533 |
| 81. | Hudsonville | 0.39% | 0.39%(-0.000)#79 | 0.78%(-0.386)#534 |
| 82. | Eastwood | 0.38% | 0.39%(-0.008)#80 | 0.78%(-0.394)#535 |
| 83. | Lincoln Park | 0.37% | 0.39%(-0.021)#81 | 0.78%(-0.407)#536 |
| 84. | Saranac | 0.36% | 0.39%(-0.033)#82 | 0.78%(-0.420)#537 |
| 85. | Colon | 0.36% | 0.39%(-0.034)#83 | 0.78%(-0.420)#538 |
| 86. | Hartford | 0.35% | 0.39%(-0.042)#84 | 0.78%(-0.428)#539 |
| 87. | South Rockwood | 0.34% | 0.39%(-0.049)#85 | 0.78%(-0.435)#540 |
| 88. | Detroit | 0.34% | 0.39%(-0.057)#86 | 0.78%(-0.444)#564 |
| 89. | Center Line | 0.33% | 0.39%(-0.063)#87 | 0.78%(-0.450)#565 |
| 90. | Taylor | 0.33% | 0.39%(-0.064)#88 | 0.78%(-0.450)#566 |
| 91. | Elk Rapids | 0.32% | 0.39%(-0.074)#89 | 0.78%(-0.460)#567 |
| 92. | Boyne City | 0.31% | 0.39%(-0.079)#90 | 0.78%(-0.465)#568 |
| 93. | Birmingham | 0.31% | 0.39%(-0.080)#91 | 0.78%(-0.466)#569 |
| 94. | Clinton | 0.31% | 0.39%(-0.086)#92 | 0.78%(-0.472)#570 |
| 95. | Webberville | 0.30% | 0.39%(-0.094)#93 | 0.78%(-0.480)#571 |
| 96. | Hazel Park | 0.30% | 0.39%(-0.094)#94 | 0.78%(-0.481)#572 |
| 97. | Level Park Oak Park | 0.30% | 0.39%(-0.096)#95 | 0.78%(-0.482)#573 |
| 98. | Sparta | 0.28% | 0.39%(-0.111)#96 | 0.78%(-0.497)#574 |
| 99. | Northview | 0.28% | 0.39%(-0.114)#97 | 0.78%(-0.501)#575 |
| 100. | Ravenna | 0.28% | 0.39%(-0.115)#98 | 0.78%(-0.501)#576 |
Common Questions
What are the Top 10 Cities with the Highest Percentage of Immigrants from Africa in Michigan?
Top 10 Cities with the Highest Percentage of Immigrants from Africa in Michigan are:
#1
10.08%
#2
7.80%
#3
5.08%
#4
4.30%
#5
4.22%
#6
3.50%
#7
2.81%
#8
2.37%
#9
2.34%
#10
2.29%
What city has the Highest Percentage of Immigrants from Africa in Michigan?
Stony Point has the Highest Percentage of Immigrants from Africa in Michigan with 10.08%.
What is the Percentage of Immigrants from Africa in the State of Michigan?
Percentage of Immigrants from Africa in Michigan is 0.39%.
What is the Percentage of Immigrants from Africa in the United States?
Percentage of Immigrants from Africa in the United States is 0.78%.