Cities with the Highest Percentage of Immigrants from Africa in Nebraska
RELATED REPORTS & OPTIONS
Africa
Nebraska
Compare Cities
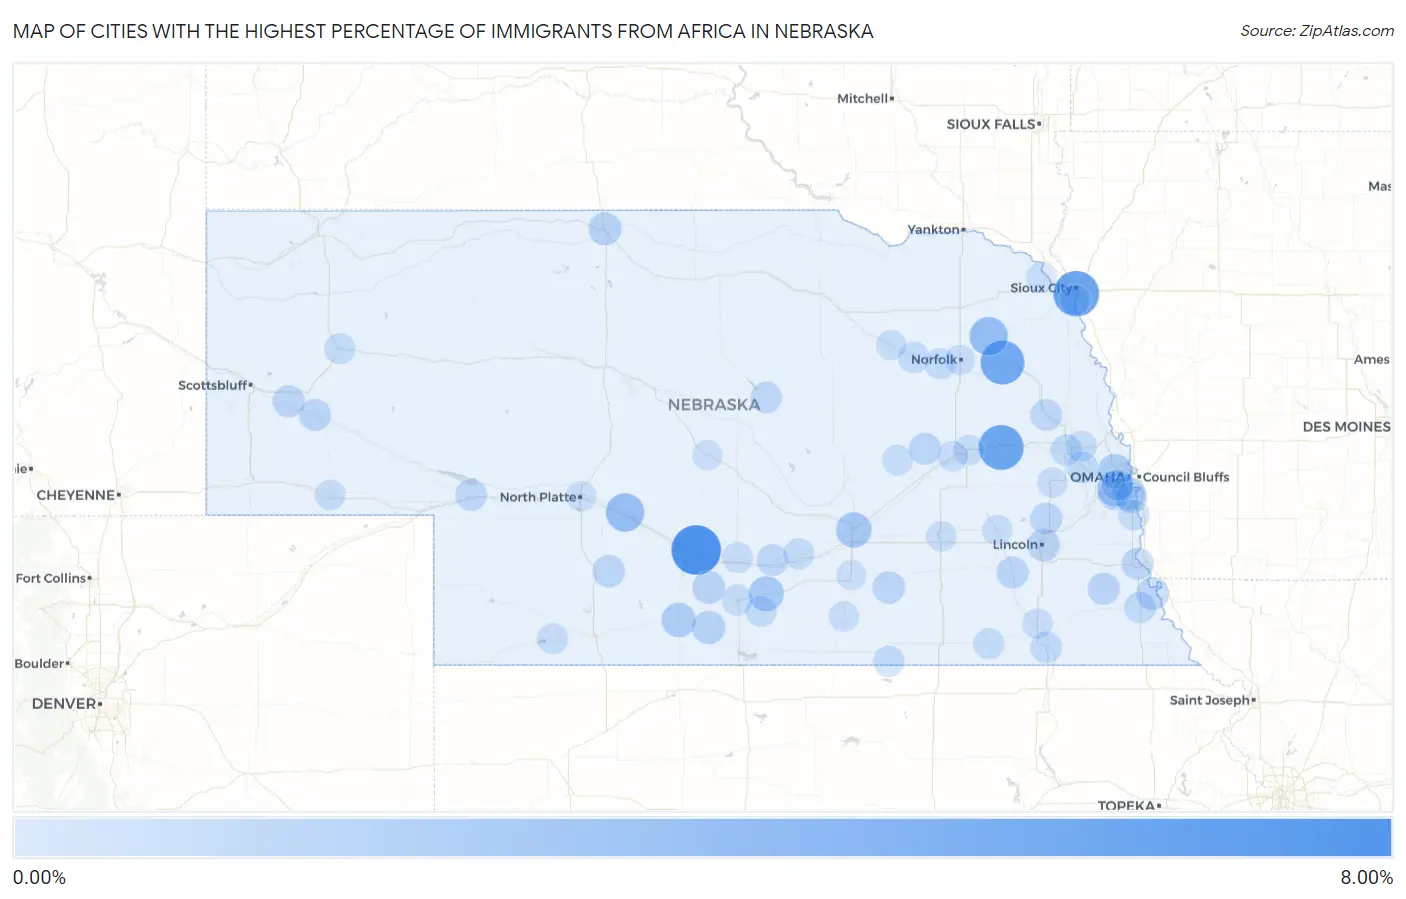
Map of Cities with the Highest Percentage of Immigrants from Africa in Nebraska
0.00%
8.00%
Cities with the Highest Percentage of Immigrants from Africa in Nebraska
| City | Africa | vs State | vs National | |
| 1. | Lexington | 6.72% | 0.78%(+5.94)#-1 | 0.78%(+5.95)#0 |
| 2. | South Sioux City | 5.35% | 0.78%(+4.56)#0 | 0.78%(+4.57)#1 |
| 3. | Schuyler | 5.03% | 0.78%(+4.25)#1 | 0.78%(+4.25)#2 |
| 4. | Pilger | 4.67% | 0.78%(+3.88)#2 | 0.78%(+3.89)#3 |
| 5. | Winside | 2.75% | 0.78%(+1.96)#3 | 0.78%(+1.97)#4 |
| 6. | Brady | 2.73% | 0.78%(+1.95)#4 | 0.78%(+1.95)#5 |
| 7. | La Vista | 1.80% | 0.78%(+1.02)#5 | 0.78%(+1.02)#6 |
| 8. | Grand Island | 1.79% | 0.78%(+1.01)#6 | 0.78%(+1.02)#7 |
| 9. | Axtell | 1.66% | 0.78%(+0.880)#7 | 0.78%(+0.885)#8 |
| 10. | Omaha | 1.52% | 0.78%(+0.738)#8 | 0.78%(+0.743)#566 |
| 11. | Arapahoe | 1.43% | 0.78%(+0.650)#9 | 0.78%(+0.655)#567 |
| 12. | Bellevue | 1.15% | 0.78%(+0.363)#10 | 0.78%(+0.369)#568 |
| 13. | Oxford | 1.04% | 0.78%(+0.260)#11 | 0.78%(+0.265)#569 |
| 14. | Valentine | 0.95% | 0.78%(+0.169)#12 | 0.78%(+0.175)#570 |
| 15. | Bertrand | 0.88% | 0.78%(+0.097)#13 | 0.78%(+0.102)#571 |
| 16. | Lincoln | 0.84% | 0.78%(+0.052)#14 | 0.78%(+0.057)#572 |
| 17. | Peru | 0.83% | 0.78%(+0.041)#15 | 0.78%(+0.046)#573 |
| 18. | Clay Center | 0.77% | 0.78%(-0.015)#16 | 0.78%(-0.010)#574 |
| 19. | Curtis | 0.76% | 0.78%(-0.021)#17 | 0.78%(-0.016)#575 |
| 20. | Bayard | 0.70% | 0.78%(-0.087)#18 | 0.78%(-0.082)#576 |
| 21. | Crete | 0.68% | 0.78%(-0.108)#19 | 0.78%(-0.103)#577 |
| 22. | Davey | 0.67% | 0.78%(-0.113)#20 | 0.78%(-0.108)#578 |
| 23. | Cook | 0.67% | 0.78%(-0.118)#21 | 0.78%(-0.113)#579 |
| 24. | Genoa | 0.66% | 0.78%(-0.127)#22 | 0.78%(-0.122)#580 |
| 25. | Bridgeport | 0.65% | 0.78%(-0.134)#23 | 0.78%(-0.129)#581 |
| 26. | Nebraska City | 0.62% | 0.78%(-0.164)#24 | 0.78%(-0.159)#582 |
| 27. | Papillion | 0.60% | 0.78%(-0.189)#25 | 0.78%(-0.184)#583 |
| 28. | Ogallala | 0.58% | 0.78%(-0.205)#26 | 0.78%(-0.200)#584 |
| 29. | Burwell | 0.53% | 0.78%(-0.251)#27 | 0.78%(-0.246)#585 |
| 30. | Kearney | 0.53% | 0.78%(-0.252)#28 | 0.78%(-0.247)#586 |
| 31. | Scribner | 0.51% | 0.78%(-0.271)#29 | 0.78%(-0.266)#587 |
| 32. | Auburn | 0.50% | 0.78%(-0.289)#30 | 0.78%(-0.284)#588 |
| 33. | Valley | 0.49% | 0.78%(-0.290)#31 | 0.78%(-0.285)#589 |
| 34. | Offutt Afb | 0.48% | 0.78%(-0.305)#32 | 0.78%(-0.299)#590 |
| 35. | Ralston | 0.48% | 0.78%(-0.305)#33 | 0.78%(-0.300)#591 |
| 36. | Wymore | 0.47% | 0.78%(-0.318)#34 | 0.78%(-0.313)#592 |
| 37. | Fremont | 0.41% | 0.78%(-0.369)#35 | 0.78%(-0.364)#593 |
| 38. | Tilden | 0.36% | 0.78%(-0.424)#36 | 0.78%(-0.419)#594 |
| 39. | Superior | 0.31% | 0.78%(-0.469)#37 | 0.78%(-0.464)#595 |
| 40. | Fairbury | 0.31% | 0.78%(-0.478)#38 | 0.78%(-0.473)#596 |
| 41. | Wilcox | 0.29% | 0.78%(-0.495)#39 | 0.78%(-0.490)#597 |
| 42. | Battle Creek | 0.28% | 0.78%(-0.500)#40 | 0.78%(-0.495)#598 |
| 43. | Alliance | 0.28% | 0.78%(-0.501)#41 | 0.78%(-0.496)#599 |
| 44. | Gibbon | 0.28% | 0.78%(-0.504)#42 | 0.78%(-0.499)#600 |
| 45. | Holdrege | 0.27% | 0.78%(-0.511)#43 | 0.78%(-0.506)#601 |
| 46. | Arlington | 0.26% | 0.78%(-0.521)#44 | 0.78%(-0.516)#602 |
| 47. | Elm Creek | 0.26% | 0.78%(-0.529)#45 | 0.78%(-0.524)#603 |
| 48. | Trenton | 0.23% | 0.78%(-0.558)#46 | 0.78%(-0.553)#604 |
| 49. | Fullerton | 0.22% | 0.78%(-0.563)#47 | 0.78%(-0.558)#605 |
| 50. | Dakota City | 0.21% | 0.78%(-0.574)#48 | 0.78%(-0.569)#606 |
| 51. | Columbus | 0.20% | 0.78%(-0.585)#49 | 0.78%(-0.580)#607 |
| 52. | Plattsmouth | 0.18% | 0.78%(-0.602)#50 | 0.78%(-0.597)#608 |
| 53. | Sidney | 0.17% | 0.78%(-0.613)#51 | 0.78%(-0.608)#609 |
| 54. | Duncan | 0.16% | 0.78%(-0.626)#52 | 0.78%(-0.621)#610 |
| 55. | Beatrice | 0.15% | 0.78%(-0.637)#53 | 0.78%(-0.632)#611 |
| 56. | Ponca | 0.14% | 0.78%(-0.644)#54 | 0.78%(-0.639)#612 |
| 57. | Blue Hill | 0.11% | 0.78%(-0.671)#55 | 0.78%(-0.666)#613 |
| 58. | York | 0.11% | 0.78%(-0.673)#56 | 0.78%(-0.668)#614 |
| 59. | Seward | 0.065% | 0.78%(-0.719)#57 | 0.78%(-0.714)#615 |
| 60. | Wahoo | 0.062% | 0.78%(-0.722)#58 | 0.78%(-0.717)#616 |
| 61. | Norfolk | 0.062% | 0.78%(-0.723)#59 | 0.78%(-0.717)#617 |
| 62. | Neligh | 0.062% | 0.78%(-0.723)#60 | 0.78%(-0.718)#618 |
| 63. | North Platte | 0.056% | 0.78%(-0.729)#61 | 0.78%(-0.724)#619 |
| 64. | Broken Bow | 0.028% | 0.78%(-0.756)#62 | 0.78%(-0.751)#620 |
| 65. | Hastings | 0.012% | 0.78%(-0.772)#63 | 0.78%(-0.767)#621 |
Common Questions
What are the Top 10 Cities with the Highest Percentage of Immigrants from Africa in Nebraska?
Top 10 Cities with the Highest Percentage of Immigrants from Africa in Nebraska are:
#1
6.72%
#2
5.35%
#3
5.03%
#4
4.67%
#5
2.75%
#6
2.73%
#7
1.80%
#8
1.79%
#9
1.66%
#10
1.52%
What city has the Highest Percentage of Immigrants from Africa in Nebraska?
Lexington has the Highest Percentage of Immigrants from Africa in Nebraska with 6.72%.
What is the Percentage of Immigrants from Africa in the State of Nebraska?
Percentage of Immigrants from Africa in Nebraska is 0.78%.
What is the Percentage of Immigrants from Africa in the United States?
Percentage of Immigrants from Africa in the United States is 0.78%.