Cities with the Highest Percentage of Immigrants from Africa in Florida
RELATED REPORTS & OPTIONS
Africa
Florida
Compare Cities
Map of Cities with the Highest Percentage of Immigrants from Africa in Florida
0.00%
15.00%
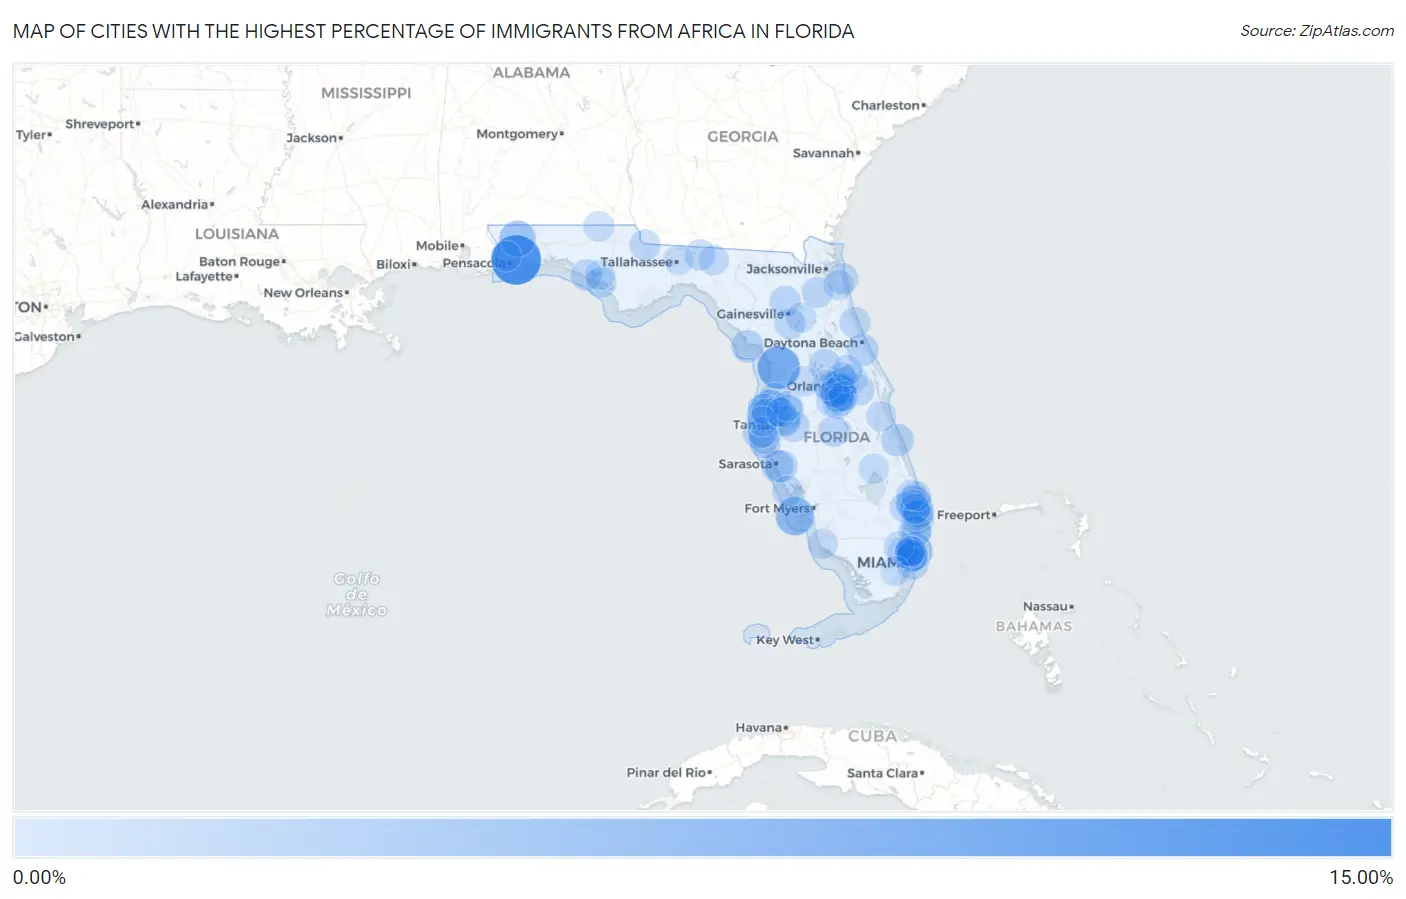
Cities with the Highest Percentage of Immigrants from Africa in Florida
| City | Africa | vs State | vs National | |
| 1. | Garcon Point | 13.30% | 0.37%(+12.9)#-1 | 0.78%(+12.5)#0 |
| 2. | Lecanto | 8.65% | 0.37%(+8.28)#0 | 0.78%(+7.87)#1 |
| 3. | Captiva | 5.96% | 0.37%(+5.59)#1 | 0.78%(+5.18)#2 |
| 4. | Trinity | 5.38% | 0.37%(+5.01)#2 | 0.78%(+4.60)#3 |
| 5. | Golden Beach | 5.29% | 0.37%(+4.92)#3 | 0.78%(+4.51)#4 |
| 6. | Allentown | 4.47% | 0.37%(+4.10)#4 | 0.78%(+3.69)#5 |
| 7. | Schall Circle | 4.32% | 0.37%(+3.95)#5 | 0.78%(+3.54)#6 |
| 8. | Tangelo Park | 3.08% | 0.37%(+2.71)#6 | 0.78%(+2.30)#7 |
| 9. | Windermere | 2.73% | 0.37%(+2.36)#7 | 0.78%(+1.95)#8 |
| 10. | Gulf Stream | 2.59% | 0.37%(+2.23)#8 | 0.78%(+1.82)#9 |
| 11. | Lake Clarke Shores | 2.48% | 0.37%(+2.11)#9 | 0.78%(+1.70)#10 |
| 12. | Indian River Shores | 2.23% | 0.37%(+1.86)#10 | 0.78%(+1.45)#11 |
| 13. | Pebble Creek | 2.21% | 0.37%(+1.85)#11 | 0.78%(+1.43)#12 |
| 14. | Williamsburg | 2.17% | 0.37%(+1.80)#12 | 0.78%(+1.39)#13 |
| 15. | Lighthouse Point | 2.14% | 0.37%(+1.77)#13 | 0.78%(+1.36)#14 |
| 16. | Vilano Beach | 2.14% | 0.37%(+1.77)#14 | 0.78%(+1.36)#15 |
| 17. | Cedar Key | 2.13% | 0.37%(+1.76)#15 | 0.78%(+1.35)#16 |
| 18. | Lake Sarasota | 2.03% | 0.37%(+1.66)#16 | 0.78%(+1.25)#17 |
| 19. | Redington Shores | 1.97% | 0.37%(+1.60)#17 | 0.78%(+1.19)#18 |
| 20. | Eustis | 1.94% | 0.37%(+1.57)#18 | 0.78%(+1.16)#19 |
| 21. | South Gate Ridge | 1.92% | 0.37%(+1.56)#19 | 0.78%(+1.15)#20 |
| 22. | Port Orange | 1.89% | 0.37%(+1.52)#20 | 0.78%(+1.11)#21 |
| 23. | Orlovista | 1.86% | 0.37%(+1.49)#21 | 0.78%(+1.08)#22 |
| 24. | Holden Lakes | 1.84% | 0.37%(+1.47)#22 | 0.78%(+1.06)#23 |
| 25. | Old Miakka | 1.84% | 0.37%(+1.47)#23 | 0.78%(+1.06)#24 |
| 26. | Aventura | 1.83% | 0.37%(+1.46)#24 | 0.78%(+1.05)#25 |
| 27. | Fisher Island | 1.76% | 0.37%(+1.39)#25 | 0.78%(+0.983)#26 |
| 28. | Surfside | 1.69% | 0.37%(+1.32)#26 | 0.78%(+0.910)#27 |
| 29. | Quail Ridge | 1.67% | 0.37%(+1.30)#27 | 0.78%(+0.893)#28 |
| 30. | Tierra Verde | 1.67% | 0.37%(+1.30)#28 | 0.78%(+0.891)#29 |
| 31. | Palm Harbor | 1.62% | 0.37%(+1.25)#29 | 0.78%(+0.836)#233 |
| 32. | North Bay Village | 1.55% | 0.37%(+1.18)#30 | 0.78%(+0.766)#234 |
| 33. | Temple Terrace | 1.51% | 0.37%(+1.14)#31 | 0.78%(+0.731)#235 |
| 34. | Panama City Beach | 1.46% | 0.37%(+1.09)#32 | 0.78%(+0.681)#236 |
| 35. | Sawgrass | 1.46% | 0.37%(+1.09)#33 | 0.78%(+0.677)#237 |
| 36. | Valrico | 1.42% | 0.37%(+1.05)#34 | 0.78%(+0.643)#238 |
| 37. | Beverly Beach | 1.41% | 0.37%(+1.05)#35 | 0.78%(+0.635)#239 |
| 38. | Babson Park | 1.40% | 0.37%(+1.03)#36 | 0.78%(+0.621)#240 |
| 39. | East Lake | 1.37% | 0.37%(+1.00)#37 | 0.78%(+0.592)#241 |
| 40. | Micanopy | 1.34% | 0.37%(+0.972)#38 | 0.78%(+0.562)#242 |
| 41. | Oak Ridge | 1.34% | 0.37%(+0.967)#39 | 0.78%(+0.557)#243 |
| 42. | Monticello | 1.31% | 0.37%(+0.944)#40 | 0.78%(+0.534)#244 |
| 43. | Wedgefield | 1.30% | 0.37%(+0.936)#41 | 0.78%(+0.526)#245 |
| 44. | Southchase | 1.27% | 0.37%(+0.903)#42 | 0.78%(+0.492)#246 |
| 45. | Penney Farms | 1.25% | 0.37%(+0.879)#43 | 0.78%(+0.469)#247 |
| 46. | Chattahoochee | 1.24% | 0.37%(+0.875)#44 | 0.78%(+0.464)#248 |
| 47. | Winter Park | 1.23% | 0.37%(+0.862)#45 | 0.78%(+0.451)#249 |
| 48. | La Crosse | 1.23% | 0.37%(+0.858)#46 | 0.78%(+0.448)#250 |
| 49. | Grove City | 1.15% | 0.37%(+0.782)#47 | 0.78%(+0.372)#251 |
| 50. | East Lake Orient Park | 1.15% | 0.37%(+0.777)#48 | 0.78%(+0.366)#252 |
| 51. | Edgewood | 1.12% | 0.37%(+0.747)#49 | 0.78%(+0.336)#253 |
| 52. | St Pete Beach | 1.11% | 0.37%(+0.743)#50 | 0.78%(+0.332)#254 |
| 53. | University Cdp Orange County | 1.11% | 0.37%(+0.742)#51 | 0.78%(+0.332)#255 |
| 54. | Bal Harbour | 1.09% | 0.37%(+0.718)#52 | 0.78%(+0.308)#256 |
| 55. | Lake Belvedere Estates | 1.08% | 0.37%(+0.712)#53 | 0.78%(+0.302)#257 |
| 56. | Bay Harbor Islands | 1.08% | 0.37%(+0.709)#54 | 0.78%(+0.299)#258 |
| 57. | Country Club | 1.07% | 0.37%(+0.704)#55 | 0.78%(+0.294)#259 |
| 58. | Parker | 1.07% | 0.37%(+0.699)#56 | 0.78%(+0.288)#260 |
| 59. | University Cdp Hillsborough County | 1.06% | 0.37%(+0.693)#57 | 0.78%(+0.283)#261 |
| 60. | Wellington | 1.02% | 0.37%(+0.653)#58 | 0.78%(+0.242)#262 |
| 61. | Celebration | 1.00% | 0.37%(+0.629)#59 | 0.78%(+0.218)#263 |
| 62. | Hillsboro Beach | 0.99% | 0.37%(+0.620)#60 | 0.78%(+0.209)#264 |
| 63. | Oviedo | 0.98% | 0.37%(+0.615)#61 | 0.78%(+0.204)#265 |
| 64. | Cheval | 0.94% | 0.37%(+0.571)#62 | 0.78%(+0.161)#266 |
| 65. | Manalapan | 0.92% | 0.37%(+0.551)#63 | 0.78%(+0.141)#267 |
| 66. | Bay Pines | 0.92% | 0.37%(+0.551)#64 | 0.78%(+0.141)#268 |
| 67. | Holiday | 0.90% | 0.37%(+0.534)#65 | 0.78%(+0.123)#269 |
| 68. | Esto | 0.89% | 0.37%(+0.524)#66 | 0.78%(+0.114)#270 |
| 69. | Sunny Isles Beach | 0.89% | 0.37%(+0.518)#67 | 0.78%(+0.108)#271 |
| 70. | Campbell | 0.88% | 0.37%(+0.515)#68 | 0.78%(+0.105)#272 |
| 71. | Ocean Ridge | 0.88% | 0.37%(+0.507)#69 | 0.78%(+0.097)#273 |
| 72. | Wesley Chapel | 0.87% | 0.37%(+0.506)#70 | 0.78%(+0.096)#274 |
| 73. | Hunters Creek | 0.87% | 0.37%(+0.506)#71 | 0.78%(+0.095)#275 |
| 74. | Ensley | 0.87% | 0.37%(+0.503)#72 | 0.78%(+0.092)#276 |
| 75. | Kissimmee | 0.87% | 0.37%(+0.499)#73 | 0.78%(+0.088)#277 |
| 76. | Greenville | 0.84% | 0.37%(+0.472)#74 | 0.78%(+0.062)#278 |
| 77. | Altamonte Springs | 0.80% | 0.37%(+0.435)#75 | 0.78%(+0.025)#279 |
| 78. | June Park | 0.80% | 0.37%(+0.430)#76 | 0.78%(+0.020)#280 |
| 79. | Ojus | 0.79% | 0.37%(+0.421)#77 | 0.78%(+0.011)#281 |
| 80. | Lynn Haven | 0.77% | 0.37%(+0.403)#78 | 0.78%(-0.007)#282 |
| 81. | Palm Beach Gardens | 0.76% | 0.37%(+0.396)#79 | 0.78%(-0.014)#283 |
| 82. | Southwest Ranches | 0.76% | 0.37%(+0.395)#80 | 0.78%(-0.015)#284 |
| 83. | Cypress Quarters | 0.75% | 0.37%(+0.385)#81 | 0.78%(-0.026)#285 |
| 84. | Clearwater | 0.75% | 0.37%(+0.383)#82 | 0.78%(-0.028)#286 |
| 85. | Nocatee | 0.75% | 0.37%(+0.381)#83 | 0.78%(-0.030)#287 |
| 86. | Oakland | 0.75% | 0.37%(+0.377)#84 | 0.78%(-0.034)#288 |
| 87. | Doctor Phillips | 0.74% | 0.37%(+0.372)#85 | 0.78%(-0.038)#289 |
| 88. | Lutz | 0.74% | 0.37%(+0.371)#86 | 0.78%(-0.039)#290 |
| 89. | Palm Springs | 0.74% | 0.37%(+0.369)#87 | 0.78%(-0.041)#291 |
| 90. | Golden Glades | 0.73% | 0.37%(+0.360)#88 | 0.78%(-0.051)#292 |
| 91. | Berkshire Lakes | 0.73% | 0.37%(+0.358)#89 | 0.78%(-0.052)#293 |
| 92. | Ives Estates | 0.72% | 0.37%(+0.355)#90 | 0.78%(-0.056)#294 |
| 93. | Meadow Woods | 0.72% | 0.37%(+0.351)#91 | 0.78%(-0.059)#295 |
| 94. | Sanford | 0.71% | 0.37%(+0.346)#92 | 0.78%(-0.064)#522 |
| 95. | Hawthorne | 0.71% | 0.37%(+0.344)#93 | 0.78%(-0.066)#523 |
| 96. | North Palm Beach | 0.71% | 0.37%(+0.341)#94 | 0.78%(-0.069)#524 |
| 97. | Webster | 0.71% | 0.37%(+0.341)#95 | 0.78%(-0.069)#525 |
| 98. | Tallahassee | 0.70% | 0.37%(+0.335)#96 | 0.78%(-0.076)#526 |
| 99. | Lely Resort | 0.69% | 0.37%(+0.324)#97 | 0.78%(-0.086)#527 |
| 100. | Country Walk | 0.68% | 0.37%(+0.315)#98 | 0.78%(-0.095)#528 |
Common Questions
What are the Top 10 Cities with the Highest Percentage of Immigrants from Africa in Florida?
Top 10 Cities with the Highest Percentage of Immigrants from Africa in Florida are:
#1
13.30%
#2
8.65%
#3
5.96%
#4
5.38%
#5
5.29%
#6
4.47%
#7
4.32%
#8
3.08%
#9
2.73%
#10
2.59%
What city has the Highest Percentage of Immigrants from Africa in Florida?
Garcon Point has the Highest Percentage of Immigrants from Africa in Florida with 13.30%.
What is the Percentage of Immigrants from Africa in the State of Florida?
Percentage of Immigrants from Africa in Florida is 0.37%.
What is the Percentage of Immigrants from Africa in the United States?
Percentage of Immigrants from Africa in the United States is 0.78%.