Cities with the Highest Percentage of Immigrants from Africa in South Carolina
RELATED REPORTS & OPTIONS
Africa
South Carolina
Compare Cities
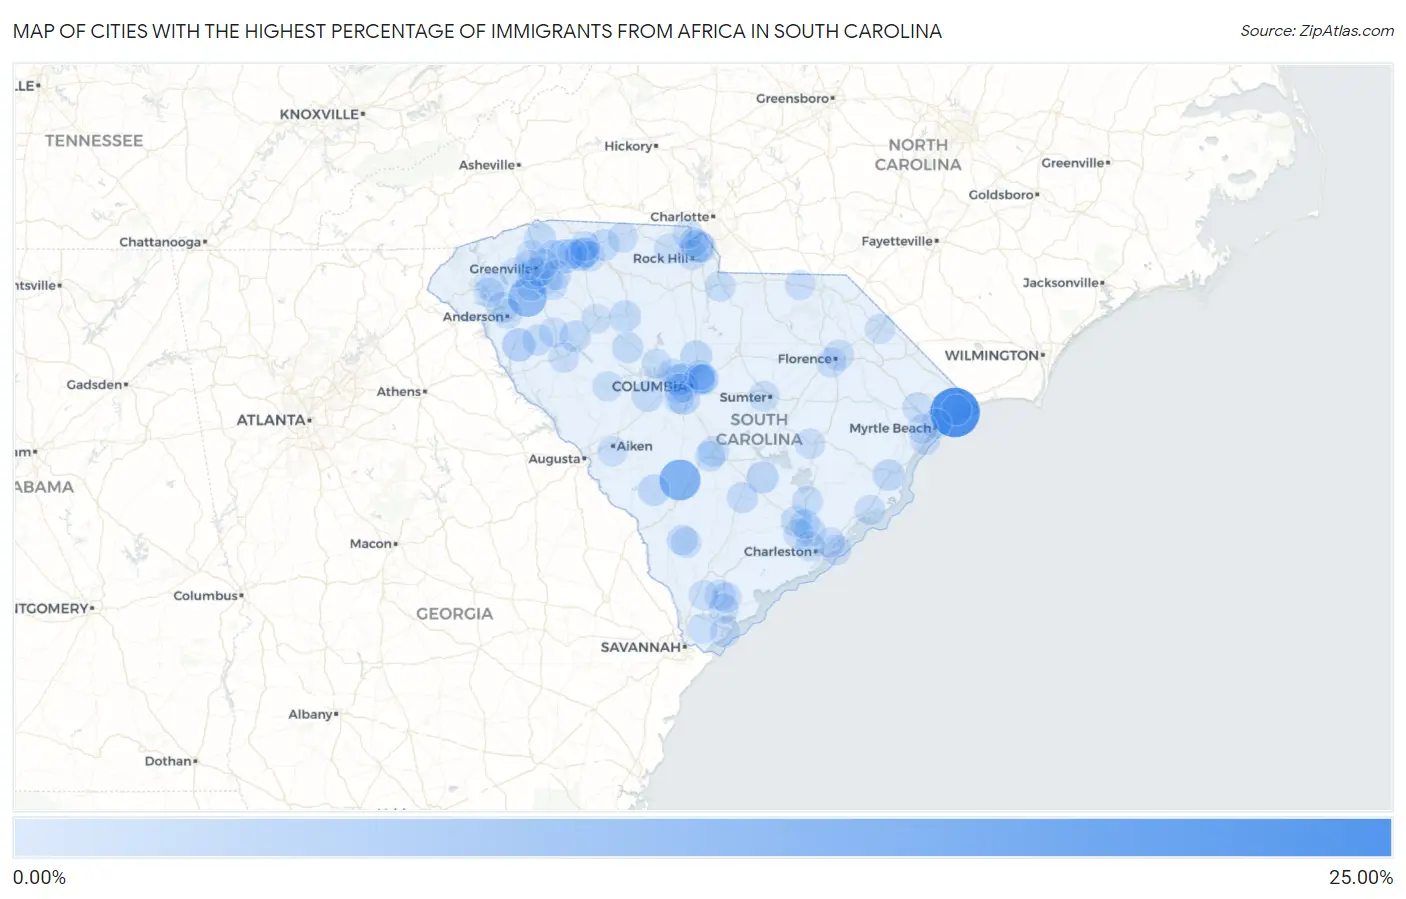
Map of Cities with the Highest Percentage of Immigrants from Africa in South Carolina
0.00%
25.00%
Cities with the Highest Percentage of Immigrants from Africa in South Carolina
| City | Africa | vs State | vs National | |
| 1. | Atlantic Beach | 20.48% | 0.21%(+20.3)#-1 | 0.78%(+19.7)#0 |
| 2. | Denmark | 11.15% | 0.21%(+10.9)#0 | 0.78%(+10.4)#1 |
| 3. | West Pelzer | 8.83% | 0.21%(+8.62)#1 | 0.78%(+8.05)#2 |
| 4. | Duncan | 4.10% | 0.21%(+3.88)#2 | 0.78%(+3.32)#3 |
| 5. | Antreville | 3.15% | 0.21%(+2.93)#3 | 0.78%(+2.37)#4 |
| 6. | Drayton | 3.07% | 0.21%(+2.85)#4 | 0.78%(+2.29)#5 |
| 7. | Riverview | 2.64% | 0.21%(+2.42)#5 | 0.78%(+1.86)#6 |
| 8. | Pine Ridge | 2.23% | 0.21%(+2.02)#6 | 0.78%(+1.45)#7 |
| 9. | Holly Hill | 1.88% | 0.21%(+1.66)#7 | 0.78%(+1.10)#8 |
| 10. | Blythewood | 1.84% | 0.21%(+1.63)#8 | 0.78%(+1.06)#9 |
| 11. | Arcadia | 1.76% | 0.21%(+1.54)#9 | 0.78%(+0.978)#10 |
| 12. | Fairforest | 1.72% | 0.21%(+1.51)#10 | 0.78%(+0.943)#11 |
| 13. | Barnwell | 1.66% | 0.21%(+1.44)#11 | 0.78%(+0.879)#12 |
| 14. | Georgetown | 1.65% | 0.21%(+1.44)#12 | 0.78%(+0.875)#13 |
| 15. | St Andrews | 1.58% | 0.21%(+1.37)#13 | 0.78%(+0.805)#14 |
| 16. | Whitmire | 1.51% | 0.21%(+1.30)#14 | 0.78%(+0.735)#15 |
| 17. | Tigerville | 1.51% | 0.21%(+1.29)#15 | 0.78%(+0.729)#16 |
| 18. | Cowpens | 1.50% | 0.21%(+1.29)#16 | 0.78%(+0.724)#17 |
| 19. | Golden Grove | 1.34% | 0.21%(+1.13)#17 | 0.78%(+0.561)#18 |
| 20. | Central | 1.33% | 0.21%(+1.11)#18 | 0.78%(+0.548)#19 |
| 21. | Summit | 1.30% | 0.21%(+1.08)#19 | 0.78%(+0.519)#20 |
| 22. | Waterloo | 1.23% | 0.21%(+1.02)#20 | 0.78%(+0.450)#21 |
| 23. | Newberry | 1.16% | 0.21%(+0.947)#21 | 0.78%(+0.382)#22 |
| 24. | St George | 1.16% | 0.21%(+0.943)#22 | 0.78%(+0.378)#23 |
| 25. | Hanahan | 1.15% | 0.21%(+0.934)#23 | 0.78%(+0.369)#24 |
| 26. | Seven Oaks | 1.11% | 0.21%(+0.898)#24 | 0.78%(+0.333)#25 |
| 27. | Northlake | 1.05% | 0.21%(+0.839)#25 | 0.78%(+0.274)#26 |
| 28. | Mauldin | 1.04% | 0.21%(+0.827)#26 | 0.78%(+0.262)#27 |
| 29. | Forest Acres | 1.03% | 0.21%(+0.813)#27 | 0.78%(+0.248)#28 |
| 30. | Due West | 0.96% | 0.21%(+0.744)#28 | 0.78%(+0.179)#29 |
| 31. | Brookdale | 0.91% | 0.21%(+0.695)#29 | 0.78%(+0.130)#30 |
| 32. | Ladson | 0.91% | 0.21%(+0.694)#30 | 0.78%(+0.129)#31 |
| 33. | Dunean | 0.88% | 0.21%(+0.661)#31 | 0.78%(+0.096)#32 |
| 34. | Laurel Bay | 0.83% | 0.21%(+0.620)#32 | 0.78%(+0.055)#33 |
| 35. | Quinby | 0.78% | 0.21%(+0.566)#33 | 0.78%(+0.001)#34 |
| 36. | Moncks Corner | 0.75% | 0.21%(+0.536)#34 | 0.78%(-0.029)#35 |
| 37. | Lancaster | 0.68% | 0.21%(+0.461)#35 | 0.78%(-0.104)#36 |
| 38. | Sumter | 0.61% | 0.21%(+0.394)#36 | 0.78%(-0.171)#37 |
| 39. | Varnville | 0.55% | 0.21%(+0.338)#37 | 0.78%(-0.227)#38 |
| 40. | Hampton | 0.55% | 0.21%(+0.336)#38 | 0.78%(-0.229)#39 |
| 41. | Orangeburg | 0.54% | 0.21%(+0.323)#39 | 0.78%(-0.242)#40 |
| 42. | Carolina Forest | 0.53% | 0.21%(+0.313)#40 | 0.78%(-0.252)#41 |
| 43. | Greeleyville | 0.48% | 0.21%(+0.264)#41 | 0.78%(-0.301)#42 |
| 44. | Columbia | 0.46% | 0.21%(+0.249)#42 | 0.78%(-0.316)#362 |
| 45. | Rock Hill | 0.44% | 0.21%(+0.225)#43 | 0.78%(-0.340)#363 |
| 46. | Spartanburg | 0.44% | 0.21%(+0.224)#44 | 0.78%(-0.341)#364 |
| 47. | Conway | 0.43% | 0.21%(+0.212)#45 | 0.78%(-0.353)#365 |
| 48. | Isle Of Palms | 0.41% | 0.21%(+0.200)#46 | 0.78%(-0.365)#366 |
| 49. | North Myrtle Beach | 0.40% | 0.21%(+0.184)#47 | 0.78%(-0.381)#367 |
| 50. | Mcclellanville | 0.39% | 0.21%(+0.175)#48 | 0.78%(-0.390)#368 |
| 51. | Gaffney | 0.39% | 0.21%(+0.173)#49 | 0.78%(-0.392)#369 |
| 52. | Simpsonville | 0.37% | 0.21%(+0.155)#50 | 0.78%(-0.410)#370 |
| 53. | North Charleston | 0.36% | 0.21%(+0.149)#51 | 0.78%(-0.416)#371 |
| 54. | Aiken | 0.35% | 0.21%(+0.139)#52 | 0.78%(-0.426)#372 |
| 55. | Arcadia Lakes | 0.34% | 0.21%(+0.130)#53 | 0.78%(-0.435)#373 |
| 56. | Mount Pleasant | 0.32% | 0.21%(+0.108)#54 | 0.78%(-0.457)#374 |
| 57. | Greer | 0.31% | 0.21%(+0.096)#55 | 0.78%(-0.469)#375 |
| 58. | West Columbia | 0.31% | 0.21%(+0.095)#56 | 0.78%(-0.470)#376 |
| 59. | Greenwood | 0.29% | 0.21%(+0.079)#57 | 0.78%(-0.486)#377 |
| 60. | Charleston | 0.29% | 0.21%(+0.074)#58 | 0.78%(-0.491)#378 |
| 61. | Hilton Head Island | 0.28% | 0.21%(+0.062)#59 | 0.78%(-0.503)#379 |
| 62. | Saxon | 0.26% | 0.21%(+0.049)#60 | 0.78%(-0.516)#380 |
| 63. | Anderson | 0.26% | 0.21%(+0.048)#61 | 0.78%(-0.517)#381 |
| 64. | Dentsville | 0.26% | 0.21%(+0.042)#62 | 0.78%(-0.523)#382 |
| 65. | Fort Mill | 0.25% | 0.21%(+0.039)#63 | 0.78%(-0.526)#383 |
| 66. | Beaufort | 0.25% | 0.21%(+0.036)#64 | 0.78%(-0.529)#384 |
| 67. | York | 0.25% | 0.21%(+0.032)#65 | 0.78%(-0.533)#385 |
| 68. | Chesterfield | 0.21% | 0.21%(-0.004)#66 | 0.78%(-0.569)#386 |
| 69. | Ware Shoals | 0.21% | 0.21%(-0.007)#67 | 0.78%(-0.572)#387 |
| 70. | Florence | 0.21% | 0.21%(-0.009)#68 | 0.78%(-0.574)#388 |
| 71. | Five Forks | 0.20% | 0.21%(-0.010)#69 | 0.78%(-0.575)#389 |
| 72. | Irmo | 0.20% | 0.21%(-0.017)#70 | 0.78%(-0.582)#390 |
| 73. | Chapin | 0.19% | 0.21%(-0.020)#71 | 0.78%(-0.585)#391 |
| 74. | Saluda | 0.19% | 0.21%(-0.022)#72 | 0.78%(-0.587)#392 |
| 75. | Surfside Beach | 0.19% | 0.21%(-0.023)#73 | 0.78%(-0.588)#393 |
| 76. | Greenville | 0.19% | 0.21%(-0.026)#74 | 0.78%(-0.592)#394 |
| 77. | Valley Falls | 0.18% | 0.21%(-0.031)#75 | 0.78%(-0.596)#395 |
| 78. | Myrtle Beach | 0.18% | 0.21%(-0.034)#76 | 0.78%(-0.599)#396 |
| 79. | Litchfield Beach | 0.18% | 0.21%(-0.035)#77 | 0.78%(-0.600)#397 |
| 80. | Port Royal | 0.18% | 0.21%(-0.036)#78 | 0.78%(-0.601)#398 |
| 81. | Lake Wylie | 0.17% | 0.21%(-0.040)#79 | 0.78%(-0.605)#399 |
| 82. | Ridgeland | 0.16% | 0.21%(-0.054)#80 | 0.78%(-0.619)#400 |
| 83. | Oak Grove | 0.14% | 0.21%(-0.074)#81 | 0.78%(-0.639)#401 |
| 84. | Bluffton | 0.14% | 0.21%(-0.075)#82 | 0.78%(-0.640)#402 |
| 85. | South Congaree | 0.13% | 0.21%(-0.081)#83 | 0.78%(-0.646)#403 |
| 86. | Goose Creek | 0.13% | 0.21%(-0.083)#84 | 0.78%(-0.648)#404 |
| 87. | Easley | 0.13% | 0.21%(-0.085)#85 | 0.78%(-0.650)#405 |
| 88. | Dillon | 0.12% | 0.21%(-0.090)#86 | 0.78%(-0.655)#406 |
| 89. | Wellford | 0.12% | 0.21%(-0.094)#87 | 0.78%(-0.659)#407 |
| 90. | Clemson | 0.11% | 0.21%(-0.106)#88 | 0.78%(-0.671)#408 |
| 91. | Wade Hampton | 0.076% | 0.21%(-0.138)#89 | 0.78%(-0.703)#409 |
| 92. | Tega Cay | 0.070% | 0.21%(-0.144)#90 | 0.78%(-0.709)#410 |
| 93. | Clinton | 0.066% | 0.21%(-0.149)#91 | 0.78%(-0.714)#411 |
| 94. | Travelers Rest | 0.063% | 0.21%(-0.151)#92 | 0.78%(-0.716)#412 |
| 95. | Berea | 0.056% | 0.21%(-0.159)#93 | 0.78%(-0.724)#413 |
| 96. | Socastee | 0.053% | 0.21%(-0.161)#94 | 0.78%(-0.726)#414 |
| 97. | Woodfield | 0.011% | 0.21%(-0.204)#95 | 0.78%(-0.769)#415 |
Common Questions
What are the Top 10 Cities with the Highest Percentage of Immigrants from Africa in South Carolina?
Top 10 Cities with the Highest Percentage of Immigrants from Africa in South Carolina are:
#1
20.48%
#2
11.15%
#3
8.83%
#4
4.10%
#5
3.15%
#6
2.64%
#7
2.23%
#8
1.88%
#9
1.84%
#10
1.76%
What city has the Highest Percentage of Immigrants from Africa in South Carolina?
Atlantic Beach has the Highest Percentage of Immigrants from Africa in South Carolina with 20.48%.
What is the Percentage of Immigrants from Africa in the State of South Carolina?
Percentage of Immigrants from Africa in South Carolina is 0.21%.
What is the Percentage of Immigrants from Africa in the United States?
Percentage of Immigrants from Africa in the United States is 0.78%.