Cities with the Highest Percentage of Immigrants from Africa in Missouri
RELATED REPORTS & OPTIONS
Africa
Missouri
Compare Cities
Map of Cities with the Highest Percentage of Immigrants from Africa in Missouri
0.00%
15.00%
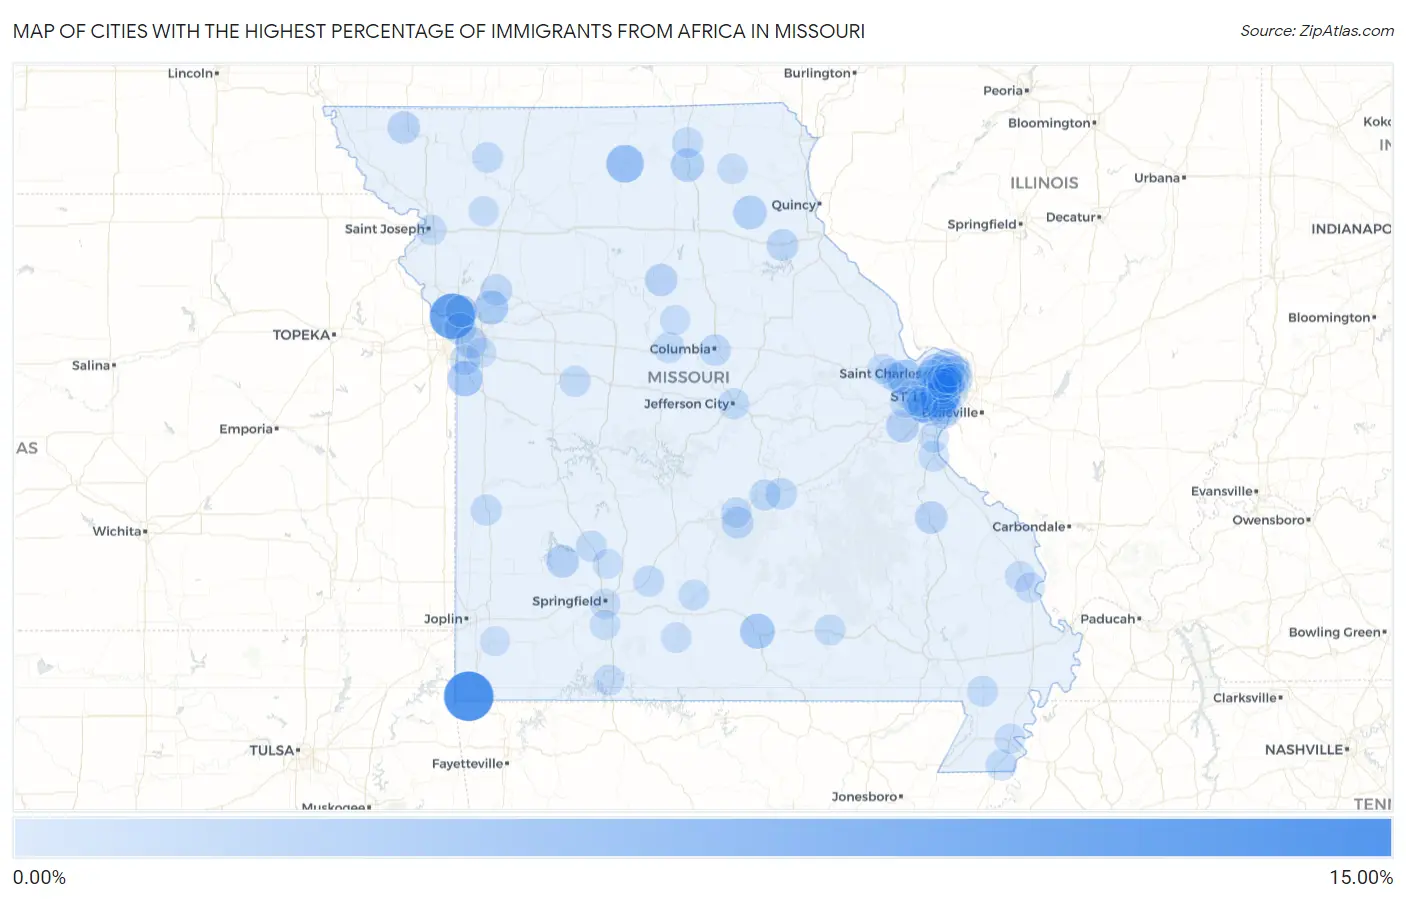
Cities with the Highest Percentage of Immigrants from Africa in Missouri
| City | Africa | vs State | vs National | |
| 1. | Noel | 12.75% | 0.44%(+12.3)#-1 | 0.78%(+12.0)#0 |
| 2. | Riverside | 10.06% | 0.44%(+9.62)#0 | 0.78%(+9.28)#1 |
| 3. | Rock Hill | 4.95% | 0.44%(+4.51)#1 | 0.78%(+4.17)#2 |
| 4. | Milan | 4.83% | 0.44%(+4.39)#2 | 0.78%(+4.05)#3 |
| 5. | Cottleville | 3.72% | 0.44%(+3.28)#3 | 0.78%(+2.95)#4 |
| 6. | Richmond Heights | 3.57% | 0.44%(+3.13)#4 | 0.78%(+2.79)#5 |
| 7. | Riverview Estates | 3.37% | 0.44%(+2.93)#5 | 0.78%(+2.59)#6 |
| 8. | Deering | 3.28% | 0.44%(+2.84)#6 | 0.78%(+2.50)#7 |
| 9. | Willow Springs | 3.20% | 0.44%(+2.76)#7 | 0.78%(+2.42)#8 |
| 10. | Hazelwood | 3.14% | 0.44%(+2.70)#8 | 0.78%(+2.36)#9 |
| 11. | Missouri City | 2.68% | 0.44%(+2.24)#9 | 0.78%(+1.90)#10 |
| 12. | Twin Oaks | 2.58% | 0.44%(+2.14)#10 | 0.78%(+1.81)#18 |
| 13. | Overland | 2.51% | 0.44%(+2.07)#11 | 0.78%(+1.73)#19 |
| 14. | Bethel | 2.36% | 0.44%(+1.92)#12 | 0.78%(+1.58)#20 |
| 15. | Pasadena Hills | 2.36% | 0.44%(+1.92)#13 | 0.78%(+1.58)#21 |
| 16. | Olivette | 2.34% | 0.44%(+1.90)#14 | 0.78%(+1.56)#22 |
| 17. | Kirksville | 2.30% | 0.44%(+1.86)#15 | 0.78%(+1.52)#23 |
| 18. | Edmundson | 2.04% | 0.44%(+1.60)#16 | 0.78%(+1.26)#24 |
| 19. | Dadeville | 1.93% | 0.44%(+1.49)#17 | 0.78%(+1.15)#25 |
| 20. | Labarque Creek | 1.83% | 0.44%(+1.39)#18 | 0.78%(+1.05)#26 |
| 21. | Burlington Junction | 1.77% | 0.44%(+1.33)#19 | 0.78%(+0.989)#27 |
| 22. | Old Jamestown | 1.76% | 0.44%(+1.32)#20 | 0.78%(+0.982)#28 |
| 23. | Norwood Court | 1.69% | 0.44%(+1.25)#21 | 0.78%(+0.907)#29 |
| 24. | Farmington | 1.69% | 0.44%(+1.25)#22 | 0.78%(+0.906)#30 |
| 25. | Salisbury | 1.68% | 0.44%(+1.24)#23 | 0.78%(+0.899)#31 |
| 26. | Riverview | 1.51% | 0.44%(+1.07)#24 | 0.78%(+0.732)#32 |
| 27. | Kansas City | 1.41% | 0.44%(+0.971)#25 | 0.78%(+0.632)#33 |
| 28. | Gladstone | 1.36% | 0.44%(+0.925)#26 | 0.78%(+0.586)#34 |
| 29. | Florissant | 1.35% | 0.44%(+0.913)#27 | 0.78%(+0.574)#35 |
| 30. | Raytown | 1.33% | 0.44%(+0.890)#28 | 0.78%(+0.551)#486 |
| 31. | Fort Leonard Wood | 1.30% | 0.44%(+0.860)#29 | 0.78%(+0.521)#487 |
| 32. | Maryland Heights | 1.27% | 0.44%(+0.830)#30 | 0.78%(+0.491)#488 |
| 33. | St Ann | 1.26% | 0.44%(+0.822)#31 | 0.78%(+0.483)#489 |
| 34. | Pasadena Park | 1.23% | 0.44%(+0.791)#32 | 0.78%(+0.452)#490 |
| 35. | Monroe City | 1.23% | 0.44%(+0.788)#33 | 0.78%(+0.449)#491 |
| 36. | St John | 1.17% | 0.44%(+0.729)#34 | 0.78%(+0.390)#492 |
| 37. | Rolla | 1.10% | 0.44%(+0.663)#35 | 0.78%(+0.324)#493 |
| 38. | Clarkson Valley | 1.07% | 0.44%(+0.633)#36 | 0.78%(+0.294)#494 |
| 39. | Excelsior Springs | 1.07% | 0.44%(+0.631)#37 | 0.78%(+0.292)#495 |
| 40. | Fenton | 1.05% | 0.44%(+0.609)#38 | 0.78%(+0.270)#496 |
| 41. | Columbia | 1.05% | 0.44%(+0.608)#39 | 0.78%(+0.269)#497 |
| 42. | Kinloch | 1.03% | 0.44%(+0.591)#40 | 0.78%(+0.252)#498 |
| 43. | Spanish Lake | 1.03% | 0.44%(+0.590)#41 | 0.78%(+0.251)#499 |
| 44. | Woodson Terrace | 0.99% | 0.44%(+0.549)#42 | 0.78%(+0.210)#500 |
| 45. | Normandy | 0.98% | 0.44%(+0.536)#43 | 0.78%(+0.197)#501 |
| 46. | St Louis | 0.96% | 0.44%(+0.519)#44 | 0.78%(+0.180)#553 |
| 47. | Maplewood | 0.94% | 0.44%(+0.498)#45 | 0.78%(+0.159)#554 |
| 48. | Huntleigh | 0.93% | 0.44%(+0.490)#46 | 0.78%(+0.151)#555 |
| 49. | Berkeley | 0.92% | 0.44%(+0.483)#47 | 0.78%(+0.144)#556 |
| 50. | Marshfield | 0.88% | 0.44%(+0.440)#48 | 0.78%(+0.101)#557 |
| 51. | Cooter | 0.87% | 0.44%(+0.434)#49 | 0.78%(+0.095)#558 |
| 52. | Valley Park | 0.86% | 0.44%(+0.421)#50 | 0.78%(+0.082)#559 |
| 53. | Bolivar | 0.84% | 0.44%(+0.404)#51 | 0.78%(+0.065)#560 |
| 54. | Whiteman Afb | 0.83% | 0.44%(+0.385)#52 | 0.78%(+0.046)#561 |
| 55. | Dellwood | 0.82% | 0.44%(+0.376)#53 | 0.78%(+0.037)#562 |
| 56. | Nevada | 0.81% | 0.44%(+0.372)#54 | 0.78%(+0.033)#563 |
| 57. | Jefferson City | 0.78% | 0.44%(+0.338)#55 | 0.78%(-0.001)#564 |
| 58. | Boonville | 0.78% | 0.44%(+0.336)#56 | 0.78%(-0.003)#565 |
| 59. | Clayton | 0.77% | 0.44%(+0.332)#57 | 0.78%(-0.007)#566 |
| 60. | Albany | 0.75% | 0.44%(+0.313)#58 | 0.78%(-0.026)#567 |
| 61. | Doolittle | 0.75% | 0.44%(+0.307)#59 | 0.78%(-0.032)#568 |
| 62. | Winona | 0.74% | 0.44%(+0.300)#60 | 0.78%(-0.039)#569 |
| 63. | Greentop | 0.73% | 0.44%(+0.292)#61 | 0.78%(-0.047)#570 |
| 64. | Malden | 0.71% | 0.44%(+0.272)#62 | 0.78%(-0.067)#571 |
| 65. | Bridgeton | 0.71% | 0.44%(+0.269)#63 | 0.78%(-0.070)#572 |
| 66. | University City | 0.67% | 0.44%(+0.234)#64 | 0.78%(-0.105)#573 |
| 67. | Wildwood | 0.65% | 0.44%(+0.212)#65 | 0.78%(-0.127)#574 |
| 68. | Bellefontaine Neighbors | 0.65% | 0.44%(+0.208)#66 | 0.78%(-0.131)#575 |
| 69. | Festus | 0.64% | 0.44%(+0.202)#67 | 0.78%(-0.137)#576 |
| 70. | Jennings | 0.64% | 0.44%(+0.198)#68 | 0.78%(-0.141)#577 |
| 71. | Lakeshire | 0.63% | 0.44%(+0.193)#69 | 0.78%(-0.146)#578 |
| 72. | Grandview | 0.62% | 0.44%(+0.181)#70 | 0.78%(-0.158)#579 |
| 73. | Hartville | 0.61% | 0.44%(+0.173)#71 | 0.78%(-0.166)#580 |
| 74. | Branson | 0.58% | 0.44%(+0.145)#72 | 0.78%(-0.194)#581 |
| 75. | Lemay | 0.57% | 0.44%(+0.133)#73 | 0.78%(-0.206)#582 |
| 76. | St Robert | 0.57% | 0.44%(+0.132)#74 | 0.78%(-0.207)#583 |
| 77. | Manchester | 0.53% | 0.44%(+0.092)#75 | 0.78%(-0.247)#584 |
| 78. | St Joseph | 0.52% | 0.44%(+0.085)#76 | 0.78%(-0.254)#585 |
| 79. | Ava | 0.51% | 0.44%(+0.071)#77 | 0.78%(-0.268)#586 |
| 80. | Hanley Hills | 0.50% | 0.44%(+0.056)#78 | 0.78%(-0.283)#587 |
| 81. | Lake St Louis | 0.47% | 0.44%(+0.028)#79 | 0.78%(-0.311)#588 |
| 82. | Lee S Summit | 0.45% | 0.44%(+0.011)#80 | 0.78%(-0.328)#589 |
| 83. | Springfield | 0.44% | 0.44%(+0.002)#81 | 0.78%(-0.338)#590 |
| 84. | Edina | 0.44% | 0.44%(-0.005)#82 | 0.78%(-0.344)#591 |
| 85. | Bel Ridge | 0.41% | 0.44%(-0.031)#83 | 0.78%(-0.370)#592 |
| 86. | Maysville | 0.40% | 0.44%(-0.043)#84 | 0.78%(-0.382)#593 |
| 87. | Nixa | 0.40% | 0.44%(-0.045)#85 | 0.78%(-0.384)#594 |
| 88. | Jackson | 0.39% | 0.44%(-0.050)#86 | 0.78%(-0.390)#595 |
| 89. | Barnhart | 0.36% | 0.44%(-0.076)#87 | 0.78%(-0.415)#596 |
| 90. | Hayti | 0.34% | 0.44%(-0.102)#88 | 0.78%(-0.441)#597 |
| 91. | Fayette | 0.32% | 0.44%(-0.118)#89 | 0.78%(-0.457)#598 |
| 92. | Ballwin | 0.31% | 0.44%(-0.133)#90 | 0.78%(-0.472)#599 |
| 93. | Black Jack | 0.30% | 0.44%(-0.139)#91 | 0.78%(-0.478)#600 |
| 94. | Mehlville | 0.29% | 0.44%(-0.155)#92 | 0.78%(-0.494)#601 |
| 95. | Pleasant Hope | 0.28% | 0.44%(-0.165)#93 | 0.78%(-0.504)#602 |
| 96. | Ferguson | 0.27% | 0.44%(-0.165)#94 | 0.78%(-0.504)#603 |
| 97. | Dardenne Prairie | 0.27% | 0.44%(-0.169)#95 | 0.78%(-0.508)#604 |
| 98. | Granby | 0.26% | 0.44%(-0.176)#96 | 0.78%(-0.515)#605 |
| 99. | Wentzville | 0.26% | 0.44%(-0.182)#97 | 0.78%(-0.521)#606 |
| 100. | Cape Girardeau | 0.25% | 0.44%(-0.186)#98 | 0.78%(-0.525)#607 |
Common Questions
What are the Top 10 Cities with the Highest Percentage of Immigrants from Africa in Missouri?
Top 10 Cities with the Highest Percentage of Immigrants from Africa in Missouri are:
#1
12.75%
#2
10.06%
#3
4.95%
#4
4.83%
#5
3.72%
#6
3.57%
#7
3.37%
#8
3.20%
#9
3.14%
#10
2.68%
What city has the Highest Percentage of Immigrants from Africa in Missouri?
Noel has the Highest Percentage of Immigrants from Africa in Missouri with 12.75%.
What is the Percentage of Immigrants from Africa in the State of Missouri?
Percentage of Immigrants from Africa in Missouri is 0.44%.
What is the Percentage of Immigrants from Africa in the United States?
Percentage of Immigrants from Africa in the United States is 0.78%.