Cities with the Highest Percentage of Immigrants from Africa in Indiana
RELATED REPORTS & OPTIONS
Africa
Indiana
Compare Cities
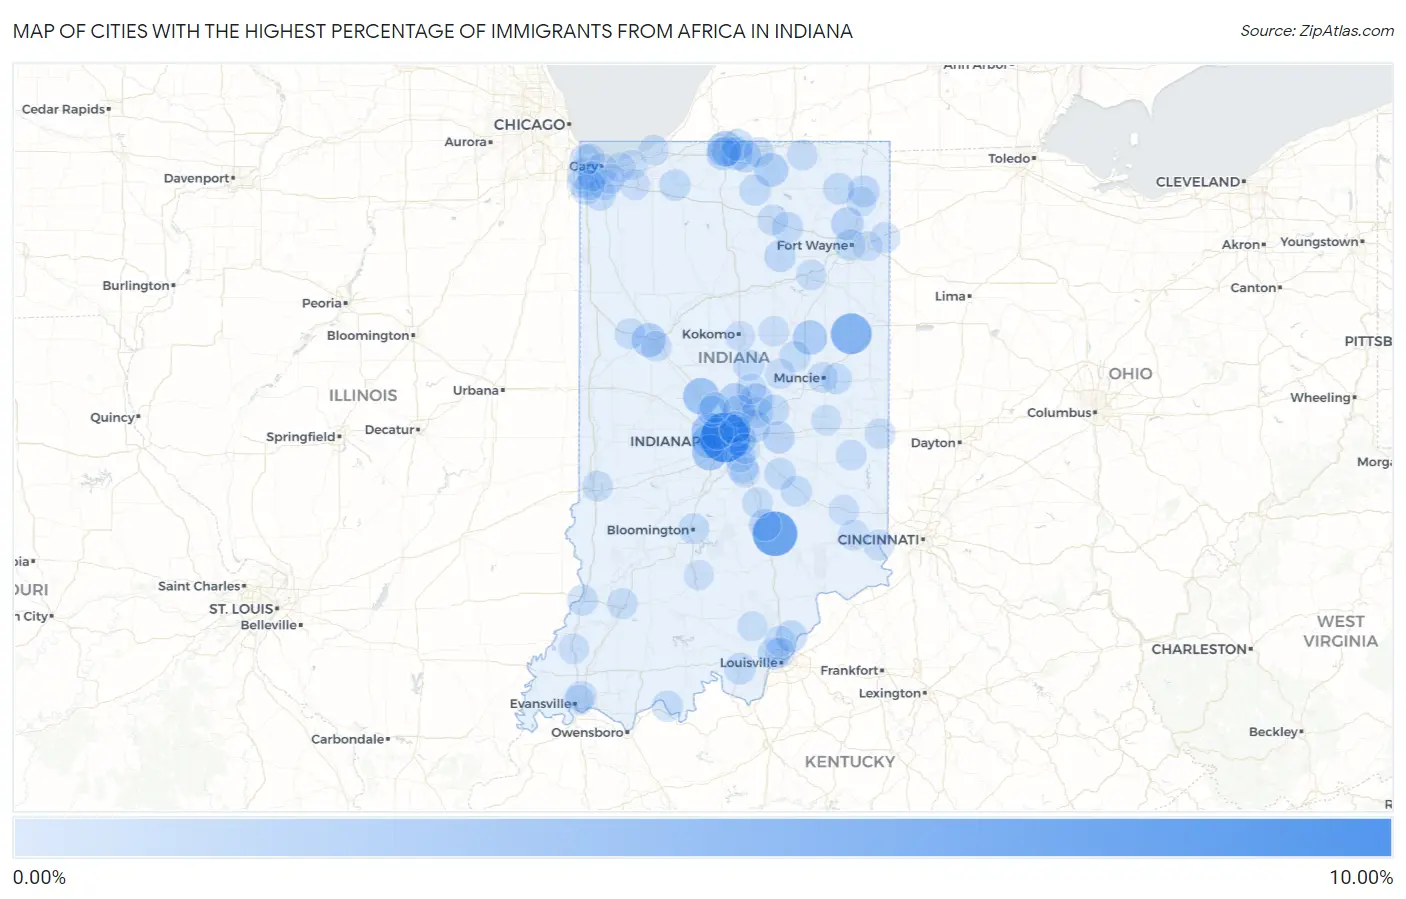
Map of Cities with the Highest Percentage of Immigrants from Africa in Indiana
0.00%
10.00%
Cities with the Highest Percentage of Immigrants from Africa in Indiana
| City | Africa | vs State | vs National | |
| 1. | Speedway | 9.58% | 0.59%(+8.99)#-1 | 0.78%(+8.80)#0 |
| 2. | Elizabethtown | 7.10% | 0.59%(+6.51)#0 | 0.78%(+6.32)#1 |
| 3. | Pennville | 5.12% | 0.59%(+4.54)#1 | 0.78%(+4.35)#2 |
| 4. | Chain-O-Lakes | 3.93% | 0.59%(+3.34)#2 | 0.78%(+3.15)#3 |
| 5. | Bethel | 3.75% | 0.59%(+3.16)#3 | 0.78%(+2.97)#4 |
| 6. | Brownsburg | 3.16% | 0.59%(+2.57)#4 | 0.78%(+2.38)#5 |
| 7. | Ulen | 2.99% | 0.59%(+2.40)#5 | 0.78%(+2.21)#6 |
| 8. | Plainfield | 2.67% | 0.59%(+2.08)#6 | 0.78%(+1.89)#7 |
| 9. | Roseland | 2.52% | 0.59%(+1.93)#7 | 0.78%(+1.74)#8 |
| 10. | Avon | 2.08% | 0.59%(+1.49)#8 | 0.78%(+1.30)#9 |
| 11. | Upland | 2.04% | 0.59%(+1.46)#9 | 0.78%(+1.26)#10 |
| 12. | Indianapolis | 2.02% | 0.59%(+1.43)#10 | 0.78%(+1.24)#371 |
| 13. | West Lafayette | 1.91% | 0.59%(+1.32)#11 | 0.78%(+1.13)#479 |
| 14. | Goshen | 1.73% | 0.59%(+1.15)#12 | 0.78%(+0.955)#480 |
| 15. | Westfield | 1.67% | 0.59%(+1.08)#13 | 0.78%(+0.889)#481 |
| 16. | Noblesville | 1.50% | 0.59%(+0.917)#14 | 0.78%(+0.726)#482 |
| 17. | Lawrence | 1.31% | 0.59%(+0.719)#15 | 0.78%(+0.527)#483 |
| 18. | Carmel | 1.22% | 0.59%(+0.633)#16 | 0.78%(+0.441)#484 |
| 19. | Huntertown | 1.20% | 0.59%(+0.612)#17 | 0.78%(+0.420)#485 |
| 20. | Mishawaka | 1.16% | 0.59%(+0.572)#18 | 0.78%(+0.380)#486 |
| 21. | South Bend | 1.13% | 0.59%(+0.543)#19 | 0.78%(+0.351)#487 |
| 22. | Osceola | 1.12% | 0.59%(+0.533)#20 | 0.78%(+0.341)#488 |
| 23. | Crows Nest | 1.08% | 0.59%(+0.488)#21 | 0.78%(+0.296)#489 |
| 24. | Clermont | 0.99% | 0.59%(+0.398)#22 | 0.78%(+0.206)#490 |
| 25. | Columbus | 0.97% | 0.59%(+0.379)#23 | 0.78%(+0.187)#491 |
| 26. | Greenfield | 0.95% | 0.59%(+0.359)#24 | 0.78%(+0.167)#492 |
| 27. | Granger | 0.86% | 0.59%(+0.269)#25 | 0.78%(+0.077)#493 |
| 28. | Waterloo | 0.84% | 0.59%(+0.255)#26 | 0.78%(+0.063)#494 |
| 29. | New Albany | 0.79% | 0.59%(+0.203)#27 | 0.78%(+0.011)#495 |
| 30. | Charlestown | 0.78% | 0.59%(+0.189)#28 | 0.78%(-0.003)#496 |
| 31. | Greenwood | 0.75% | 0.59%(+0.161)#29 | 0.78%(-0.031)#497 |
| 32. | North Manchester | 0.74% | 0.59%(+0.150)#30 | 0.78%(-0.042)#498 |
| 33. | Kendallville | 0.72% | 0.59%(+0.130)#31 | 0.78%(-0.062)#499 |
| 34. | Shelbyville | 0.72% | 0.59%(+0.129)#32 | 0.78%(-0.063)#500 |
| 35. | Pierceton | 0.67% | 0.59%(+0.082)#33 | 0.78%(-0.110)#501 |
| 36. | Corydon | 0.67% | 0.59%(+0.079)#34 | 0.78%(-0.113)#502 |
| 37. | Kingsford Heights | 0.65% | 0.59%(+0.060)#35 | 0.78%(-0.132)#503 |
| 38. | Fort Wayne | 0.63% | 0.59%(+0.047)#36 | 0.78%(-0.145)#504 |
| 39. | Nappanee | 0.63% | 0.59%(+0.045)#37 | 0.78%(-0.147)#505 |
| 40. | Crown Point | 0.62% | 0.59%(+0.032)#38 | 0.78%(-0.160)#506 |
| 41. | Tipton | 0.59% | 0.59%(+0.003)#39 | 0.78%(-0.189)#507 |
| 42. | Fishers | 0.56% | 0.59%(-0.031)#40 | 0.78%(-0.223)#508 |
| 43. | Summitville | 0.54% | 0.59%(-0.050)#41 | 0.78%(-0.242)#509 |
| 44. | St Paul | 0.54% | 0.59%(-0.052)#42 | 0.78%(-0.244)#510 |
| 45. | Tell City | 0.48% | 0.59%(-0.105)#43 | 0.78%(-0.297)#511 |
| 46. | Selma | 0.47% | 0.59%(-0.122)#44 | 0.78%(-0.314)#512 |
| 47. | Munster | 0.45% | 0.59%(-0.136)#45 | 0.78%(-0.328)#513 |
| 48. | Vincennes | 0.44% | 0.59%(-0.145)#46 | 0.78%(-0.337)#514 |
| 49. | Hammond | 0.44% | 0.59%(-0.147)#47 | 0.78%(-0.339)#515 |
| 50. | Bloomington | 0.42% | 0.59%(-0.171)#48 | 0.78%(-0.363)#516 |
| 51. | Ingalls | 0.42% | 0.59%(-0.171)#49 | 0.78%(-0.363)#517 |
| 52. | Whitestown | 0.41% | 0.59%(-0.178)#50 | 0.78%(-0.370)#518 |
| 53. | Warsaw | 0.38% | 0.59%(-0.205)#51 | 0.78%(-0.397)#519 |
| 54. | Aurora | 0.36% | 0.59%(-0.224)#52 | 0.78%(-0.416)#520 |
| 55. | Melody Hill | 0.35% | 0.59%(-0.239)#53 | 0.78%(-0.431)#521 |
| 56. | Washington | 0.35% | 0.59%(-0.240)#54 | 0.78%(-0.431)#522 |
| 57. | Shipshewana | 0.34% | 0.59%(-0.244)#55 | 0.78%(-0.436)#523 |
| 58. | Otterbein | 0.33% | 0.59%(-0.253)#56 | 0.78%(-0.445)#524 |
| 59. | Rocky Ripple | 0.33% | 0.59%(-0.262)#57 | 0.78%(-0.454)#525 |
| 60. | Sellersburg | 0.32% | 0.59%(-0.266)#58 | 0.78%(-0.458)#526 |
| 61. | Gary | 0.32% | 0.59%(-0.268)#59 | 0.78%(-0.460)#527 |
| 62. | Edinburgh | 0.31% | 0.59%(-0.274)#60 | 0.78%(-0.466)#528 |
| 63. | Zionsville | 0.29% | 0.59%(-0.295)#61 | 0.78%(-0.487)#529 |
| 64. | Huntington | 0.28% | 0.59%(-0.305)#62 | 0.78%(-0.497)#530 |
| 65. | Terre Haute | 0.28% | 0.59%(-0.306)#63 | 0.78%(-0.498)#531 |
| 66. | Richmond | 0.28% | 0.59%(-0.307)#64 | 0.78%(-0.499)#532 |
| 67. | Connersville | 0.28% | 0.59%(-0.311)#65 | 0.78%(-0.503)#533 |
| 68. | Dyer | 0.27% | 0.59%(-0.319)#66 | 0.78%(-0.511)#534 |
| 69. | Lafayette | 0.26% | 0.59%(-0.323)#67 | 0.78%(-0.515)#535 |
| 70. | Muncie | 0.25% | 0.59%(-0.333)#68 | 0.78%(-0.525)#536 |
| 71. | Milan | 0.25% | 0.59%(-0.335)#69 | 0.78%(-0.527)#537 |
| 72. | Woodburn | 0.24% | 0.59%(-0.343)#70 | 0.78%(-0.535)#538 |
| 73. | Valparaiso | 0.22% | 0.59%(-0.367)#71 | 0.78%(-0.559)#539 |
| 74. | Swayzee | 0.22% | 0.59%(-0.370)#72 | 0.78%(-0.562)#540 |
| 75. | Frankton | 0.22% | 0.59%(-0.371)#73 | 0.78%(-0.563)#541 |
| 76. | Whiteland | 0.21% | 0.59%(-0.377)#74 | 0.78%(-0.569)#542 |
| 77. | Princeton | 0.20% | 0.59%(-0.384)#75 | 0.78%(-0.576)#543 |
| 78. | Batesville | 0.17% | 0.59%(-0.417)#76 | 0.78%(-0.609)#544 |
| 79. | Cicero | 0.17% | 0.59%(-0.419)#77 | 0.78%(-0.611)#545 |
| 80. | East Chicago | 0.16% | 0.59%(-0.424)#78 | 0.78%(-0.616)#546 |
| 81. | Merrillville | 0.16% | 0.59%(-0.427)#79 | 0.78%(-0.619)#547 |
| 82. | Clarksville | 0.16% | 0.59%(-0.429)#80 | 0.78%(-0.621)#548 |
| 83. | Evansville | 0.14% | 0.59%(-0.448)#81 | 0.78%(-0.640)#552 |
| 84. | St John | 0.13% | 0.59%(-0.457)#82 | 0.78%(-0.649)#553 |
| 85. | Kokomo | 0.13% | 0.59%(-0.458)#83 | 0.78%(-0.650)#554 |
| 86. | Michigan City | 0.13% | 0.59%(-0.462)#84 | 0.78%(-0.654)#555 |
| 87. | Griffith | 0.12% | 0.59%(-0.470)#85 | 0.78%(-0.662)#556 |
| 88. | Elkhart | 0.12% | 0.59%(-0.472)#86 | 0.78%(-0.664)#557 |
| 89. | Hobart | 0.11% | 0.59%(-0.479)#87 | 0.78%(-0.671)#558 |
| 90. | Notre Dame | 0.11% | 0.59%(-0.479)#88 | 0.78%(-0.671)#559 |
| 91. | Southport | 0.096% | 0.59%(-0.492)#89 | 0.78%(-0.683)#560 |
| 92. | New Pekin | 0.082% | 0.59%(-0.506)#90 | 0.78%(-0.698)#561 |
| 93. | New Castle | 0.080% | 0.59%(-0.507)#91 | 0.78%(-0.699)#562 |
| 94. | Chesterton | 0.063% | 0.59%(-0.524)#92 | 0.78%(-0.716)#563 |
| 95. | Beech Grove | 0.059% | 0.59%(-0.528)#93 | 0.78%(-0.720)#564 |
| 96. | Portage | 0.037% | 0.59%(-0.550)#94 | 0.78%(-0.742)#565 |
| 97. | New Haven | 0.032% | 0.59%(-0.555)#95 | 0.78%(-0.747)#566 |
| 98. | Auburn | 0.030% | 0.59%(-0.557)#96 | 0.78%(-0.749)#567 |
| 99. | Bedford | 0.029% | 0.59%(-0.558)#97 | 0.78%(-0.750)#568 |
| 100. | Schererville | 0.020% | 0.59%(-0.567)#98 | 0.78%(-0.759)#569 |
Common Questions
What are the Top 10 Cities with the Highest Percentage of Immigrants from Africa in Indiana?
Top 10 Cities with the Highest Percentage of Immigrants from Africa in Indiana are:
#1
9.58%
#2
7.10%
#3
5.12%
#4
3.16%
#5
2.99%
#6
2.67%
#7
2.52%
#8
2.08%
#9
2.04%
#10
2.02%
What city has the Highest Percentage of Immigrants from Africa in Indiana?
Speedway has the Highest Percentage of Immigrants from Africa in Indiana with 9.58%.
What is the Percentage of Immigrants from Africa in the State of Indiana?
Percentage of Immigrants from Africa in Indiana is 0.59%.
What is the Percentage of Immigrants from Africa in the United States?
Percentage of Immigrants from Africa in the United States is 0.78%.