Italian vs Yugoslavian Unemployment Among Women with Children Ages 6 to 17 years

COMPARE

Italian
Race
Ancestry
AfghanAfricanAlaska NativeAlaskan AthabascanAlbanianAleutAlsatianAmericanApacheArabArapahoArgentineanArmenianAssyrian/Chaldean/SyriacAustralianAustrianBahamianBangladeshiBarbadianBasqueBelgianBelizeanBermudanBhutaneseBlackfeetBolivianBrazilianBritishBritish West IndianBulgarianBurmeseCajunCambodianCanadianCape VerdeanCarpatho RusynCelticCentral AmericanCentral American IndianCherokeeCheyenneChickasawChileanChineseChippewaChoctawColombianColvilleComancheCosta RicanCreeCreekCroatianCrowCubanCypriotCzechCzechoslovakianDanishDelawareDominicanDutchDutch West IndianEastern EuropeanEcuadorianEgyptianEnglishEstonianEthiopianEuropeanFijianFilipinoFinnishFrenchFrench American IndianFrench CanadianGermanGerman RussianGhanaianGreekGuamanian/ChamorroGuatemalanGuyaneseHaitianHmongHonduranHopiHoumaHungarianIcelanderIndian (Asian)IndonesianInupiatIranianIraqiIrishIroquoisIsraeliItalianJamaicanJapaneseJordanianKenyanKiowaKoreanLaotianLatvianLebaneseLiberianLithuanianLumbeeLuxembourgerMacedonianMalaysianMalteseMarshalleseMenomineeMexicanMexican American IndianMongolianMoroccanNative HawaiianNavajoNepaleseNew ZealanderNicaraguanNigerianNorthern EuropeanNorwegianOkinawanOsageOttawaPaiutePakistaniPalestinianPanamanianParaguayanPennsylvania GermanPeruvianPimaPolishPortuguesePotawatomiPuebloPuerto RicanPuget Sound SalishRomanianRussianSalvadoranSamoanScandinavianScotch-IrishScottishSeminoleSenegaleseSerbianShoshoneSierra LeoneanSiouxSlavicSlovakSloveneSomaliSouth AfricanSouth AmericanSouth American IndianSoviet UnionSpaniardSpanishSpanish AmericanSpanish American IndianSri LankanSubsaharan AfricanSudaneseSwedishSwissSyrianTaiwaneseThaiTlingit-HaidaTohono O'OdhamTonganTrinidadian and TobagonianTsimshianTurkishU.S. Virgin IslanderUgandanUkrainianUruguayanUteVenezuelanVietnameseWelshWest IndianYakamaYaquiYumanYup'ikZimbabwean
Immigration
NonimmigrantsImmigrantsAfghanistanAfricaAlbaniaArgentinaArmeniaAsiaAustraliaAustriaBahamasBangladeshBarbadosBelarusBelgiumBelizeBoliviaBosnia and HerzegovinaBrazilBulgariaBurma/MyanmarCabo VerdeCambodiaCameroonCanadaCaribbeanCentral AmericaChileChinaColombiaCongoCosta RicaCroatiaCubaCzechoslovakiaDenmarkDominicaDominican RepublicEastern AfricaEastern AsiaEastern EuropeEcuadorEgyptEl SalvadorEnglandEritreaEthiopiaEuropeFijiFranceGermanyGhanaGreeceGrenadaGuatemalaGuyanaHaitiHondurasHong KongHungaryIndiaIndonesiaIranIraqIrelandIsraelItalyJamaicaJapanJordanKazakhstanKenyaKoreaKuwaitLaosLatin AmericaLatviaLebanonLiberiaLithuaniaMalaysiaMexicoMicronesiaMiddle AfricaMoldovaMoroccoNepalNetherlandsNicaraguaNigeriaNorth AmericaNorth MacedoniaNorthern AfricaNorthern EuropeNorwayOceaniaPakistanPanamaPeruPhilippinesPolandPortugalRomaniaRussiaSaudi ArabiaScotlandSenegalSerbiaSierra LeoneSingaporeSomaliaSouth AfricaSouth AmericaSouth Central AsiaSouth Eastern AsiaSouthern EuropeSpainSri LankaSt. Vincent and the GrenadinesSudanSwedenSwitzerlandSyriaTaiwanThailandTrinidad and TobagoTurkeyUgandaUkraineUruguayUzbekistanVenezuelaVietnamWest IndiesWestern AfricaWestern AsiaWestern EuropeYemenZaireZimbabweAzores
Yugoslavian
Race
Ancestry
AfghanAfricanAlaska NativeAlaskan AthabascanAlbanianAleutAlsatianAmericanApacheArabArapahoArgentineanArmenianAssyrian/Chaldean/SyriacAustralianAustrianBahamianBangladeshiBarbadianBasqueBelgianBelizeanBermudanBhutaneseBlackfeetBolivianBrazilianBritishBritish West IndianBulgarianBurmeseCajunCambodianCanadianCape VerdeanCarpatho RusynCelticCentral AmericanCentral American IndianCherokeeCheyenneChickasawChileanChineseChippewaChoctawColombianColvilleComancheCosta RicanCreeCreekCroatianCrowCubanCypriotCzechCzechoslovakianDanishDelawareDominicanDutchDutch West IndianEastern EuropeanEcuadorianEgyptianEnglishEstonianEthiopianEuropeanFijianFilipinoFinnishFrenchFrench American IndianFrench CanadianGermanGerman RussianGhanaianGreekGuamanian/ChamorroGuatemalanGuyaneseHaitianHmongHonduranHopiHoumaHungarianIcelanderIndian (Asian)IndonesianInupiatIranianIraqiIrishIroquoisIsraeliJamaicanJapaneseJordanianKenyanKiowaKoreanLaotianLatvianLebaneseLiberianLithuanianLumbeeLuxembourgerMacedonianMalaysianMalteseMarshalleseMenomineeMexicanMexican American IndianMongolianMoroccanNative HawaiianNavajoNepaleseNew ZealanderNicaraguanNigerianNorthern EuropeanNorwegianOkinawanOsageOttawaPaiutePakistaniPalestinianPanamanianParaguayanPennsylvania GermanPeruvianPimaPolishPortuguesePotawatomiPuebloPuerto RicanPuget Sound SalishRomanianRussianSalvadoranSamoanScandinavianScotch-IrishScottishSeminoleSenegaleseSerbianShoshoneSierra LeoneanSiouxSlavicSlovakSloveneSomaliSouth AfricanSouth AmericanSouth American IndianSoviet UnionSpaniardSpanishSpanish AmericanSpanish American IndianSri LankanSubsaharan AfricanSudaneseSwedishSwissSyrianTaiwaneseThaiTlingit-HaidaTohono O'OdhamTonganTrinidadian and TobagonianTsimshianTurkishU.S. Virgin IslanderUgandanUkrainianUruguayanUteVenezuelanVietnameseWelshWest IndianYakamaYaquiYugoslavianYumanYup'ikZimbabwean
Immigration
NonimmigrantsImmigrantsAfghanistanAfricaAlbaniaArgentinaArmeniaAsiaAustraliaAustriaBahamasBangladeshBarbadosBelarusBelgiumBelizeBoliviaBosnia and HerzegovinaBrazilBulgariaBurma/MyanmarCabo VerdeCambodiaCameroonCanadaCaribbeanCentral AmericaChileChinaColombiaCongoCosta RicaCroatiaCubaCzechoslovakiaDenmarkDominicaDominican RepublicEastern AfricaEastern AsiaEastern EuropeEcuadorEgyptEl SalvadorEnglandEritreaEthiopiaEuropeFijiFranceGermanyGhanaGreeceGrenadaGuatemalaGuyanaHaitiHondurasHong KongHungaryIndiaIndonesiaIranIraqIrelandIsraelItalyJamaicaJapanJordanKazakhstanKenyaKoreaKuwaitLaosLatin AmericaLatviaLebanonLiberiaLithuaniaMalaysiaMexicoMicronesiaMiddle AfricaMoldovaMoroccoNepalNetherlandsNicaraguaNigeriaNorth AmericaNorth MacedoniaNorthern AfricaNorthern EuropeNorwayOceaniaPakistanPanamaPeruPhilippinesPolandPortugalRomaniaRussiaSaudi ArabiaScotlandSenegalSerbiaSierra LeoneSingaporeSomaliaSouth AfricaSouth AmericaSouth Central AsiaSouth Eastern AsiaSouthern EuropeSpainSri LankaSt. Vincent and the GrenadinesSudanSwedenSwitzerlandSyriaTaiwanThailandTrinidad and TobagoTurkeyUgandaUkraineUruguayUzbekistanVenezuelaVietnamWest IndiesWestern AfricaWestern AsiaWestern EuropeYemenZaireZimbabweAzores
Unemployment Among Women with Children Ages 6 to 17 years
Income
Poverty
Unemployment
Labor Participation
Family Structure
Vehicle Availability
Education Level
Disability

Unemployment Among Women with Children Ages 6 to 17 years Comparison

Italians

Yugoslavians

Tragic
Exceptional
9.5%
UNEMPLOYMENT AMONG WOMEN WITH CHILDREN AGES 6 TO 17 YEARS
0.6/ 100
METRIC RATING
260th/ 347
METRIC RANK
8.5%
UNEMPLOYMENT AMONG WOMEN WITH CHILDREN AGES 6 TO 17 YEARS
99.0/ 100
METRIC RATING
90th/ 347
METRIC RANK

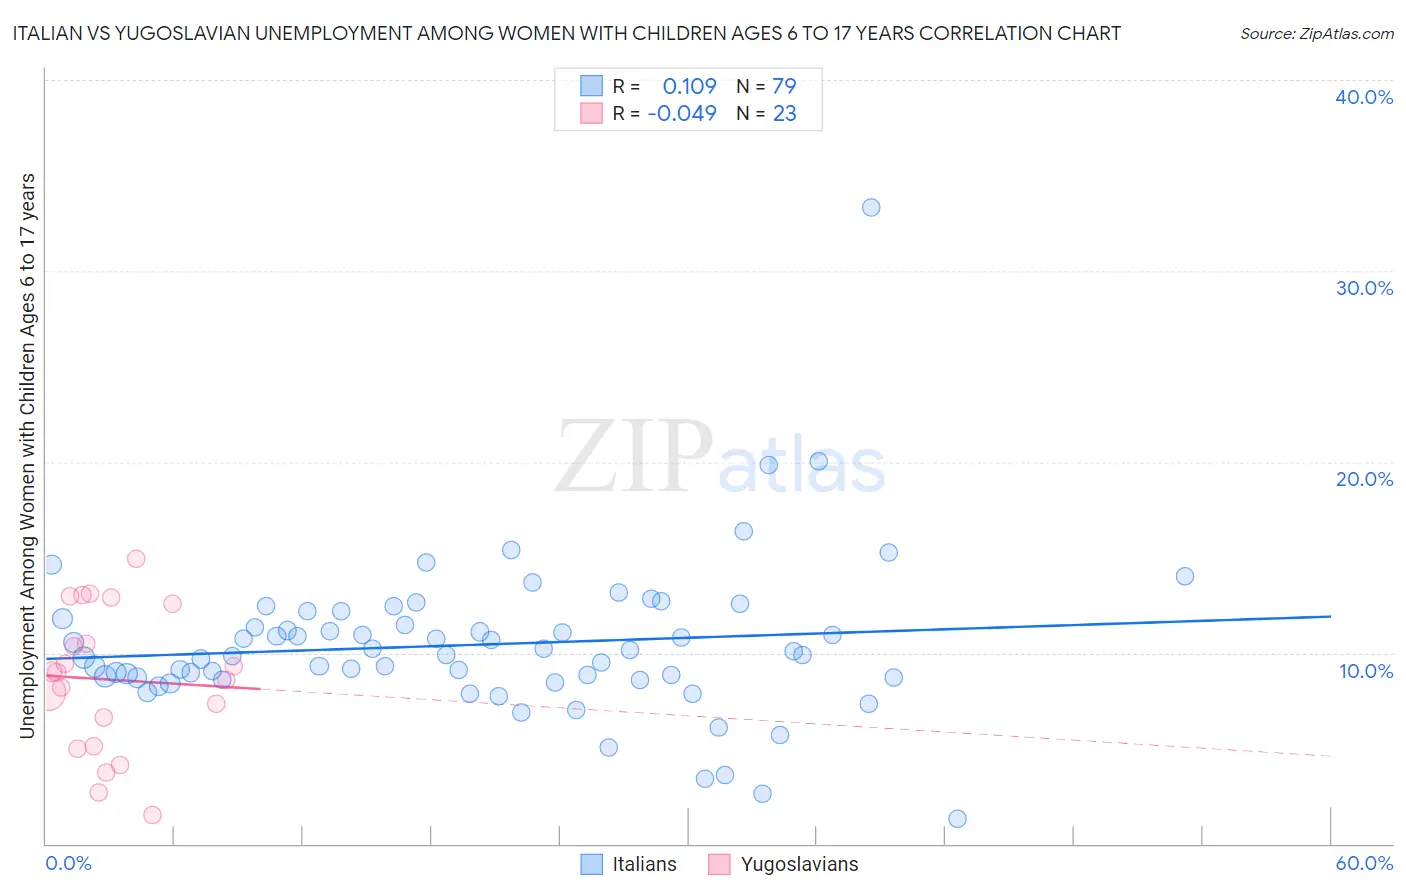
Italian vs Yugoslavian Unemployment Among Women with Children Ages 6 to 17 years Correlation Chart

The statistical analysis conducted on geographies consisting of 359,413,908 people shows a poor positive correlation between the proportion of Italians and unemployment rate among women with children between the ages 6 and 17 in the United States with a correlation coefficient (R) of 0.109 and weighted average of 9.5%. Similarly, the statistical analysis conducted on geographies consisting of 213,370,013 people shows no correlation between the proportion of Yugoslavians and unemployment rate among women with children between the ages 6 and 17 in the United States with a correlation coefficient (R) of -0.049 and weighted average of 8.5%, a difference of 11.5%.
Italian vs Yugoslavian Unemployment Among Women with Children Ages 6 to 17 years

Unemployment Among Women with Children Ages 6 to 17 years Correlation Summary

MeasurementItalianYugoslavian
Minimum1.3%1.5%
Maximum33.3%14.9%
Range32.0%13.4%
Mean10.4%8.6%
Median9.9%9.0%
Interquartile 25% (IQ1)8.7%5.1%
Interquartile 75% (IQ3)11.8%12.6%
Interquartile Range (IQR)3.1%7.5%
Standard Deviation (Sample)4.1%3.7%
Standard Deviation (Population)4.1%3.6%

Similar Demographics by Unemployment Among Women with Children Ages 6 to 17 years

Demographics Similar to Italians by Unemployment Among Women with Children Ages 6 to 17 years

In terms of unemployment among women with children ages 6 to 17 years, the demographic groups most similar to Italians are South American (9.5%, a difference of 0.080%), Immigrants from Central America (9.5%, a difference of 0.11%), Senegalese (9.5%, a difference of 0.14%), Lebanese (9.5%, a difference of 0.18%), and Immigrants from Mexico (9.5%, a difference of 0.21%).
DemographicsRating | RankUnemployment Among Women with Children Ages 6 to 17 years
Portuguese
1.1
/100
|
#253
Tragic
9.4%
Nicaraguans
1.0
/100
|
#254
Tragic
9.4%
Lithuanians
0.9
/100
|
#255
Tragic
9.4%
Canadians
0.8
/100
|
#256
Tragic
9.4%
Celtics
0.7
/100
|
#257
Tragic
9.5%
Immigrants | Mexico
0.7
/100
|
#258
Tragic
9.5%
Immigrants | Central America
0.6
/100
|
#259
Tragic
9.5%
Italians
0.6
/100
|
#260
Tragic
9.5%
South Americans
0.5
/100
|
#261
Tragic
9.5%
Senegalese
0.5
/100
|
#262
Tragic
9.5%
Lebanese
0.5
/100
|
#263
Tragic
9.5%
Immigrants | Ghana
0.4
/100
|
#264
Tragic
9.5%
West Indians
0.4
/100
|
#265
Tragic
9.5%
Immigrants | Jamaica
0.3
/100
|
#266
Tragic
9.5%
Irish
0.3
/100
|
#267
Tragic
9.5%

Demographics Similar to Yugoslavians by Unemployment Among Women with Children Ages 6 to 17 years

In terms of unemployment among women with children ages 6 to 17 years, the demographic groups most similar to Yugoslavians are Paiute (8.5%, a difference of 0.040%), Immigrants from Eastern Europe (8.5%, a difference of 0.060%), Potawatomi (8.5%, a difference of 0.090%), Immigrants from Vietnam (8.5%, a difference of 0.12%), and Immigrants from Israel (8.5%, a difference of 0.13%).
DemographicsRating | RankUnemployment Among Women with Children Ages 6 to 17 years
Bulgarians
99.5
/100
|
#83
Exceptional
8.4%
Japanese
99.5
/100
|
#84
Exceptional
8.4%
Immigrants | North Macedonia
99.4
/100
|
#85
Exceptional
8.5%
Alaskan Athabascans
99.4
/100
|
#86
Exceptional
8.5%
Immigrants | Israel
99.1
/100
|
#87
Exceptional
8.5%
Immigrants | Vietnam
99.1
/100
|
#88
Exceptional
8.5%
Paiute
99.1
/100
|
#89
Exceptional
8.5%
Yugoslavians
99.0
/100
|
#90
Exceptional
8.5%
Immigrants | Eastern Europe
99.0
/100
|
#91
Exceptional
8.5%
Potawatomi
99.0
/100
|
#92
Exceptional
8.5%
Australians
98.9
/100
|
#93
Exceptional
8.5%
Immigrants | Barbados
98.8
/100
|
#94
Exceptional
8.5%
Sri Lankans
98.7
/100
|
#95
Exceptional
8.5%
German Russians
98.6
/100
|
#96
Exceptional
8.5%
Bolivians
98.5
/100
|
#97
Exceptional
8.5%