Cities with the Most Immigrants from Hong Kong in Michigan
RELATED REPORTS & OPTIONS
Hong Kong
Michigan
Compare Cities
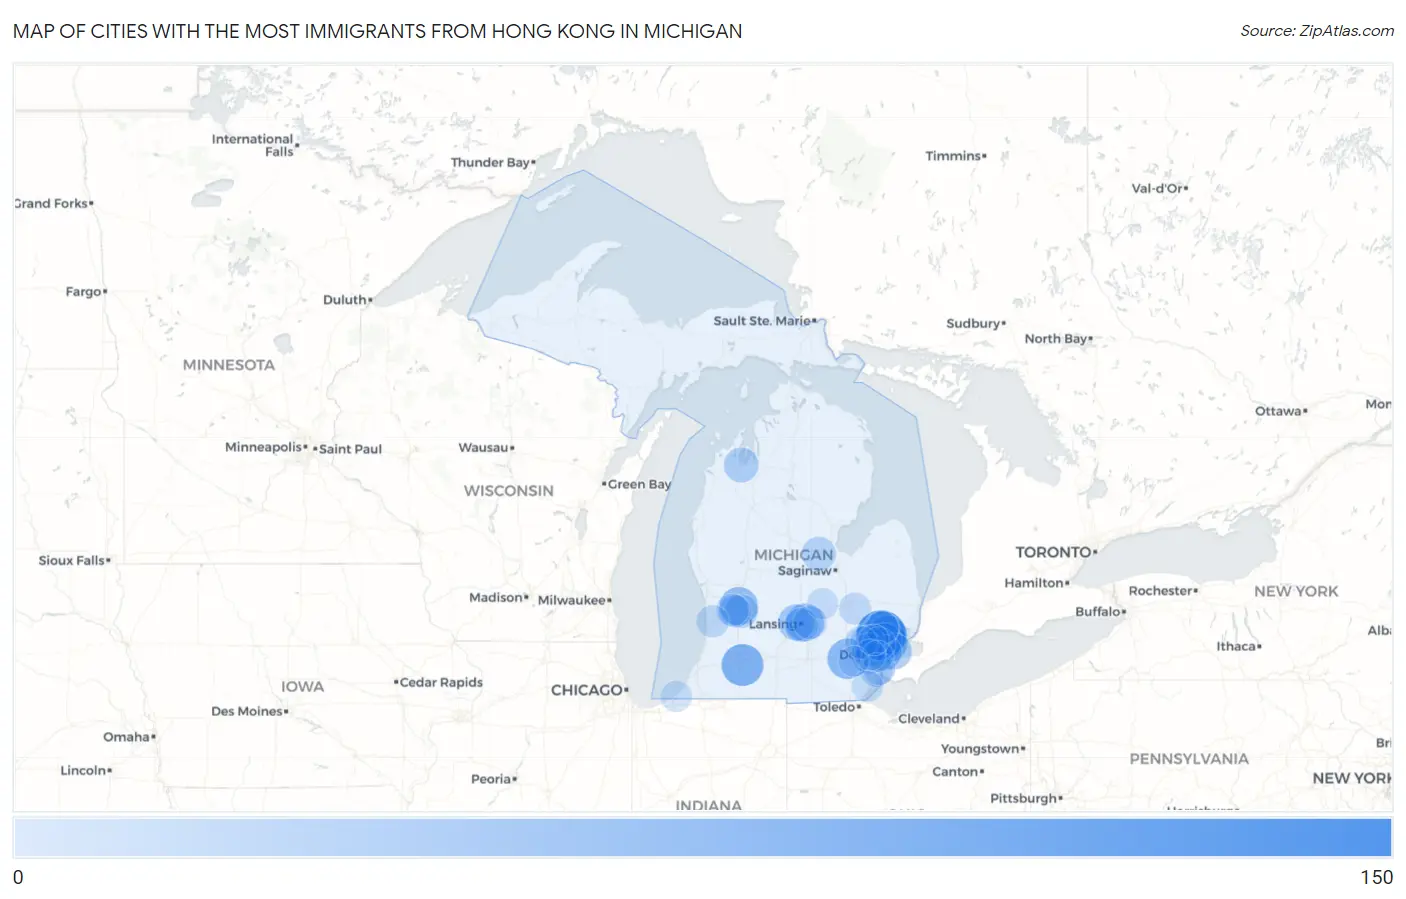
Map of Cities with the Most Immigrants from Hong Kong in Michigan
0
150
Cities with the Most Immigrants from Hong Kong in Michigan
| City | Hong Kong | vs State | vs National | |
| 1. | Troy | 124 | 1,685(7.36%)#1 | 239,302(0.05%)#245 |
| 2. | Portage | 74 | 1,685(4.39%)#2 | 239,302(0.03%)#398 |
| 3. | Ann Arbor | 63 | 1,685(3.74%)#3 | 239,302(0.03%)#461 |
| 4. | Warren | 60 | 1,685(3.56%)#4 | 239,302(0.03%)#488 |
| 5. | Sterling Heights | 55 | 1,685(3.26%)#5 | 239,302(0.02%)#516 |
| 6. | Grand Rapids | 52 | 1,685(3.09%)#6 | 239,302(0.02%)#541 |
| 7. | East Lansing | 47 | 1,685(2.79%)#7 | 239,302(0.02%)#589 |
| 8. | Madison Heights | 37 | 1,685(2.20%)#8 | 239,302(0.02%)#708 |
| 9. | Waverly | 37 | 1,685(2.20%)#9 | 239,302(0.02%)#709 |
| 10. | Grosse Pointe Park | 37 | 1,685(2.20%)#10 | 239,302(0.02%)#714 |
| 11. | Detroit | 35 | 1,685(2.08%)#11 | 239,302(0.01%)#737 |
| 12. | Rochester Hills | 31 | 1,685(1.84%)#12 | 239,302(0.01%)#802 |
| 13. | Traverse City | 29 | 1,685(1.72%)#13 | 239,302(0.01%)#862 |
| 14. | Westland | 28 | 1,685(1.66%)#14 | 239,302(0.01%)#867 |
| 15. | Farmington Hills | 27 | 1,685(1.60%)#15 | 239,302(0.01%)#883 |
| 16. | Midland | 23 | 1,685(1.36%)#16 | 239,302(0.01%)#988 |
| 17. | Lansing | 22 | 1,685(1.31%)#17 | 239,302(0.01%)#1,008 |
| 18. | Livonia | 21 | 1,685(1.25%)#18 | 239,302(0.01%)#1,043 |
| 19. | Kentwood | 21 | 1,685(1.25%)#19 | 239,302(0.01%)#1,045 |
| 20. | Haslett | 19 | 1,685(1.13%)#20 | 239,302(0.01%)#1,114 |
| 21. | Woodhaven | 19 | 1,685(1.13%)#21 | 239,302(0.01%)#1,116 |
| 22. | Oak Park | 18 | 1,685(1.07%)#22 | 239,302(0.01%)#1,142 |
| 23. | Rochester | 15 | 1,685(0.89%)#23 | 239,302(0.01%)#1,282 |
| 24. | Wyoming | 14 | 1,685(0.83%)#24 | 239,302(0.01%)#1,302 |
| 25. | Novi | 14 | 1,685(0.83%)#25 | 239,302(0.01%)#1,303 |
| 26. | Grandville | 14 | 1,685(0.83%)#26 | 239,302(0.01%)#1,329 |
| 27. | Holland | 13 | 1,685(0.77%)#27 | 239,302(0.01%)#1,368 |
| 28. | Trenton | 13 | 1,685(0.77%)#28 | 239,302(0.01%)#1,377 |
| 29. | Grand Blanc | 11 | 1,685(0.65%)#29 | 239,302(0.00%)#1,501 |
| 30. | Dearborn | 7 | 1,685(0.42%)#30 | 239,302(0.00%)#1,708 |
| 31. | Monroe | 7 | 1,685(0.42%)#31 | 239,302(0.00%)#1,732 |
| 32. | Owosso | 7 | 1,685(0.42%)#32 | 239,302(0.00%)#1,743 |
| 33. | New Buffalo | 6 | 1,685(0.36%)#33 | 239,302(0.00%)#1,846 |
| 34. | Garden City | 4 | 1,685(0.24%)#34 | 239,302(0.00%)#1,905 |
| 35. | Ypsilanti | 3 | 1,685(0.18%)#35 | 239,302(0.00%)#1,940 |
| 36. | Bingham Farms | 3 | 1,685(0.18%)#36 | 239,302(0.00%)#1,959 |
| 37. | Kincheloe | 2 | 1,685(0.12%)#37 | 239,302(0.00%)#1,983 |
Common Questions
What are the Top 10 Cities with the Most Immigrants from Hong Kong in Michigan?
Top 10 Cities with the Most Immigrants from Hong Kong in Michigan are:
#1
124
#2
74
#3
63
#4
60
#5
55
#6
52
#7
47
#8
37
#9
37
#10
37
What city has the Most Immigrants from Hong Kong in Michigan?
Troy has the Most Immigrants from Hong Kong in Michigan with 124.
What is the Total Immigrants from Hong Kong in the State of Michigan?
Total Immigrants from Hong Kong in Michigan is 1,685.
What is the Total Immigrants from Hong Kong in the United States?
Total Immigrants from Hong Kong in the United States is 239,302.