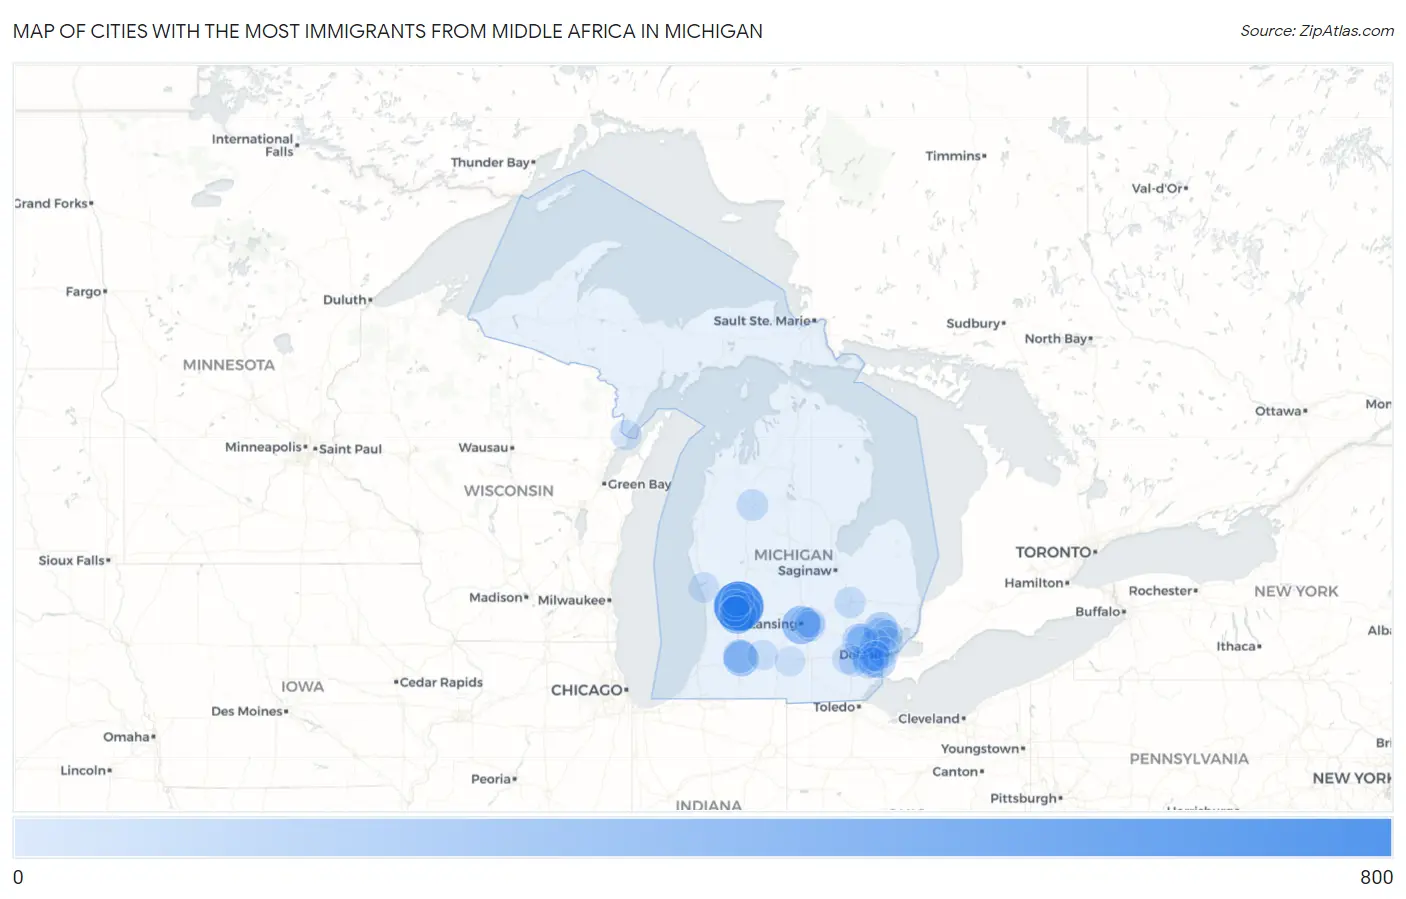
Cities with the Most Immigrants from Middle Africa in Michigan
RELATED REPORTS & OPTIONS
Middle Africa
Michigan
Compare Cities
Map of Cities with the Most Immigrants from Middle Africa in Michigan
0
800
Cities with the Most Immigrants from Middle Africa in Michigan
| City | Middle Africa | vs State | vs National | |
| 1. | Grand Rapids | 775 | 3,833(20.22%)#1 | 193,874(0.40%)#43 |
| 2. | Kentwood | 336 | 3,833(8.77%)#2 | 193,874(0.17%)#120 |
| 3. | Lansing | 313 | 3,833(8.17%)#3 | 193,874(0.16%)#125 |
| 4. | Cutlerville | 300 | 3,833(7.83%)#4 | 193,874(0.15%)#131 |
| 5. | Kalamazoo | 203 | 3,833(5.30%)#5 | 193,874(0.10%)#201 |
| 6. | Troy | 151 | 3,833(3.94%)#6 | 193,874(0.08%)#251 |
| 7. | Lincoln Park | 142 | 3,833(3.70%)#7 | 193,874(0.07%)#267 |
| 8. | Westwood | 140 | 3,833(3.65%)#8 | 193,874(0.07%)#269 |
| 9. | Rochester Hills | 135 | 3,833(3.52%)#9 | 193,874(0.07%)#278 |
| 10. | Wixom | 103 | 3,833(2.69%)#10 | 193,874(0.05%)#336 |
| 11. | Comstock Park | 94 | 3,833(2.45%)#11 | 193,874(0.05%)#363 |
| 12. | Novi | 82 | 3,833(2.14%)#12 | 193,874(0.04%)#405 |
| 13. | Westland | 64 | 3,833(1.67%)#13 | 193,874(0.03%)#488 |
| 14. | Romulus | 63 | 3,833(1.64%)#14 | 193,874(0.03%)#493 |
| 15. | Cadillac | 57 | 3,833(1.49%)#15 | 193,874(0.03%)#525 |
| 16. | Flint | 43 | 3,833(1.12%)#16 | 193,874(0.02%)#619 |
| 17. | Wayne | 35 | 3,833(0.91%)#17 | 193,874(0.02%)#694 |
| 18. | Warren | 32 | 3,833(0.83%)#18 | 193,874(0.02%)#722 |
| 19. | East Lansing | 30 | 3,833(0.78%)#19 | 193,874(0.02%)#743 |
| 20. | Dearborn | 25 | 3,833(0.65%)#20 | 193,874(0.01%)#805 |
| 21. | Sterling Heights | 23 | 3,833(0.60%)#21 | 193,874(0.01%)#822 |
| 22. | Ann Arbor | 23 | 3,833(0.60%)#22 | 193,874(0.01%)#823 |
| 23. | Okemos | 22 | 3,833(0.57%)#23 | 193,874(0.01%)#853 |
| 24. | Southfield | 19 | 3,833(0.50%)#24 | 193,874(0.01%)#903 |
| 25. | Roosevelt Park | 18 | 3,833(0.47%)#25 | 193,874(0.01%)#937 |
| 26. | Detroit | 16 | 3,833(0.42%)#26 | 193,874(0.01%)#953 |
| 27. | Ypsilanti | 16 | 3,833(0.42%)#27 | 193,874(0.01%)#967 |
| 28. | Menominee | 16 | 3,833(0.42%)#28 | 193,874(0.01%)#974 |
| 29. | Walker | 14 | 3,833(0.37%)#29 | 193,874(0.01%)#1,012 |
| 30. | Walled Lake | 14 | 3,833(0.37%)#30 | 193,874(0.01%)#1,019 |
| 31. | Taylor | 11 | 3,833(0.29%)#31 | 193,874(0.01%)#1,096 |
| 32. | Springfield | 10 | 3,833(0.26%)#32 | 193,874(0.01%)#1,143 |
| 33. | Dearborn Heights | 9 | 3,833(0.23%)#33 | 193,874(0.00%)#1,158 |
| 34. | Haslett | 9 | 3,833(0.23%)#34 | 193,874(0.00%)#1,170 |
| 35. | Wyoming | 6 | 3,833(0.16%)#35 | 193,874(0.00%)#1,239 |
| 36. | Albion | 4 | 3,833(0.10%)#36 | 193,874(0.00%)#1,291 |
Common Questions
What are the Top 10 Cities with the Most Immigrants from Middle Africa in Michigan?
Top 10 Cities with the Most Immigrants from Middle Africa in Michigan are:
#1
775
#2
336
#3
313
#4
300
#5
203
#6
151
#7
142
#8
140
#9
135
#10
103
What city has the Most Immigrants from Middle Africa in Michigan?
Grand Rapids has the Most Immigrants from Middle Africa in Michigan with 775.
What is the Total Immigrants from Middle Africa in the State of Michigan?
Total Immigrants from Middle Africa in Michigan is 3,833.
What is the Total Immigrants from Middle Africa in the United States?
Total Immigrants from Middle Africa in the United States is 193,874.