Cities with the Highest Poverty Level Among Single Fathers in Michigan
RELATED REPORTS & OPTIONS
Highest Poverty | Single Father
Michigan
Compare Cities
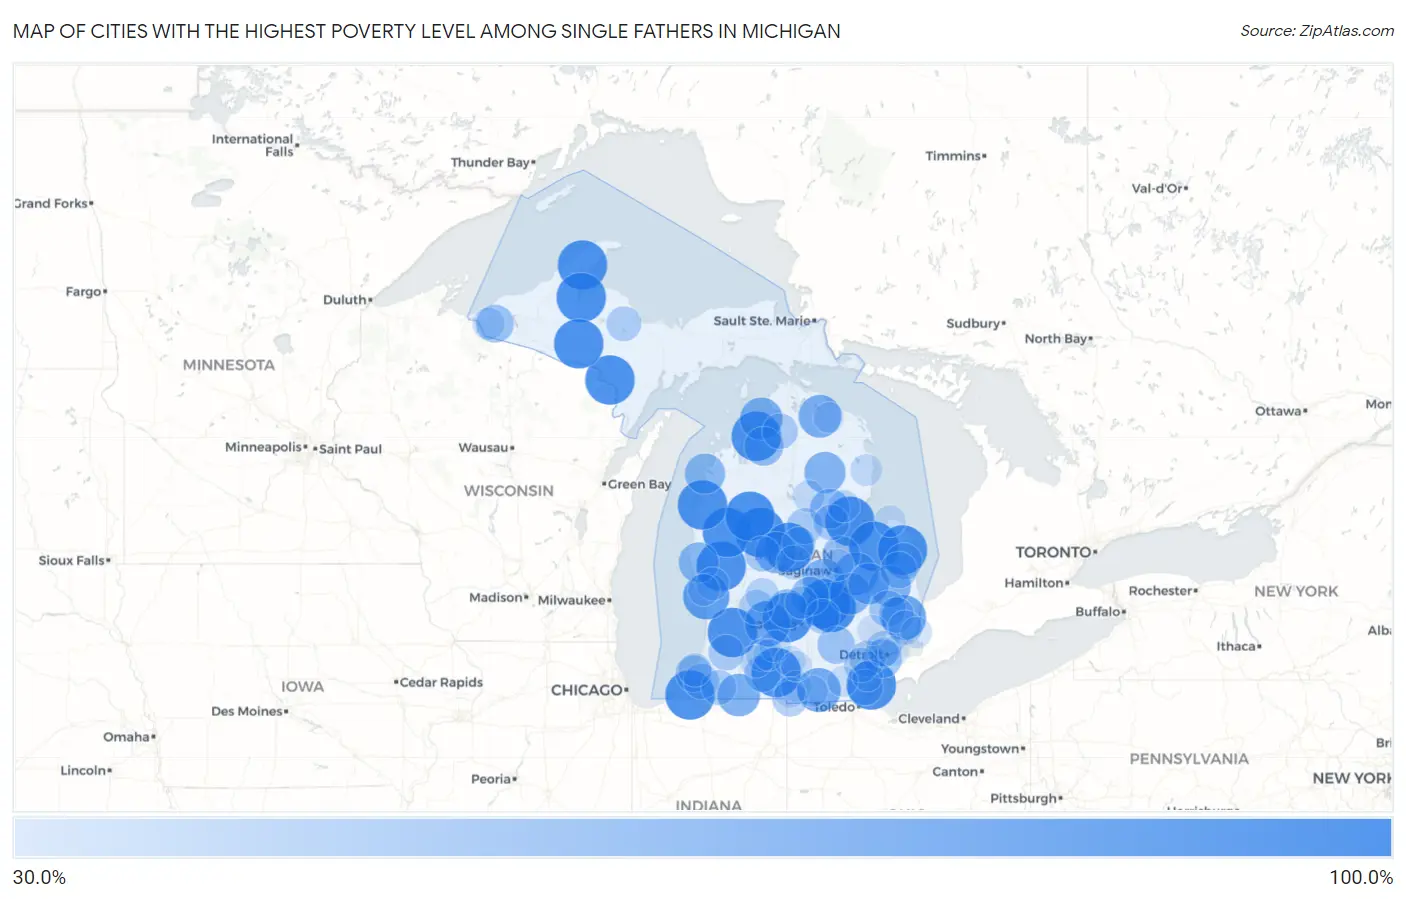
Map of Cities with the Highest Poverty Level Among Single Fathers in Michigan
0.0%
100.0%
Cities with the Highest Poverty Level Among Single Fathers in Michigan
| City | Single Father Poverty | vs State | vs National | |
| 1. | Fremont | 100.0% | 15.1%(+84.9)#1 | 13.7%(+86.3)#93 |
| 2. | Norway | 100.0% | 15.1%(+84.9)#2 | 13.7%(+86.3)#181 |
| 3. | Detroit Beach | 100.0% | 15.1%(+84.9)#3 | 13.7%(+86.3)#245 |
| 4. | Evart | 100.0% | 15.1%(+84.9)#4 | 13.7%(+86.3)#304 |
| 5. | Lake Linden | 100.0% | 15.1%(+84.9)#5 | 13.7%(+86.3)#426 |
| 6. | Baldwin | 100.0% | 15.1%(+84.9)#6 | 13.7%(+86.3)#469 |
| 7. | Au Gres | 100.0% | 15.1%(+84.9)#7 | 13.7%(+86.3)#514 |
| 8. | Hopkins | 100.0% | 15.1%(+84.9)#8 | 13.7%(+86.3)#573 |
| 9. | Middletown | 100.0% | 15.1%(+84.9)#9 | 13.7%(+86.3)#601 |
| 10. | Tekonsha | 100.0% | 15.1%(+84.9)#10 | 13.7%(+86.3)#622 |
| 11. | Vernon | 100.0% | 15.1%(+84.9)#11 | 13.7%(+86.3)#655 |
| 12. | Hermansville | 100.0% | 15.1%(+84.9)#12 | 13.7%(+86.3)#664 |
| 13. | Galien | 100.0% | 15.1%(+84.9)#13 | 13.7%(+86.3)#733 |
| 14. | Rosebush | 100.0% | 15.1%(+84.9)#14 | 13.7%(+86.3)#792 |
| 15. | Zeba | 100.0% | 15.1%(+84.9)#15 | 13.7%(+86.3)#813 |
| 16. | Eastport | 100.0% | 15.1%(+84.9)#16 | 13.7%(+86.3)#836 |
| 17. | Eastlake | 100.0% | 15.1%(+84.9)#17 | 13.7%(+86.3)#905 |
| 18. | Owendale | 100.0% | 15.1%(+84.9)#18 | 13.7%(+86.3)#917 |
| 19. | Amasa | 100.0% | 15.1%(+84.9)#19 | 13.7%(+86.3)#938 |
| 20. | Tustin | 100.0% | 15.1%(+84.9)#20 | 13.7%(+86.3)#998 |
| 21. | Minden City | 100.0% | 15.1%(+84.9)#21 | 13.7%(+86.3)#1,003 |
| 22. | Eagle | 100.0% | 15.1%(+84.9)#22 | 13.7%(+86.3)#1,122 |
| 23. | Ferrysburg | 88.7% | 15.1%(+73.6)#23 | 13.7%(+75.0)#1,245 |
| 24. | Woodland | 85.7% | 15.1%(+70.6)#24 | 13.7%(+72.0)#1,279 |
| 25. | Pittsford | 84.6% | 15.1%(+69.5)#25 | 13.7%(+70.9)#1,297 |
| 26. | Richmond | 82.5% | 15.1%(+67.4)#26 | 13.7%(+68.7)#1,331 |
| 27. | Winn | 82.4% | 15.1%(+67.3)#27 | 13.7%(+68.6)#1,334 |
| 28. | Clayton | 80.0% | 15.1%(+64.9)#28 | 13.7%(+66.3)#1,387 |
| 29. | Vassar | 75.9% | 15.1%(+60.9)#29 | 13.7%(+62.2)#1,446 |
| 30. | Onaway | 75.8% | 15.1%(+60.7)#30 | 13.7%(+62.0)#1,448 |
| 31. | Charlevoix | 75.0% | 15.1%(+59.9)#31 | 13.7%(+61.3)#1,460 |
| 32. | White Pigeon | 75.0% | 15.1%(+59.9)#32 | 13.7%(+61.3)#1,465 |
| 33. | St Charles | 73.3% | 15.1%(+58.3)#33 | 13.7%(+59.6)#1,517 |
| 34. | Mount Morris | 72.8% | 15.1%(+57.8)#34 | 13.7%(+59.1)#1,528 |
| 35. | Brown City | 71.9% | 15.1%(+56.8)#35 | 13.7%(+58.2)#1,553 |
| 36. | Lake Isabella | 71.4% | 15.1%(+56.4)#36 | 13.7%(+57.7)#1,560 |
| 37. | Mio | 70.6% | 15.1%(+55.5)#37 | 13.7%(+56.9)#1,594 |
| 38. | Fostoria | 70.0% | 15.1%(+54.9)#38 | 13.7%(+56.3)#1,609 |
| 39. | Frankfort | 66.7% | 15.1%(+51.6)#39 | 13.7%(+53.0)#1,696 |
| 40. | Rothbury | 66.7% | 15.1%(+51.6)#40 | 13.7%(+53.0)#1,729 |
| 41. | Skidway Lake | 64.6% | 15.1%(+49.6)#41 | 13.7%(+50.9)#1,783 |
| 42. | Elsie | 62.5% | 15.1%(+47.4)#42 | 13.7%(+48.8)#1,837 |
| 43. | Bellaire | 62.5% | 15.1%(+47.4)#43 | 13.7%(+48.8)#1,839 |
| 44. | Westphalia | 62.5% | 15.1%(+47.4)#44 | 13.7%(+48.8)#1,840 |
| 45. | River Rouge | 60.6% | 15.1%(+45.6)#45 | 13.7%(+46.9)#1,909 |
| 46. | Essexville | 59.3% | 15.1%(+44.2)#46 | 13.7%(+45.5)#1,972 |
| 47. | Wakefield | 57.6% | 15.1%(+42.5)#47 | 13.7%(+43.9)#2,034 |
| 48. | Pinckney | 57.1% | 15.1%(+42.1)#48 | 13.7%(+43.4)#2,043 |
| 49. | Fair Plain | 54.1% | 15.1%(+39.0)#49 | 13.7%(+40.4)#2,186 |
| 50. | Deckerville | 53.8% | 15.1%(+38.8)#50 | 13.7%(+40.1)#2,200 |
| 51. | Sandusky | 53.7% | 15.1%(+38.6)#51 | 13.7%(+40.0)#2,205 |
| 52. | Almont | 53.7% | 15.1%(+38.6)#52 | 13.7%(+39.9)#2,206 |
| 53. | Athens | 53.3% | 15.1%(+38.3)#53 | 13.7%(+39.6)#2,224 |
| 54. | Gladwin | 51.9% | 15.1%(+36.8)#54 | 13.7%(+38.1)#2,280 |
| 55. | Wayne | 51.5% | 15.1%(+36.4)#55 | 13.7%(+37.8)#2,298 |
| 56. | South Monroe | 51.0% | 15.1%(+35.9)#56 | 13.7%(+37.3)#2,313 |
| 57. | Armada | 50.0% | 15.1%(+34.9)#57 | 13.7%(+36.3)#2,356 |
| 58. | Camden | 50.0% | 15.1%(+34.9)#58 | 13.7%(+36.3)#2,413 |
| 59. | Gobles | 50.0% | 15.1%(+34.9)#59 | 13.7%(+36.3)#2,417 |
| 60. | Eau Claire | 50.0% | 15.1%(+34.9)#60 | 13.7%(+36.3)#2,420 |
| 61. | Mecosta | 50.0% | 15.1%(+34.9)#61 | 13.7%(+36.3)#2,435 |
| 62. | Sterling | 50.0% | 15.1%(+34.9)#62 | 13.7%(+36.3)#2,442 |
| 63. | Boyne Falls | 50.0% | 15.1%(+34.9)#63 | 13.7%(+36.3)#2,466 |
| 64. | Highland Park | 49.1% | 15.1%(+34.0)#64 | 13.7%(+35.4)#2,530 |
| 65. | Cassopolis | 48.3% | 15.1%(+33.2)#65 | 13.7%(+34.6)#2,554 |
| 66. | Lowell | 47.6% | 15.1%(+32.5)#66 | 13.7%(+33.9)#2,578 |
| 67. | Belleville | 47.1% | 15.1%(+32.0)#67 | 13.7%(+33.3)#2,599 |
| 68. | Ishpeming | 47.0% | 15.1%(+31.9)#68 | 13.7%(+33.3)#2,609 |
| 69. | Morrice | 46.7% | 15.1%(+31.6)#69 | 13.7%(+33.0)#2,617 |
| 70. | Shepherd | 45.8% | 15.1%(+30.8)#70 | 13.7%(+32.1)#2,655 |
| 71. | New Baltimore | 44.7% | 15.1%(+29.6)#71 | 13.7%(+31.0)#2,702 |
| 72. | Belding | 44.0% | 15.1%(+29.0)#72 | 13.7%(+30.3)#2,736 |
| 73. | Coleman | 42.9% | 15.1%(+27.8)#73 | 13.7%(+29.1)#2,808 |
| 74. | Benton Heights | 42.7% | 15.1%(+27.6)#74 | 13.7%(+29.0)#2,826 |
| 75. | Wolf Lake | 41.0% | 15.1%(+25.9)#75 | 13.7%(+27.3)#2,912 |
| 76. | Kincheloe | 40.6% | 15.1%(+25.6)#76 | 13.7%(+26.9)#2,926 |
| 77. | Springfield | 40.5% | 15.1%(+25.5)#77 | 13.7%(+26.8)#2,929 |
| 78. | Climax | 40.0% | 15.1%(+24.9)#78 | 13.7%(+26.3)#2,976 |
| 79. | St Johns | 39.4% | 15.1%(+24.4)#79 | 13.7%(+25.7)#3,033 |
| 80. | Bessemer | 38.8% | 15.1%(+23.7)#80 | 13.7%(+25.1)#3,072 |
| 81. | Whittemore | 38.1% | 15.1%(+23.0)#81 | 13.7%(+24.4)#3,110 |
| 82. | Zilwaukee | 37.5% | 15.1%(+22.4)#82 | 13.7%(+23.8)#3,137 |
| 83. | Bellevue | 37.5% | 15.1%(+22.4)#83 | 13.7%(+23.8)#3,143 |
| 84. | Lincoln | 37.5% | 15.1%(+22.4)#84 | 13.7%(+23.8)#3,158 |
| 85. | Norton Shores | 37.4% | 15.1%(+22.3)#85 | 13.7%(+23.7)#3,163 |
| 86. | St Helen | 37.2% | 15.1%(+22.1)#86 | 13.7%(+23.5)#3,170 |
| 87. | Port Austin | 36.4% | 15.1%(+21.3)#87 | 13.7%(+22.7)#3,234 |
| 88. | Brownlee Park | 36.1% | 15.1%(+21.0)#88 | 13.7%(+22.4)#3,248 |
| 89. | Algonac | 36.0% | 15.1%(+20.9)#89 | 13.7%(+22.3)#3,257 |
| 90. | Hillsdale | 35.6% | 15.1%(+20.5)#90 | 13.7%(+21.9)#3,292 |
| 91. | Hudson | 34.6% | 15.1%(+19.5)#91 | 13.7%(+20.9)#3,359 |
| 92. | Albion | 33.3% | 15.1%(+18.3)#92 | 13.7%(+19.6)#3,435 |
| 93. | Reading | 33.3% | 15.1%(+18.3)#93 | 13.7%(+19.6)#3,468 |
| 94. | Concord | 33.3% | 15.1%(+18.3)#94 | 13.7%(+19.6)#3,469 |
| 95. | Britton | 33.3% | 15.1%(+18.3)#95 | 13.7%(+19.6)#3,499 |
| 96. | Millersburg | 33.3% | 15.1%(+18.3)#96 | 13.7%(+19.6)#3,561 |
| 97. | Grosse Pointe Park | 32.1% | 15.1%(+17.0)#97 | 13.7%(+18.4)#3,622 |
| 98. | Pontiac | 31.9% | 15.1%(+16.8)#98 | 13.7%(+18.2)#3,634 |
| 99. | Detroit | 31.6% | 15.1%(+16.5)#99 | 13.7%(+17.9)#3,653 |
| 100. | Carleton | 31.6% | 15.1%(+16.5)#100 | 13.7%(+17.9)#3,659 |
Common Questions
What are the Top 10 Cities with the Highest Poverty Level Among Single Fathers in Michigan?
Top 10 Cities with the Highest Poverty Level Among Single Fathers in Michigan are:
#1
100.0%
#2
100.0%
#3
100.0%
#4
100.0%
#5
100.0%
#6
100.0%
#7
100.0%
#8
100.0%
#9
100.0%
#10
100.0%
What city has the Highest Poverty Level Among Single Fathers in Michigan?
Fremont has the Highest Poverty Level Among Single Fathers in Michigan with 100.0%.
What is the Poverty Level Among Single Fathers in the State of Michigan?
Poverty Level Among Single Fathers in Michigan is 15.1%.
What is the Poverty Level Among Single Fathers in the United States?
Poverty Level Among Single Fathers in the United States is 13.7%.