Cities with the Highest Percentage of Immigrants from Canada in Michigan
RELATED REPORTS & OPTIONS
Canada
Michigan
Compare Cities
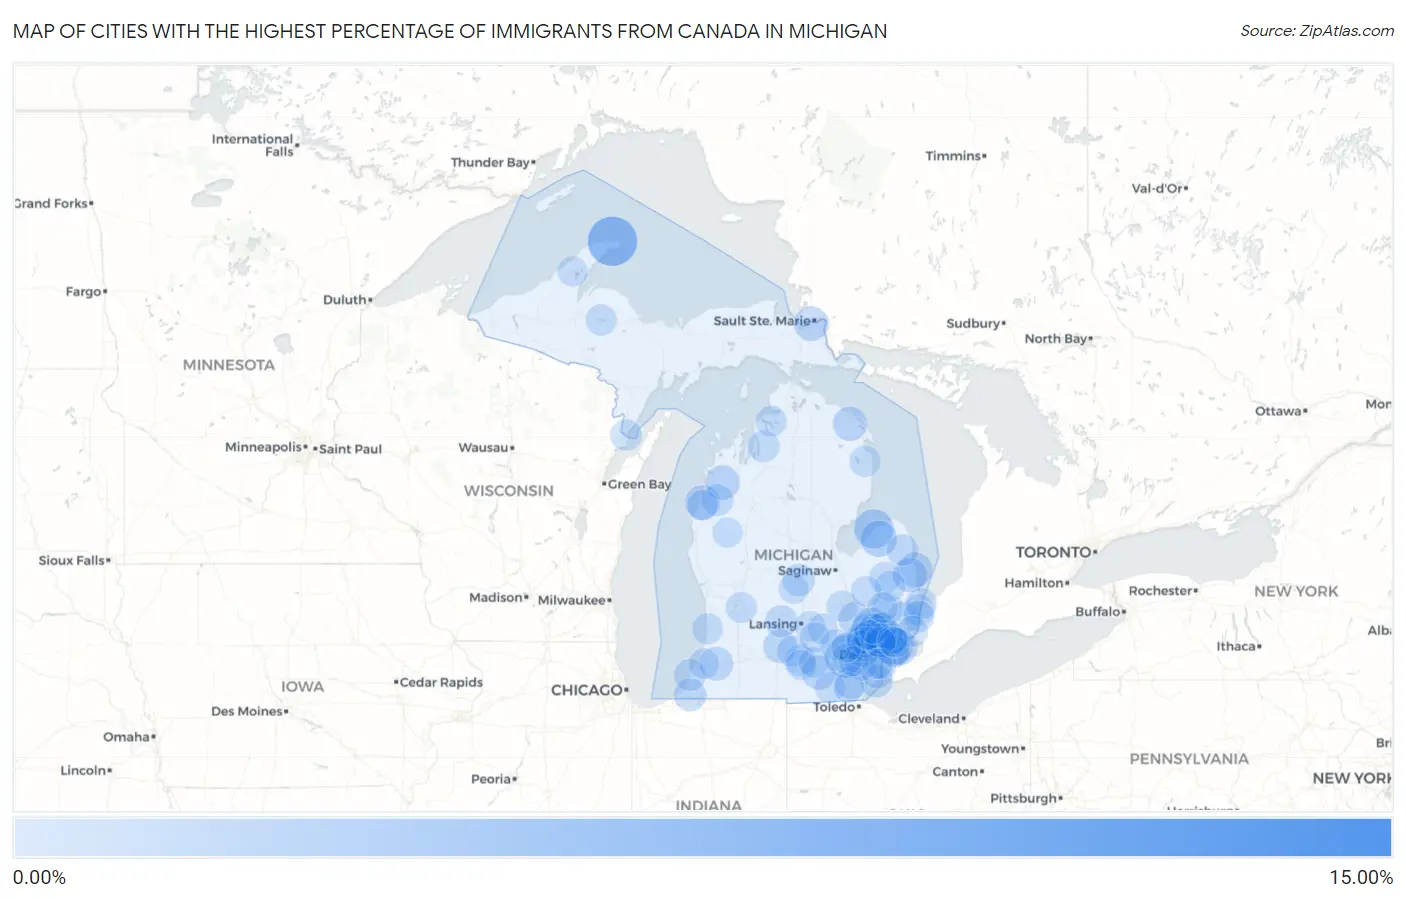
Map of Cities with the Highest Percentage of Immigrants from Canada in Michigan
0.00%
15.00%
Cities with the Highest Percentage of Immigrants from Canada in Michigan
| City | Canada | vs State | vs National | |
| 1. | Nunica | 13.00% | 0.35%(+12.7)#-1 | 0.25%(+12.8)#0 |
| 2. | Copper Harbor | 6.00% | 0.35%(+5.65)#0 | 0.25%(+5.75)#1 |
| 3. | Barton Hills | 4.05% | 0.35%(+3.71)#1 | 0.25%(+3.81)#2 |
| 4. | Caseville | 3.12% | 0.35%(+2.77)#2 | 0.25%(+2.87)#3 |
| 5. | Sylvan Lake | 2.95% | 0.35%(+2.60)#3 | 0.25%(+2.70)#4 |
| 6. | Lake Angelus | 2.44% | 0.35%(+2.09)#11 | 0.25%(+2.19)#610 |
| 7. | Elkton | 2.28% | 0.35%(+1.93)#12 | 0.25%(+2.03)#611 |
| 8. | Grosse Pointe Woods | 2.20% | 0.35%(+1.85)#13 | 0.25%(+1.95)#612 |
| 9. | Port Sanilac | 1.89% | 0.35%(+1.55)#14 | 0.25%(+1.65)#613 |
| 10. | Village Of Grosse Pointe Shores | 1.88% | 0.35%(+1.53)#15 | 0.25%(+1.63)#614 |
| 11. | Parkdale | 1.82% | 0.35%(+1.47)#16 | 0.25%(+1.57)#615 |
| 12. | Sault Ste Marie | 1.81% | 0.35%(+1.46)#17 | 0.25%(+1.56)#616 |
| 13. | Thompsonville | 1.77% | 0.35%(+1.42)#18 | 0.25%(+1.52)#617 |
| 14. | Applegate | 1.72% | 0.35%(+1.37)#19 | 0.25%(+1.47)#618 |
| 15. | Posen | 1.69% | 0.35%(+1.34)#20 | 0.25%(+1.44)#619 |
| 16. | Brooklyn | 1.59% | 0.35%(+1.24)#21 | 0.25%(+1.34)#620 |
| 17. | Lawrence | 1.59% | 0.35%(+1.24)#22 | 0.25%(+1.34)#621 |
| 18. | Olivet | 1.50% | 0.35%(+1.16)#23 | 0.25%(+1.26)#622 |
| 19. | Keego Harbor | 1.48% | 0.35%(+1.13)#24 | 0.25%(+1.23)#623 |
| 20. | Holly | 1.40% | 0.35%(+1.05)#25 | 0.25%(+1.15)#624 |
| 21. | Dundee | 1.39% | 0.35%(+1.04)#26 | 0.25%(+1.14)#625 |
| 22. | Franklin | 1.36% | 0.35%(+1.01)#27 | 0.25%(+1.11)#626 |
| 23. | Galien | 1.22% | 0.35%(+0.876)#28 | 0.25%(+0.976)#627 |
| 24. | Beverly Hills | 1.22% | 0.35%(+0.874)#29 | 0.25%(+0.975)#628 |
| 25. | Estral Beach | 1.21% | 0.35%(+0.862)#30 | 0.25%(+0.962)#629 |
| 26. | Richmond | 1.16% | 0.35%(+0.813)#31 | 0.25%(+0.914)#630 |
| 27. | Ithaca | 1.16% | 0.35%(+0.813)#32 | 0.25%(+0.914)#631 |
| 28. | Mulliken | 1.14% | 0.35%(+0.794)#33 | 0.25%(+0.895)#632 |
| 29. | Farmington | 1.12% | 0.35%(+0.775)#34 | 0.25%(+0.875)#633 |
| 30. | Birmingham | 1.10% | 0.35%(+0.756)#35 | 0.25%(+0.856)#634 |
| 31. | Almont | 1.10% | 0.35%(+0.748)#36 | 0.25%(+0.849)#635 |
| 32. | Shoreham | 1.09% | 0.35%(+0.737)#37 | 0.25%(+0.838)#636 |
| 33. | Grosse Pointe | 1.07% | 0.35%(+0.719)#38 | 0.25%(+0.819)#637 |
| 34. | Brethren | 1.02% | 0.35%(+0.672)#39 | 0.25%(+0.772)#638 |
| 35. | Ferndale | 1.02% | 0.35%(+0.669)#58 | 0.25%(+0.769)#3,149 |
| 36. | Three Lakes | 1.01% | 0.35%(+0.662)#59 | 0.25%(+0.762)#3,150 |
| 37. | Center Line | 1.00% | 0.35%(+0.652)#60 | 0.25%(+0.753)#3,151 |
| 38. | Minden City | 0.99% | 0.35%(+0.637)#61 | 0.25%(+0.737)#3,152 |
| 39. | Gibraltar | 0.95% | 0.35%(+0.601)#62 | 0.25%(+0.701)#3,153 |
| 40. | Novi | 0.95% | 0.35%(+0.599)#63 | 0.25%(+0.699)#3,154 |
| 41. | Bellaire | 0.94% | 0.35%(+0.594)#64 | 0.25%(+0.694)#3,155 |
| 42. | Pinckney | 0.92% | 0.35%(+0.575)#65 | 0.25%(+0.675)#3,156 |
| 43. | Swartz Creek | 0.92% | 0.35%(+0.572)#66 | 0.25%(+0.673)#3,157 |
| 44. | Parma | 0.90% | 0.35%(+0.556)#67 | 0.25%(+0.657)#3,158 |
| 45. | Menominee | 0.90% | 0.35%(+0.553)#68 | 0.25%(+0.653)#3,159 |
| 46. | Rochester | 0.90% | 0.35%(+0.553)#69 | 0.25%(+0.653)#3,160 |
| 47. | Troy | 0.89% | 0.35%(+0.546)#70 | 0.25%(+0.647)#3,161 |
| 48. | Marlette | 0.89% | 0.35%(+0.542)#71 | 0.25%(+0.642)#3,162 |
| 49. | Wolverine Lake | 0.89% | 0.35%(+0.542)#72 | 0.25%(+0.642)#3,163 |
| 50. | Michigamme | 0.88% | 0.35%(+0.536)#73 | 0.25%(+0.637)#3,164 |
| 51. | Madison Heights | 0.88% | 0.35%(+0.535)#74 | 0.25%(+0.635)#3,165 |
| 52. | Plymouth | 0.88% | 0.35%(+0.533)#75 | 0.25%(+0.634)#3,166 |
| 53. | Lakeport | 0.88% | 0.35%(+0.529)#76 | 0.25%(+0.629)#3,167 |
| 54. | Lost Lake Woods | 0.87% | 0.35%(+0.521)#77 | 0.25%(+0.621)#3,168 |
| 55. | Bloomfield Hills | 0.86% | 0.35%(+0.515)#78 | 0.25%(+0.615)#3,169 |
| 56. | Belleville | 0.85% | 0.35%(+0.506)#79 | 0.25%(+0.606)#3,170 |
| 57. | Marysville | 0.83% | 0.35%(+0.484)#80 | 0.25%(+0.584)#3,171 |
| 58. | Port Huron | 0.81% | 0.35%(+0.458)#81 | 0.25%(+0.559)#3,172 |
| 59. | Pleasant Ridge | 0.80% | 0.35%(+0.456)#82 | 0.25%(+0.557)#3,173 |
| 60. | St Clair | 0.80% | 0.35%(+0.452)#83 | 0.25%(+0.552)#3,174 |
| 61. | Saugatuck | 0.80% | 0.35%(+0.450)#84 | 0.25%(+0.551)#3,175 |
| 62. | Horton Bay | 0.79% | 0.35%(+0.443)#85 | 0.25%(+0.543)#3,176 |
| 63. | Northville | 0.79% | 0.35%(+0.440)#86 | 0.25%(+0.540)#3,177 |
| 64. | Brimley | 0.79% | 0.35%(+0.437)#87 | 0.25%(+0.537)#3,178 |
| 65. | East Grand Rapids | 0.78% | 0.35%(+0.433)#88 | 0.25%(+0.534)#3,179 |
| 66. | Rochester Hills | 0.77% | 0.35%(+0.417)#89 | 0.25%(+0.517)#3,180 |
| 67. | Adrian | 0.76% | 0.35%(+0.413)#90 | 0.25%(+0.514)#3,181 |
| 68. | Springport | 0.76% | 0.35%(+0.412)#91 | 0.25%(+0.512)#3,182 |
| 69. | Royal Oak | 0.76% | 0.35%(+0.409)#92 | 0.25%(+0.510)#3,183 |
| 70. | Pearl Beach | 0.76% | 0.35%(+0.407)#93 | 0.25%(+0.508)#3,184 |
| 71. | Grosse Pointe Park | 0.73% | 0.35%(+0.381)#94 | 0.25%(+0.481)#3,185 |
| 72. | Ann Arbor | 0.73% | 0.35%(+0.378)#95 | 0.25%(+0.478)#3,186 |
| 73. | Eastlake | 0.71% | 0.35%(+0.363)#96 | 0.25%(+0.464)#3,187 |
| 74. | Brown City | 0.71% | 0.35%(+0.359)#97 | 0.25%(+0.459)#3,188 |
| 75. | Walled Lake | 0.70% | 0.35%(+0.354)#98 | 0.25%(+0.454)#3,189 |
| 76. | Sterling Heights | 0.69% | 0.35%(+0.345)#99 | 0.25%(+0.445)#3,190 |
| 77. | Farmington Hills | 0.69% | 0.35%(+0.343)#100 | 0.25%(+0.443)#3,191 |
| 78. | Fraser | 0.69% | 0.35%(+0.340)#101 | 0.25%(+0.440)#3,192 |
| 79. | Paw Paw Lake | 0.69% | 0.35%(+0.338)#102 | 0.25%(+0.438)#3,193 |
| 80. | Wyandotte | 0.68% | 0.35%(+0.327)#103 | 0.25%(+0.428)#3,194 |
| 81. | Spring Arbor | 0.66% | 0.35%(+0.315)#104 | 0.25%(+0.416)#3,195 |
| 82. | Clawson | 0.65% | 0.35%(+0.301)#105 | 0.25%(+0.402)#3,196 |
| 83. | Columbiaville | 0.65% | 0.35%(+0.297)#106 | 0.25%(+0.398)#3,197 |
| 84. | Huntington Woods | 0.64% | 0.35%(+0.296)#107 | 0.25%(+0.396)#3,198 |
| 85. | Orchard Lake Village | 0.64% | 0.35%(+0.292)#108 | 0.25%(+0.392)#3,199 |
| 86. | Southgate | 0.63% | 0.35%(+0.283)#109 | 0.25%(+0.383)#3,200 |
| 87. | Petersburg | 0.61% | 0.35%(+0.261)#110 | 0.25%(+0.362)#3,201 |
| 88. | Okemos | 0.61% | 0.35%(+0.258)#111 | 0.25%(+0.358)#3,202 |
| 89. | Webberville | 0.60% | 0.35%(+0.249)#112 | 0.25%(+0.350)#3,203 |
| 90. | Auburn Hills | 0.59% | 0.35%(+0.245)#113 | 0.25%(+0.345)#3,204 |
| 91. | Roseville | 0.59% | 0.35%(+0.241)#114 | 0.25%(+0.342)#3,205 |
| 92. | Ypsilanti | 0.58% | 0.35%(+0.236)#115 | 0.25%(+0.336)#3,206 |
| 93. | Baldwin | 0.58% | 0.35%(+0.234)#116 | 0.25%(+0.334)#3,207 |
| 94. | Perrinton | 0.58% | 0.35%(+0.232)#117 | 0.25%(+0.332)#3,208 |
| 95. | Dryden | 0.57% | 0.35%(+0.226)#118 | 0.25%(+0.327)#3,209 |
| 96. | Michigan Center | 0.57% | 0.35%(+0.222)#119 | 0.25%(+0.323)#3,210 |
| 97. | Dansville | 0.57% | 0.35%(+0.218)#120 | 0.25%(+0.318)#3,211 |
| 98. | St Clair Shores | 0.56% | 0.35%(+0.212)#121 | 0.25%(+0.313)#3,212 |
| 99. | Whitmore Lake | 0.56% | 0.35%(+0.208)#122 | 0.25%(+0.308)#3,213 |
| 100. | Houghton | 0.55% | 0.35%(+0.206)#123 | 0.25%(+0.306)#3,214 |
Common Questions
What are the Top 10 Cities with the Highest Percentage of Immigrants from Canada in Michigan?
Top 10 Cities with the Highest Percentage of Immigrants from Canada in Michigan are:
#1
6.00%
#2
4.05%
#3
3.12%
#4
2.95%
#5
2.44%
#6
2.28%
#7
2.20%
#8
1.89%
#9
1.88%
#10
1.82%
What city has the Highest Percentage of Immigrants from Canada in Michigan?
Copper Harbor has the Highest Percentage of Immigrants from Canada in Michigan with 6.00%.
What is the Percentage of Immigrants from Canada in the State of Michigan?
Percentage of Immigrants from Canada in Michigan is 0.35%.
What is the Percentage of Immigrants from Canada in the United States?
Percentage of Immigrants from Canada in the United States is 0.25%.