Cities with the Highest Percentage of Immigrants from Eastern Africa in Michigan
RELATED REPORTS & OPTIONS
Eastern Africa
Michigan
Compare Cities
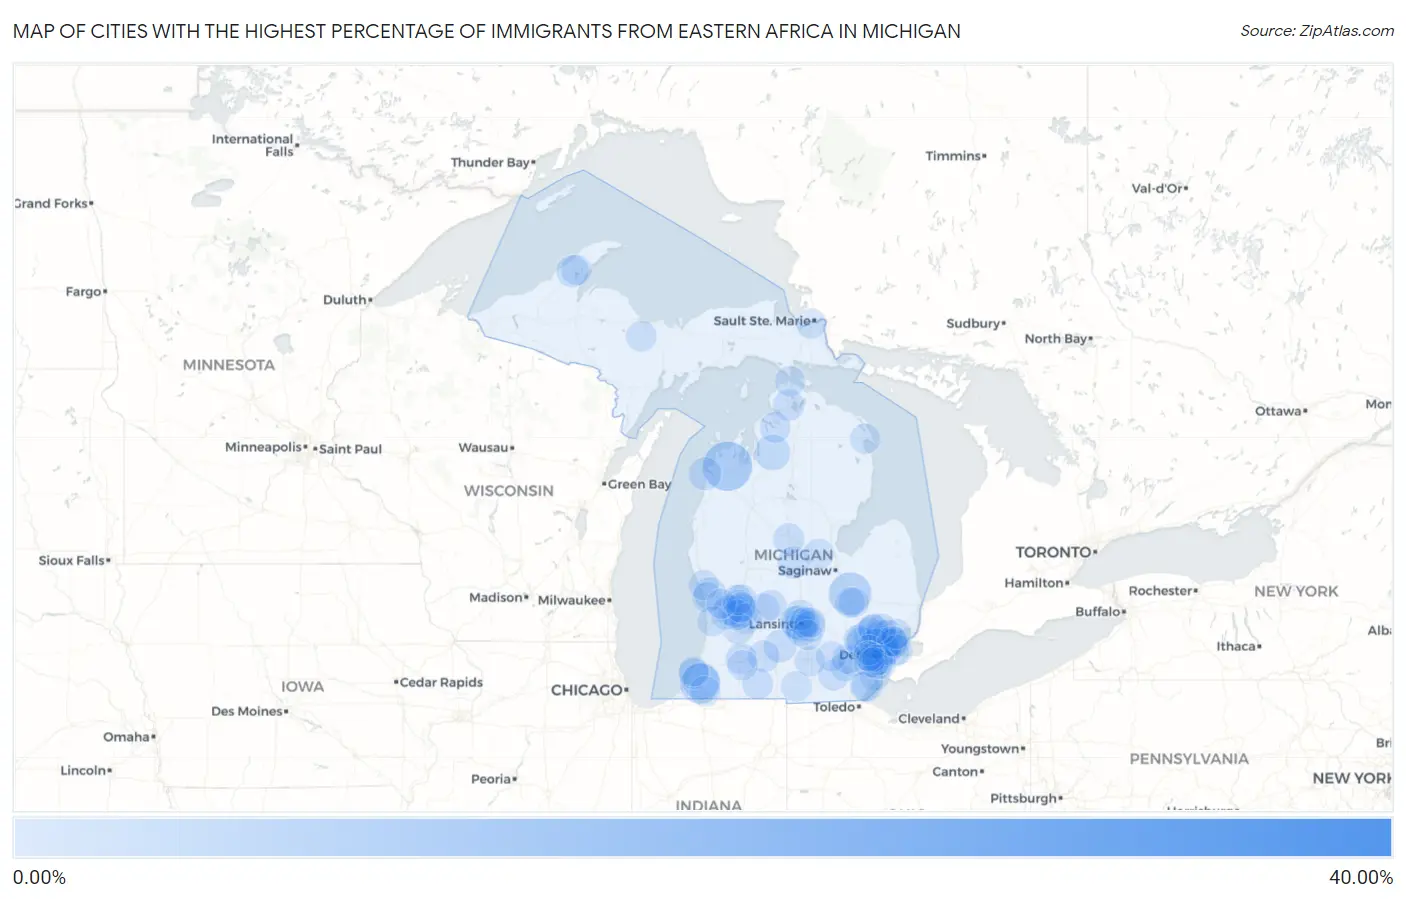
Map of Cities with the Highest Percentage of Immigrants from Eastern Africa in Michigan
0.00%
40.00%
Cities with the Highest Percentage of Immigrants from Eastern Africa in Michigan
| City | Eastern Africa | vs State | vs National | |
| 1. | Scotts | 32.97% | 0.11%(+32.9)#-1 | 0.23%(+32.7)#0 |
| 2. | Lake Ann | 7.80% | 0.11%(+7.69)#0 | 0.23%(+7.57)#1 |
| 3. | Mount Morris | 5.08% | 0.11%(+4.97)#1 | 0.23%(+4.86)#2 |
| 4. | Berrien Springs | 3.86% | 0.11%(+3.75)#2 | 0.23%(+3.63)#3 |
| 5. | Eau Claire | 2.81% | 0.11%(+2.70)#3 | 0.23%(+2.59)#4 |
| 6. | Mancelona | 2.22% | 0.11%(+2.11)#4 | 0.23%(+1.99)#5 |
| 7. | Edgemont Park | 1.68% | 0.11%(+1.57)#5 | 0.23%(+1.45)#6 |
| 8. | Kentwood | 1.28% | 0.11%(+1.17)#6 | 0.23%(+1.05)#7 |
| 9. | Frankfort | 1.09% | 0.11%(+0.977)#7 | 0.23%(+0.860)#8 |
| 10. | Olivet | 1.07% | 0.11%(+0.955)#8 | 0.23%(+0.838)#9 |
| 11. | Lansing | 1.04% | 0.11%(+0.926)#9 | 0.23%(+0.808)#10 |
| 12. | Waverly | 0.96% | 0.11%(+0.851)#10 | 0.23%(+0.734)#11 |
| 13. | Fruitport | 0.94% | 0.11%(+0.827)#11 | 0.23%(+0.709)#12 |
| 14. | Wyoming | 0.85% | 0.11%(+0.745)#24 | 0.23%(+0.628)#227 |
| 15. | Shepherd | 0.85% | 0.11%(+0.738)#25 | 0.23%(+0.621)#228 |
| 16. | Melvindale | 0.82% | 0.11%(+0.713)#26 | 0.23%(+0.596)#229 |
| 17. | Keego Harbor | 0.79% | 0.11%(+0.684)#27 | 0.23%(+0.567)#230 |
| 18. | Grand Rapids | 0.79% | 0.11%(+0.683)#28 | 0.23%(+0.566)#231 |
| 19. | Houghton | 0.75% | 0.11%(+0.637)#29 | 0.23%(+0.519)#232 |
| 20. | Battle Creek | 0.59% | 0.11%(+0.475)#30 | 0.23%(+0.358)#233 |
| 21. | Holt | 0.55% | 0.11%(+0.438)#31 | 0.23%(+0.321)#234 |
| 22. | Brutus | 0.47% | 0.11%(+0.364)#32 | 0.23%(+0.247)#235 |
| 23. | Clare | 0.45% | 0.11%(+0.335)#33 | 0.23%(+0.218)#236 |
| 24. | Kalamazoo | 0.44% | 0.11%(+0.330)#34 | 0.23%(+0.213)#237 |
| 25. | Highland Park | 0.41% | 0.11%(+0.300)#35 | 0.23%(+0.182)#299 |
| 26. | Saranac | 0.36% | 0.11%(+0.250)#36 | 0.23%(+0.132)#300 |
| 27. | Colon | 0.36% | 0.11%(+0.249)#37 | 0.23%(+0.132)#301 |
| 28. | South Rockwood | 0.34% | 0.11%(+0.234)#38 | 0.23%(+0.117)#302 |
| 29. | Okemos | 0.34% | 0.11%(+0.234)#39 | 0.23%(+0.117)#303 |
| 30. | Walled Lake | 0.34% | 0.11%(+0.234)#40 | 0.23%(+0.117)#304 |
| 31. | Boyne City | 0.31% | 0.11%(+0.204)#41 | 0.23%(+0.087)#305 |
| 32. | Clinton | 0.31% | 0.11%(+0.197)#42 | 0.23%(+0.080)#306 |
| 33. | Hudsonville | 0.29% | 0.11%(+0.178)#43 | 0.23%(+0.061)#307 |
| 34. | Northview | 0.28% | 0.11%(+0.169)#44 | 0.23%(+0.051)#308 |
| 35. | Caledonia | 0.28% | 0.11%(+0.167)#45 | 0.23%(+0.049)#309 |
| 36. | Dewitt | 0.27% | 0.11%(+0.162)#46 | 0.23%(+0.045)#310 |
| 37. | Jenison | 0.26% | 0.11%(+0.150)#47 | 0.23%(+0.033)#311 |
| 38. | Monroe | 0.26% | 0.11%(+0.150)#48 | 0.23%(+0.033)#312 |
| 39. | East Lansing | 0.26% | 0.11%(+0.145)#49 | 0.23%(+0.028)#313 |
| 40. | Oak Park | 0.25% | 0.11%(+0.137)#50 | 0.23%(+0.020)#314 |
| 41. | Ypsilanti | 0.24% | 0.11%(+0.133)#51 | 0.23%(+0.015)#315 |
| 42. | Farmington Hills | 0.22% | 0.11%(+0.114)#52 | 0.23%(-0.003)#320 |
| 43. | K I Sawyer | 0.21% | 0.11%(+0.102)#53 | 0.23%(-0.015)#321 |
| 44. | Wayland | 0.20% | 0.11%(+0.094)#54 | 0.23%(-0.023)#322 |
| 45. | Fair Plain | 0.20% | 0.11%(+0.093)#55 | 0.23%(-0.024)#323 |
| 46. | Hillsdale | 0.19% | 0.11%(+0.077)#56 | 0.23%(-0.040)#324 |
| 47. | Dollar Bay | 0.17% | 0.11%(+0.059)#57 | 0.23%(-0.058)#325 |
| 48. | Niles | 0.17% | 0.11%(+0.058)#58 | 0.23%(-0.059)#326 |
| 49. | Cutlerville | 0.16% | 0.11%(+0.051)#59 | 0.23%(-0.066)#327 |
| 50. | Ann Arbor | 0.16% | 0.11%(+0.050)#60 | 0.23%(-0.067)#328 |
| 51. | Dearborn | 0.16% | 0.11%(+0.046)#61 | 0.23%(-0.071)#329 |
| 52. | Mackinaw City | 0.15% | 0.11%(+0.043)#62 | 0.23%(-0.075)#330 |
| 53. | Novi | 0.15% | 0.11%(+0.042)#63 | 0.23%(-0.075)#331 |
| 54. | Birmingham | 0.15% | 0.11%(+0.037)#64 | 0.23%(-0.080)#332 |
| 55. | Comstock Park | 0.13% | 0.11%(+0.015)#65 | 0.23%(-0.102)#333 |
| 56. | Wixom | 0.12% | 0.11%(+0.013)#66 | 0.23%(-0.104)#334 |
| 57. | Troy | 0.10% | 0.11%(-0.006)#67 | 0.23%(-0.123)#335 |
| 58. | Alpena | 0.098% | 0.11%(-0.012)#68 | 0.23%(-0.129)#336 |
| 59. | Pontiac | 0.094% | 0.11%(-0.016)#69 | 0.23%(-0.134)#337 |
| 60. | Chelsea | 0.092% | 0.11%(-0.018)#70 | 0.23%(-0.135)#338 |
| 61. | Jackson | 0.089% | 0.11%(-0.021)#71 | 0.23%(-0.138)#339 |
| 62. | Dearborn Heights | 0.088% | 0.11%(-0.022)#72 | 0.23%(-0.139)#340 |
| 63. | Burton | 0.088% | 0.11%(-0.022)#73 | 0.23%(-0.139)#341 |
| 64. | Mason | 0.085% | 0.11%(-0.026)#74 | 0.23%(-0.143)#342 |
| 65. | Southgate | 0.080% | 0.11%(-0.030)#75 | 0.23%(-0.147)#343 |
| 66. | East Grand Rapids | 0.079% | 0.11%(-0.031)#76 | 0.23%(-0.148)#344 |
| 67. | Spring Lake | 0.079% | 0.11%(-0.031)#77 | 0.23%(-0.148)#345 |
| 68. | Grosse Pointe Park | 0.078% | 0.11%(-0.032)#78 | 0.23%(-0.149)#346 |
| 69. | Saline | 0.078% | 0.11%(-0.032)#79 | 0.23%(-0.149)#347 |
| 70. | Madison Heights | 0.070% | 0.11%(-0.040)#80 | 0.23%(-0.157)#348 |
| 71. | Sterling Heights | 0.068% | 0.11%(-0.042)#81 | 0.23%(-0.159)#349 |
| 72. | Detroit | 0.068% | 0.11%(-0.042)#82 | 0.23%(-0.159)#350 |
| 73. | Holland | 0.067% | 0.11%(-0.043)#83 | 0.23%(-0.160)#351 |
| 74. | Warren | 0.063% | 0.11%(-0.047)#84 | 0.23%(-0.164)#352 |
| 75. | Romulus | 0.060% | 0.11%(-0.050)#85 | 0.23%(-0.167)#353 |
| 76. | Portage | 0.057% | 0.11%(-0.053)#86 | 0.23%(-0.170)#354 |
| 77. | Eastpointe | 0.056% | 0.11%(-0.054)#87 | 0.23%(-0.171)#355 |
| 78. | Southfield | 0.053% | 0.11%(-0.057)#88 | 0.23%(-0.175)#356 |
| 79. | Grosse Pointe Farms | 0.050% | 0.11%(-0.060)#89 | 0.23%(-0.177)#357 |
| 80. | Muskegon | 0.047% | 0.11%(-0.063)#90 | 0.23%(-0.180)#358 |
| 81. | Hamtramck | 0.047% | 0.11%(-0.063)#91 | 0.23%(-0.181)#359 |
| 82. | Ionia | 0.046% | 0.11%(-0.064)#92 | 0.23%(-0.181)#360 |
| 83. | Benton Harbor | 0.044% | 0.11%(-0.066)#93 | 0.23%(-0.183)#361 |
| 84. | Wyandotte | 0.040% | 0.11%(-0.070)#94 | 0.23%(-0.187)#362 |
| 85. | St Clair Shores | 0.039% | 0.11%(-0.071)#95 | 0.23%(-0.188)#363 |
| 86. | Flint | 0.038% | 0.11%(-0.072)#96 | 0.23%(-0.189)#364 |
| 87. | Allen Park | 0.035% | 0.11%(-0.075)#97 | 0.23%(-0.192)#365 |
| 88. | West Monroe | 0.035% | 0.11%(-0.075)#98 | 0.23%(-0.193)#366 |
| 89. | Mount Clemens | 0.032% | 0.11%(-0.078)#99 | 0.23%(-0.195)#367 |
| 90. | Allendale | 0.024% | 0.11%(-0.086)#100 | 0.23%(-0.203)#368 |
| 91. | Rochester Hills | 0.024% | 0.11%(-0.086)#101 | 0.23%(-0.204)#369 |
| 92. | Midland | 0.024% | 0.11%(-0.086)#102 | 0.23%(-0.204)#370 |
| 93. | Inkster | 0.023% | 0.11%(-0.087)#103 | 0.23%(-0.204)#371 |
| 94. | Haslett | 0.021% | 0.11%(-0.089)#104 | 0.23%(-0.206)#372 |
| 95. | Livonia | 0.018% | 0.11%(-0.092)#105 | 0.23%(-0.209)#373 |
| 96. | Auburn Hills | 0.016% | 0.11%(-0.094)#106 | 0.23%(-0.211)#374 |
| 97. | Roseville | 0.015% | 0.11%(-0.095)#107 | 0.23%(-0.212)#375 |
| 98. | Taylor | 0.013% | 0.11%(-0.097)#108 | 0.23%(-0.215)#376 |
| 99. | Sault Ste Marie | 0.0075% | 0.11%(-0.103)#109 | 0.23%(-0.220)#377 |
| 100. | Westland | 0.0047% | 0.11%(-0.105)#110 | 0.23%(-0.223)#378 |
Common Questions
What are the Top 10 Cities with the Highest Percentage of Immigrants from Eastern Africa in Michigan?
Top 10 Cities with the Highest Percentage of Immigrants from Eastern Africa in Michigan are:
#1
7.80%
#2
5.08%
#3
3.86%
#4
2.81%
#5
2.22%
#6
1.68%
#7
1.28%
#8
1.09%
#9
1.07%
#10
1.04%
What city has the Highest Percentage of Immigrants from Eastern Africa in Michigan?
Lake Ann has the Highest Percentage of Immigrants from Eastern Africa in Michigan with 7.80%.
What is the Percentage of Immigrants from Eastern Africa in the State of Michigan?
Percentage of Immigrants from Eastern Africa in Michigan is 0.11%.
What is the Percentage of Immigrants from Eastern Africa in the United States?
Percentage of Immigrants from Eastern Africa in the United States is 0.23%.