Cities with the Most Immigrants from Austria in Michigan
RELATED REPORTS & OPTIONS
Austria
Michigan
Compare Cities
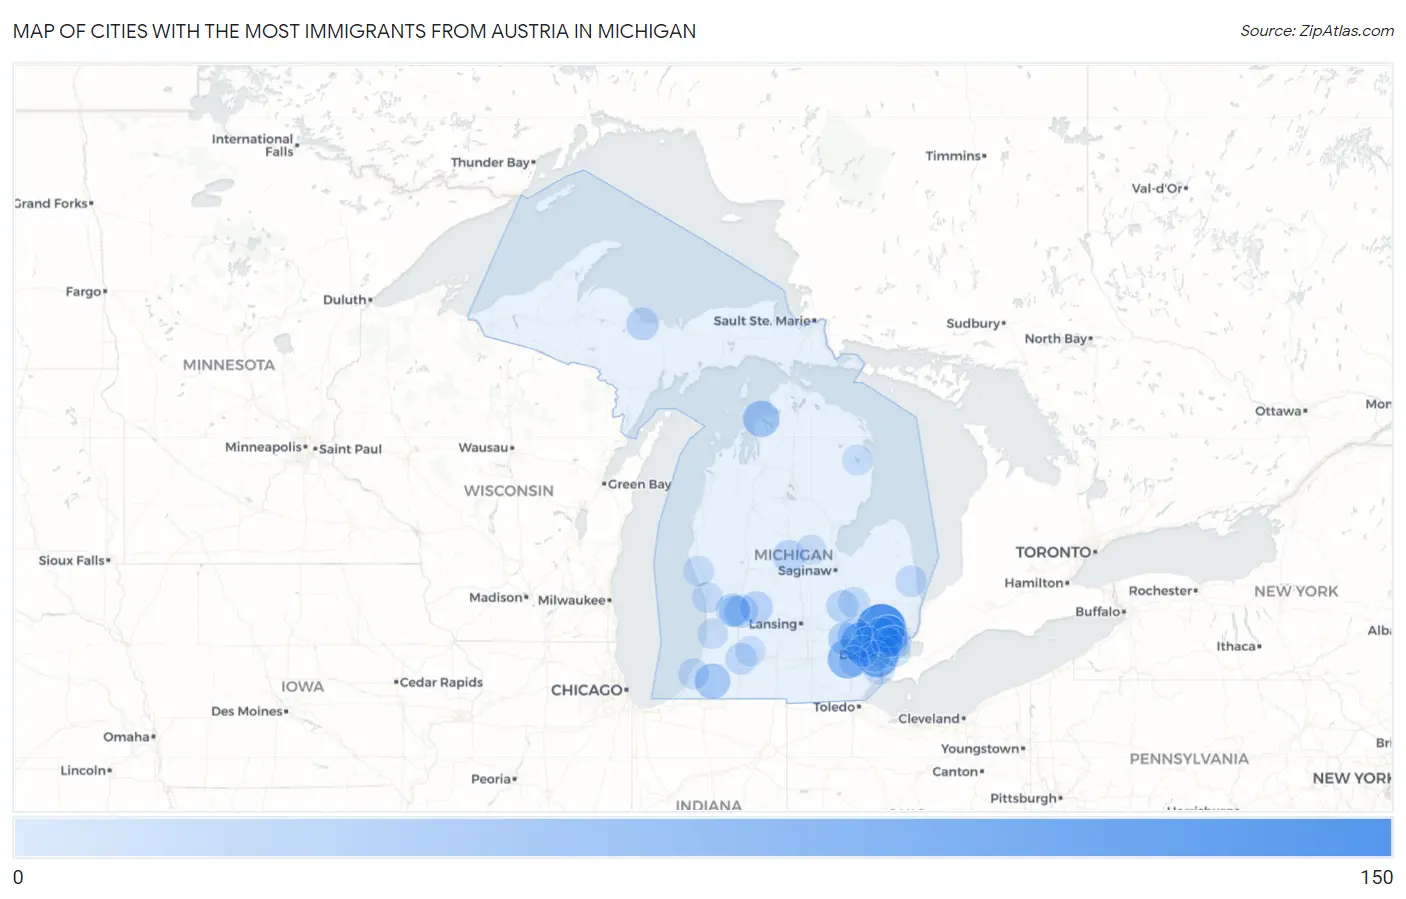
Map of Cities with the Most Immigrants from Austria in Michigan
0
150
Cities with the Most Immigrants from Austria in Michigan
| City | Austria | vs State | vs National | |
| 1. | Rochester Hills | 115 | 1,144(10.05%)#1 | 39,066(0.29%)#25 |
| 2. | Dearborn | 69 | 1,144(6.03%)#2 | 39,066(0.18%)#57 |
| 3. | Novi | 59 | 1,144(5.16%)#3 | 39,066(0.15%)#79 |
| 4. | Sterling Heights | 57 | 1,144(4.98%)#4 | 39,066(0.15%)#83 |
| 5. | Ann Arbor | 55 | 1,144(4.81%)#5 | 39,066(0.14%)#87 |
| 6. | Charlevoix | 36 | 1,144(3.15%)#6 | 39,066(0.09%)#201 |
| 7. | Dowagiac | 31 | 1,144(2.71%)#7 | 39,066(0.08%)#240 |
| 8. | Troy | 28 | 1,144(2.45%)#8 | 39,066(0.07%)#265 |
| 9. | Milford | 22 | 1,144(1.92%)#9 | 39,066(0.06%)#359 |
| 10. | Brighton | 21 | 1,144(1.84%)#10 | 39,066(0.05%)#378 |
| 11. | Kentwood | 18 | 1,144(1.57%)#11 | 39,066(0.05%)#439 |
| 12. | Grandville | 18 | 1,144(1.57%)#12 | 39,066(0.05%)#453 |
| 13. | Lowell | 16 | 1,144(1.40%)#13 | 39,066(0.04%)#517 |
| 14. | Harvey | 15 | 1,144(1.31%)#14 | 39,066(0.04%)#561 |
| 15. | St Clair Shores | 14 | 1,144(1.22%)#15 | 39,066(0.04%)#578 |
| 16. | Mount Pleasant | 13 | 1,144(1.14%)#16 | 39,066(0.03%)#623 |
| 17. | Swartz Creek | 13 | 1,144(1.14%)#17 | 39,066(0.03%)#644 |
| 18. | Detroit | 11 | 1,144(0.96%)#18 | 39,066(0.03%)#701 |
| 19. | Kalamazoo | 10 | 1,144(0.87%)#19 | 39,066(0.03%)#763 |
| 20. | Wyoming | 9 | 1,144(0.79%)#20 | 39,066(0.02%)#820 |
| 21. | Croswell | 9 | 1,144(0.79%)#21 | 39,066(0.02%)#872 |
| 22. | Farmington Hills | 8 | 1,144(0.70%)#22 | 39,066(0.02%)#884 |
| 23. | Burton | 8 | 1,144(0.70%)#23 | 39,066(0.02%)#901 |
| 24. | Trenton | 8 | 1,144(0.70%)#24 | 39,066(0.02%)#914 |
| 25. | Grosse Pointe | 8 | 1,144(0.70%)#25 | 39,066(0.02%)#930 |
| 26. | Utica | 8 | 1,144(0.70%)#26 | 39,066(0.02%)#934 |
| 27. | Roseville | 7 | 1,144(0.61%)#27 | 39,066(0.02%)#968 |
| 28. | Plymouth | 7 | 1,144(0.61%)#28 | 39,066(0.02%)#996 |
| 29. | Fair Plain | 7 | 1,144(0.61%)#29 | 39,066(0.02%)#1,002 |
| 30. | Dearborn Heights | 5 | 1,144(0.44%)#30 | 39,066(0.01%)#1,090 |
| 31. | Spring Lake | 5 | 1,144(0.44%)#31 | 39,066(0.01%)#1,116 |
| 32. | Montague | 4 | 1,144(0.35%)#32 | 39,066(0.01%)#1,156 |
| 33. | Warren | 3 | 1,144(0.26%)#33 | 39,066(0.01%)#1,170 |
| 34. | Ypsilanti | 3 | 1,144(0.26%)#34 | 39,066(0.01%)#1,177 |
| 35. | Fennville | 3 | 1,144(0.26%)#35 | 39,066(0.01%)#1,186 |
| 36. | Hubbard Lake | 3 | 1,144(0.26%)#36 | 39,066(0.01%)#1,200 |
| 37. | Sanford | 3 | 1,144(0.26%)#37 | 39,066(0.01%)#1,206 |
| 38. | Richland | 2 | 1,144(0.17%)#38 | 39,066(0.01%)#1,237 |
Common Questions
What are the Top 10 Cities with the Most Immigrants from Austria in Michigan?
Top 10 Cities with the Most Immigrants from Austria in Michigan are:
#1
115
#2
69
#3
59
#4
57
#5
55
#6
36
#7
31
#8
28
#9
22
#10
21
What city has the Most Immigrants from Austria in Michigan?
Rochester Hills has the Most Immigrants from Austria in Michigan with 115.
What is the Total Immigrants from Austria in the State of Michigan?
Total Immigrants from Austria in Michigan is 1,144.
What is the Total Immigrants from Austria in the United States?
Total Immigrants from Austria in the United States is 39,066.