Cities with the Highest Percentage of Population Employed in Food Preparation & Serving in Michigan
RELATED REPORTS & OPTIONS
Food Preparation & Serving
Michigan
Compare Cities
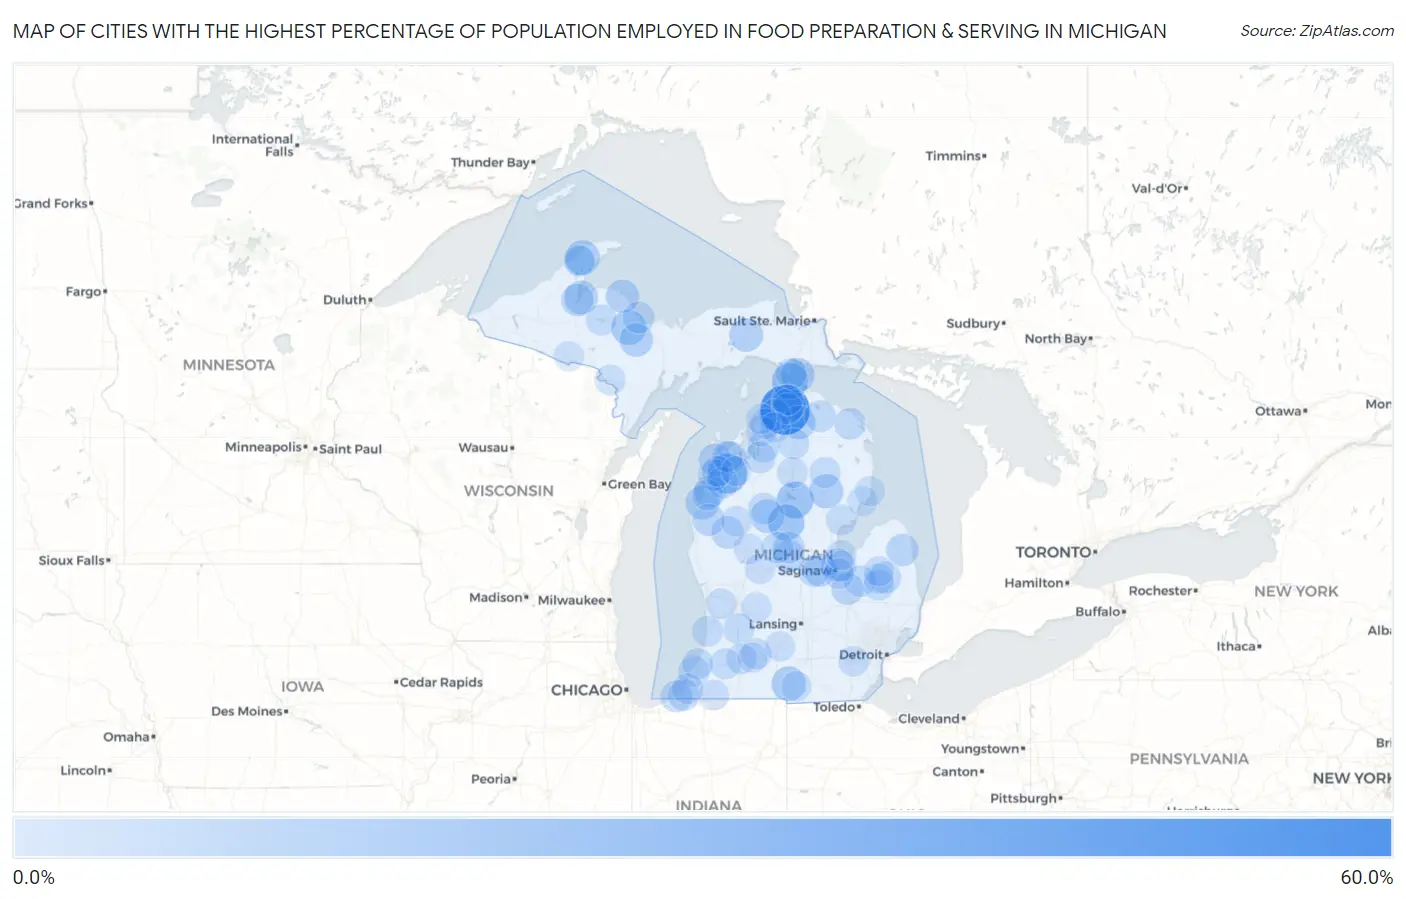
Map of Cities with the Highest Percentage of Population Employed in Food Preparation & Serving in Michigan
0.0%
60.0%
Cities with the Highest Percentage of Population Employed in Food Preparation & Serving in Michigan
| City | % Employed | vs State | vs National | |
| 1. | Oden | 51.4% | 5.7%(+45.8)#1 | 5.3%(+46.1)#103 |
| 2. | Bendon | 30.4% | 5.7%(+24.8)#2 | 5.3%(+25.1)#336 |
| 3. | Prudenville | 24.4% | 5.7%(+18.7)#3 | 5.3%(+19.1)#533 |
| 4. | Mackinaw City | 23.5% | 5.7%(+17.9)#4 | 5.3%(+18.2)#577 |
| 5. | Harrison | 23.5% | 5.7%(+17.8)#5 | 5.3%(+18.2)#584 |
| 6. | Riverdale | 22.2% | 5.7%(+16.5)#6 | 5.3%(+16.9)#661 |
| 7. | Palmer | 20.6% | 5.7%(+15.0)#7 | 5.3%(+15.3)#770 |
| 8. | Copper City | 20.0% | 5.7%(+14.3)#8 | 5.3%(+14.7)#838 |
| 9. | Allen | 20.0% | 5.7%(+14.3)#9 | 5.3%(+14.7)#839 |
| 10. | Mackinac Island | 19.0% | 5.7%(+13.4)#10 | 5.3%(+13.7)#943 |
| 11. | Rose City | 19.0% | 5.7%(+13.3)#11 | 5.3%(+13.7)#951 |
| 12. | Brutus | 18.9% | 5.7%(+13.2)#12 | 5.3%(+13.6)#959 |
| 13. | Parkdale | 18.7% | 5.7%(+13.0)#13 | 5.3%(+13.4)#987 |
| 14. | Wolverine | 18.3% | 5.7%(+12.6)#14 | 5.3%(+13.0)#1,032 |
| 15. | Marion | 18.1% | 5.7%(+12.4)#15 | 5.3%(+12.8)#1,053 |
| 16. | Pittsford | 18.0% | 5.7%(+12.4)#16 | 5.3%(+12.7)#1,063 |
| 17. | Newberry | 18.0% | 5.7%(+12.3)#17 | 5.3%(+12.7)#1,070 |
| 18. | Zeba | 17.9% | 5.7%(+12.2)#18 | 5.3%(+12.6)#1,086 |
| 19. | Gwinn | 17.7% | 5.7%(+12.0)#19 | 5.3%(+12.4)#1,099 |
| 20. | Big Bay | 17.4% | 5.7%(+11.7)#20 | 5.3%(+12.1)#1,145 |
| 21. | Hemlock | 17.2% | 5.7%(+11.5)#21 | 5.3%(+11.9)#1,186 |
| 22. | Zilwaukee | 16.2% | 5.7%(+10.6)#22 | 5.3%(+11.0)#1,344 |
| 23. | Empire | 16.2% | 5.7%(+10.5)#23 | 5.3%(+10.9)#1,349 |
| 24. | Baraga | 15.8% | 5.7%(+10.1)#24 | 5.3%(+10.5)#1,455 |
| 25. | Minden City | 15.6% | 5.7%(+9.95)#25 | 5.3%(+10.3)#1,486 |
| 26. | Baldwin | 15.6% | 5.7%(+9.93)#26 | 5.3%(+10.3)#1,493 |
| 27. | Clio | 15.5% | 5.7%(+9.83)#27 | 5.3%(+10.2)#1,505 |
| 28. | Mount Pleasant | 15.3% | 5.7%(+9.66)#28 | 5.3%(+10.0)#1,547 |
| 29. | Bear Lake | 15.1% | 5.7%(+9.42)#29 | 5.3%(+9.81)#1,603 |
| 30. | Brimley | 15.1% | 5.7%(+9.40)#30 | 5.3%(+9.78)#1,607 |
| 31. | Cedar | 15.0% | 5.7%(+9.33)#31 | 5.3%(+9.71)#1,634 |
| 32. | Fountain | 14.9% | 5.7%(+9.19)#32 | 5.3%(+9.58)#1,670 |
| 33. | New Buffalo | 14.7% | 5.7%(+8.98)#33 | 5.3%(+9.37)#1,718 |
| 34. | Bellaire | 14.7% | 5.7%(+8.98)#34 | 5.3%(+9.37)#1,719 |
| 35. | Marlette | 14.6% | 5.7%(+8.95)#35 | 5.3%(+9.33)#1,729 |
| 36. | Marquette | 14.6% | 5.7%(+8.94)#36 | 5.3%(+9.33)#1,732 |
| 37. | Rosebush | 14.5% | 5.7%(+8.79)#37 | 5.3%(+9.17)#1,777 |
| 38. | Tower | 14.4% | 5.7%(+8.73)#38 | 5.3%(+9.11)#1,792 |
| 39. | Petoskey | 14.3% | 5.7%(+8.68)#39 | 5.3%(+9.06)#1,803 |
| 40. | Posen | 14.1% | 5.7%(+8.44)#40 | 5.3%(+8.83)#1,877 |
| 41. | Three Oaks | 14.1% | 5.7%(+8.44)#41 | 5.3%(+8.82)#1,879 |
| 42. | Thompsonville | 13.9% | 5.7%(+8.24)#42 | 5.3%(+8.63)#1,933 |
| 43. | Weidman | 13.9% | 5.7%(+8.19)#43 | 5.3%(+8.57)#1,952 |
| 44. | Onaway | 13.8% | 5.7%(+8.11)#44 | 5.3%(+8.49)#1,977 |
| 45. | Millington | 13.8% | 5.7%(+8.08)#45 | 5.3%(+8.47)#1,984 |
| 46. | Benzonia | 13.7% | 5.7%(+8.05)#46 | 5.3%(+8.43)#1,997 |
| 47. | Rapid City | 13.6% | 5.7%(+7.89)#47 | 5.3%(+8.27)#2,048 |
| 48. | St Ignace | 13.4% | 5.7%(+7.75)#48 | 5.3%(+8.13)#2,093 |
| 49. | Mcbain | 13.4% | 5.7%(+7.74)#49 | 5.3%(+8.13)#2,099 |
| 50. | Maple City | 13.0% | 5.7%(+7.37)#50 | 5.3%(+7.76)#2,241 |
| 51. | Wayland | 13.0% | 5.7%(+7.35)#51 | 5.3%(+7.73)#2,252 |
| 52. | Douglas | 13.0% | 5.7%(+7.32)#52 | 5.3%(+7.71)#2,261 |
| 53. | Benton Harbor | 13.0% | 5.7%(+7.32)#53 | 5.3%(+7.70)#2,262 |
| 54. | Paw Paw | 12.8% | 5.7%(+7.16)#54 | 5.3%(+7.55)#2,331 |
| 55. | Mio | 12.8% | 5.7%(+7.13)#55 | 5.3%(+7.52)#2,346 |
| 56. | Merrill | 12.8% | 5.7%(+7.10)#56 | 5.3%(+7.49)#2,358 |
| 57. | Gaylord | 12.8% | 5.7%(+7.08)#57 | 5.3%(+7.47)#2,369 |
| 58. | Alanson | 12.7% | 5.7%(+7.06)#58 | 5.3%(+7.45)#2,386 |
| 59. | North Branch | 12.7% | 5.7%(+7.05)#59 | 5.3%(+7.44)#2,389 |
| 60. | Lake Michigan Beach | 12.7% | 5.7%(+7.03)#60 | 5.3%(+7.42)#2,402 |
| 61. | Michigamme | 12.7% | 5.7%(+7.00)#61 | 5.3%(+7.39)#2,414 |
| 62. | Onekama | 12.7% | 5.7%(+6.98)#62 | 5.3%(+7.36)#2,424 |
| 63. | New Troy | 12.6% | 5.7%(+6.93)#63 | 5.3%(+7.32)#2,436 |
| 64. | Grayling | 12.6% | 5.7%(+6.92)#64 | 5.3%(+7.31)#2,443 |
| 65. | Augusta | 12.5% | 5.7%(+6.83)#65 | 5.3%(+7.21)#2,482 |
| 66. | Omer | 12.5% | 5.7%(+6.83)#66 | 5.3%(+7.21)#2,497 |
| 67. | Allendale | 12.5% | 5.7%(+6.79)#67 | 5.3%(+7.18)#2,535 |
| 68. | Kalamazoo | 12.4% | 5.7%(+6.74)#68 | 5.3%(+7.13)#2,556 |
| 69. | Pellston | 12.4% | 5.7%(+6.70)#69 | 5.3%(+7.09)#2,573 |
| 70. | Robin Glen Indiantown | 12.1% | 5.7%(+6.40)#70 | 5.3%(+6.79)#2,717 |
| 71. | Ypsilanti | 12.1% | 5.7%(+6.40)#71 | 5.3%(+6.78)#2,721 |
| 72. | Honor | 12.1% | 5.7%(+6.40)#72 | 5.3%(+6.78)#2,722 |
| 73. | Luther | 12.0% | 5.7%(+6.36)#73 | 5.3%(+6.75)#2,735 |
| 74. | Calumet | 12.0% | 5.7%(+6.36)#74 | 5.3%(+6.75)#2,737 |
| 75. | Norway | 12.0% | 5.7%(+6.31)#75 | 5.3%(+6.70)#2,774 |
| 76. | Cambria | 11.9% | 5.7%(+6.25)#76 | 5.3%(+6.64)#2,812 |
| 77. | Edwardsburg | 11.9% | 5.7%(+6.25)#77 | 5.3%(+6.63)#2,815 |
| 78. | Lowell | 11.9% | 5.7%(+6.24)#78 | 5.3%(+6.63)#2,818 |
| 79. | Ellsworth | 11.7% | 5.7%(+6.03)#79 | 5.3%(+6.42)#2,942 |
| 80. | Cannonsburg | 11.7% | 5.7%(+5.98)#80 | 5.3%(+6.36)#2,971 |
| 81. | Big Rapids | 11.6% | 5.7%(+5.97)#81 | 5.3%(+6.36)#2,978 |
| 82. | Galesburg | 11.6% | 5.7%(+5.97)#82 | 5.3%(+6.35)#2,981 |
| 83. | Bridgeport | 11.6% | 5.7%(+5.91)#83 | 5.3%(+6.29)#3,020 |
| 84. | Hillsdale | 11.5% | 5.7%(+5.87)#84 | 5.3%(+6.25)#3,041 |
| 85. | Ironton | 11.5% | 5.7%(+5.87)#85 | 5.3%(+6.25)#3,049 |
| 86. | Boyne City | 11.5% | 5.7%(+5.83)#86 | 5.3%(+6.22)#3,065 |
| 87. | Olivet | 11.5% | 5.7%(+5.79)#87 | 5.3%(+6.17)#3,091 |
| 88. | Ewen | 11.4% | 5.7%(+5.71)#88 | 5.3%(+6.10)#3,142 |
| 89. | Lakeview | 11.4% | 5.7%(+5.70)#89 | 5.3%(+6.09)#3,148 |
| 90. | Laurium | 11.4% | 5.7%(+5.69)#90 | 5.3%(+6.07)#3,159 |
| 91. | Charlevoix | 11.3% | 5.7%(+5.64)#91 | 5.3%(+6.03)#3,191 |
| 92. | Rapid River | 11.3% | 5.7%(+5.59)#92 | 5.3%(+5.98)#3,217 |
| 93. | East Tawas | 11.2% | 5.7%(+5.57)#93 | 5.3%(+5.95)#3,235 |
| 94. | Clifford | 11.2% | 5.7%(+5.53)#94 | 5.3%(+5.92)#3,259 |
| 95. | Grawn | 11.2% | 5.7%(+5.53)#95 | 5.3%(+5.91)#3,265 |
| 96. | Kingston | 11.2% | 5.7%(+5.51)#96 | 5.3%(+5.89)#3,276 |
| 97. | Essexville | 11.1% | 5.7%(+5.39)#97 | 5.3%(+5.77)#3,354 |
| 98. | Iron River | 11.1% | 5.7%(+5.38)#98 | 5.3%(+5.77)#3,357 |
| 99. | Oscoda | 11.0% | 5.7%(+5.37)#99 | 5.3%(+5.75)#3,369 |
| 100. | Grand Marais | 11.0% | 5.7%(+5.29)#100 | 5.3%(+5.67)#3,417 |
Common Questions
What are the Top 10 Cities with the Highest Percentage of Population Employed in Food Preparation & Serving in Michigan?
Top 10 Cities with the Highest Percentage of Population Employed in Food Preparation & Serving in Michigan are:
#1
51.4%
#2
30.4%
#3
24.4%
#4
23.5%
#5
23.5%
#6
20.6%
#7
20.0%
#8
20.0%
#9
19.0%
#10
19.0%
What city has the Highest Percentage of Population Employed in Food Preparation & Serving in Michigan?
Oden has the Highest Percentage of Population Employed in Food Preparation & Serving in Michigan with 51.4%.
What is the Percentage of Population Employed in Food Preparation & Serving in the State of Michigan?
Percentage of Population Employed in Food Preparation & Serving in Michigan is 5.7%.
What is the Percentage of Population Employed in Food Preparation & Serving in the United States?
Percentage of Population Employed in Food Preparation & Serving in the United States is 5.3%.