Cities with the Most Immigrants from South Eastern Asia in Michigan
RELATED REPORTS & OPTIONS
South Eastern Asia
Michigan
Compare Cities
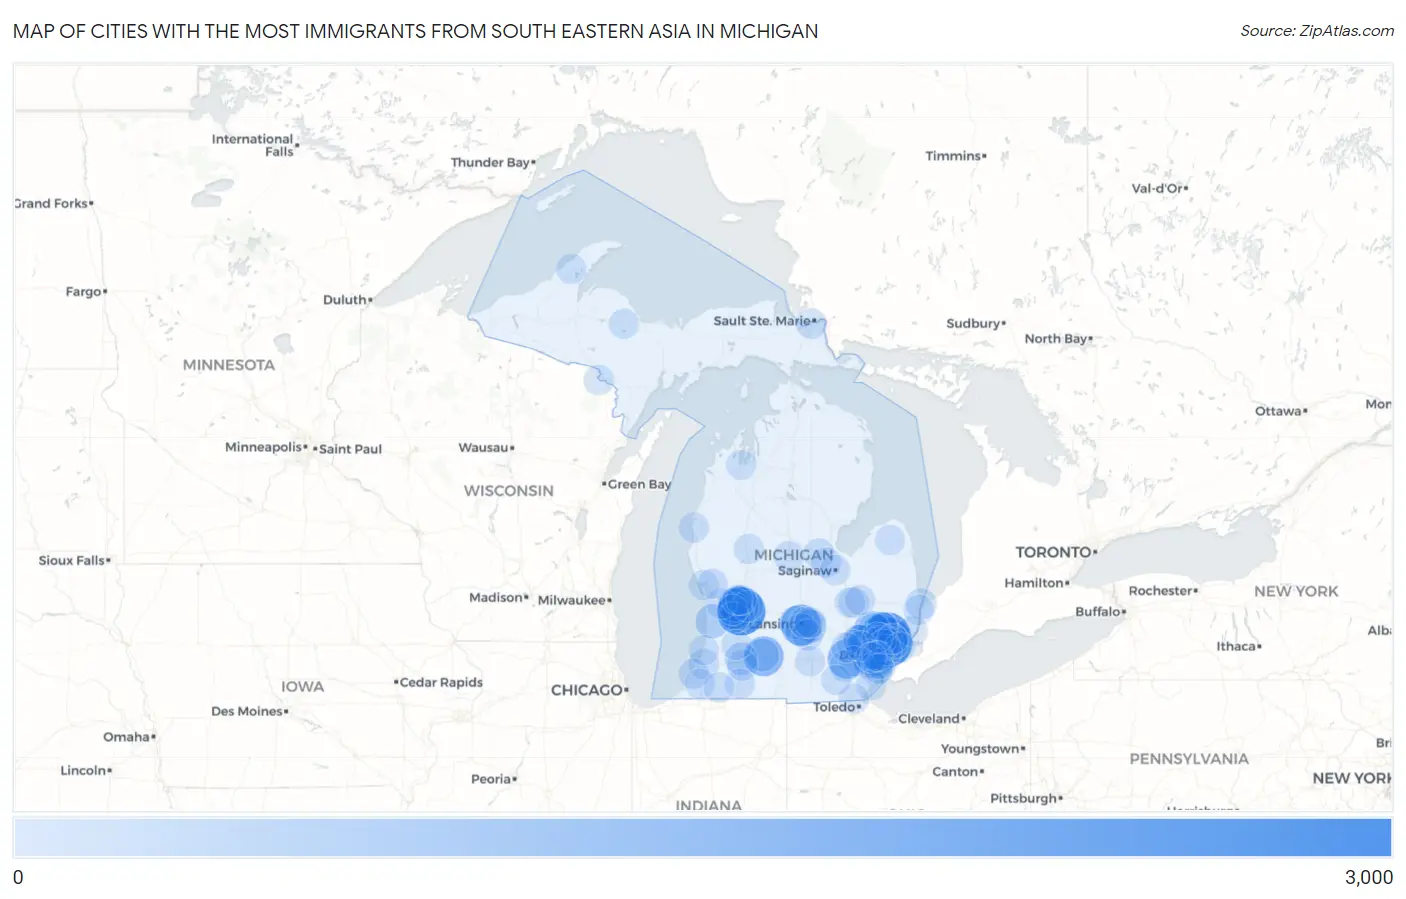
Map of Cities with the Most Immigrants from South Eastern Asia in Michigan
0
3,000
Cities with the Most Immigrants from South Eastern Asia in Michigan
| City | South Eastern Asia | vs State | vs National | |
| 1. | Warren | 2,527 | 46,834(5.40%)#1 | 4,292,058(0.06%)#248 |
| 2. | Kentwood | 2,357 | 46,834(5.03%)#2 | 4,292,058(0.05%)#266 |
| 3. | Sterling Heights | 1,950 | 46,834(4.16%)#3 | 4,292,058(0.05%)#323 |
| 4. | Lansing | 1,390 | 46,834(2.97%)#4 | 4,292,058(0.03%)#452 |
| 5. | Troy | 1,316 | 46,834(2.81%)#5 | 4,292,058(0.03%)#475 |
| 6. | Grand Rapids | 1,269 | 46,834(2.71%)#6 | 4,292,058(0.03%)#491 |
| 7. | Battle Creek | 1,240 | 46,834(2.65%)#7 | 4,292,058(0.03%)#495 |
| 8. | Ann Arbor | 1,222 | 46,834(2.61%)#8 | 4,292,058(0.03%)#503 |
| 9. | Livonia | 939 | 46,834(2.00%)#9 | 4,292,058(0.02%)#636 |
| 10. | Pontiac | 924 | 46,834(1.97%)#10 | 4,292,058(0.02%)#645 |
| 11. | Westland | 797 | 46,834(1.70%)#11 | 4,292,058(0.02%)#742 |
| 12. | Wyoming | 764 | 46,834(1.63%)#12 | 4,292,058(0.02%)#765 |
| 13. | Farmington Hills | 750 | 46,834(1.60%)#13 | 4,292,058(0.02%)#776 |
| 14. | Novi | 733 | 46,834(1.57%)#14 | 4,292,058(0.02%)#788 |
| 15. | Detroit | 679 | 46,834(1.45%)#15 | 4,292,058(0.02%)#847 |
| 16. | Rochester Hills | 557 | 46,834(1.19%)#16 | 4,292,058(0.01%)#971 |
| 17. | Holland | 514 | 46,834(1.10%)#17 | 4,292,058(0.01%)#1,019 |
| 18. | Cutlerville | 466 | 46,834(1.00%)#18 | 4,292,058(0.01%)#1,080 |
| 19. | Walker | 461 | 46,834(0.98%)#19 | 4,292,058(0.01%)#1,089 |
| 20. | Waverly | 437 | 46,834(0.93%)#20 | 4,292,058(0.01%)#1,142 |
| 21. | Okemos | 435 | 46,834(0.93%)#21 | 4,292,058(0.01%)#1,146 |
| 22. | Springfield | 391 | 46,834(0.83%)#22 | 4,292,058(0.01%)#1,257 |
| 23. | Holt | 382 | 46,834(0.82%)#23 | 4,292,058(0.01%)#1,280 |
| 24. | Oak Park | 363 | 46,834(0.78%)#24 | 4,292,058(0.01%)#1,340 |
| 25. | Madison Heights | 353 | 46,834(0.75%)#25 | 4,292,058(0.01%)#1,370 |
| 26. | Kalamazoo | 339 | 46,834(0.72%)#26 | 4,292,058(0.01%)#1,414 |
| 27. | Roseville | 328 | 46,834(0.70%)#27 | 4,292,058(0.01%)#1,444 |
| 28. | Southfield | 297 | 46,834(0.63%)#28 | 4,292,058(0.01%)#1,559 |
| 29. | Taylor | 177 | 46,834(0.38%)#29 | 4,292,058(0.00%)#2,173 |
| 30. | Auburn Hills | 175 | 46,834(0.37%)#30 | 4,292,058(0.00%)#2,190 |
| 31. | St Clair Shores | 160 | 46,834(0.34%)#31 | 4,292,058(0.00%)#2,335 |
| 32. | Allen Park | 159 | 46,834(0.34%)#32 | 4,292,058(0.00%)#2,342 |
| 33. | Romulus | 156 | 46,834(0.33%)#33 | 4,292,058(0.00%)#2,374 |
| 34. | Portage | 140 | 46,834(0.30%)#34 | 4,292,058(0.00%)#2,562 |
| 35. | Lincoln Park | 139 | 46,834(0.30%)#35 | 4,292,058(0.00%)#2,570 |
| 36. | Byron Center | 137 | 46,834(0.29%)#36 | 4,292,058(0.00%)#2,606 |
| 37. | Forest Hills | 133 | 46,834(0.28%)#37 | 4,292,058(0.00%)#2,642 |
| 38. | Saline | 133 | 46,834(0.28%)#38 | 4,292,058(0.00%)#2,648 |
| 39. | Woodhaven | 130 | 46,834(0.28%)#39 | 4,292,058(0.00%)#2,684 |
| 40. | Mason | 129 | 46,834(0.28%)#40 | 4,292,058(0.00%)#2,705 |
| 41. | Eastpointe | 127 | 46,834(0.27%)#41 | 4,292,058(0.00%)#2,727 |
| 42. | Midland | 123 | 46,834(0.26%)#42 | 4,292,058(0.00%)#2,776 |
| 43. | Royal Oak | 122 | 46,834(0.26%)#43 | 4,292,058(0.00%)#2,785 |
| 44. | Southgate | 122 | 46,834(0.26%)#44 | 4,292,058(0.00%)#2,787 |
| 45. | Walled Lake | 120 | 46,834(0.26%)#45 | 4,292,058(0.00%)#2,823 |
| 46. | Port Huron | 119 | 46,834(0.25%)#46 | 4,292,058(0.00%)#2,828 |
| 47. | Wixom | 107 | 46,834(0.23%)#47 | 4,292,058(0.00%)#3,007 |
| 48. | East Lansing | 104 | 46,834(0.22%)#48 | 4,292,058(0.00%)#3,042 |
| 49. | Center Line | 104 | 46,834(0.22%)#49 | 4,292,058(0.00%)#3,054 |
| 50. | Sault Ste Marie | 101 | 46,834(0.22%)#50 | 4,292,058(0.00%)#3,103 |
| 51. | Garden City | 98 | 46,834(0.21%)#51 | 4,292,058(0.00%)#3,149 |
| 52. | Haslett | 95 | 46,834(0.20%)#52 | 4,292,058(0.00%)#3,196 |
| 53. | Clawson | 93 | 46,834(0.20%)#53 | 4,292,058(0.00%)#3,238 |
| 54. | Hamtramck | 86 | 46,834(0.18%)#54 | 4,292,058(0.00%)#3,352 |
| 55. | Hazel Park | 82 | 46,834(0.18%)#55 | 4,292,058(0.00%)#3,430 |
| 56. | Allendale | 79 | 46,834(0.17%)#56 | 4,292,058(0.00%)#3,492 |
| 57. | Mount Pleasant | 77 | 46,834(0.16%)#57 | 4,292,058(0.00%)#3,537 |
| 58. | Burton | 68 | 46,834(0.15%)#58 | 4,292,058(0.00%)#3,727 |
| 59. | Paw Paw Lake | 68 | 46,834(0.15%)#59 | 4,292,058(0.00%)#3,746 |
| 60. | Wyandotte | 67 | 46,834(0.14%)#60 | 4,292,058(0.00%)#3,754 |
| 61. | Rochester | 66 | 46,834(0.14%)#61 | 4,292,058(0.00%)#3,781 |
| 62. | Fair Plain | 65 | 46,834(0.14%)#62 | 4,292,058(0.00%)#3,809 |
| 63. | South Lyon | 63 | 46,834(0.13%)#63 | 4,292,058(0.00%)#3,853 |
| 64. | Flint | 62 | 46,834(0.13%)#64 | 4,292,058(0.00%)#3,876 |
| 65. | Woodland Beach | 62 | 46,834(0.13%)#65 | 4,292,058(0.00%)#3,903 |
| 66. | Pearl Beach | 55 | 46,834(0.12%)#66 | 4,292,058(0.00%)#4,094 |
| 67. | Village Of Grosse Pointe Shores | 55 | 46,834(0.12%)#67 | 4,292,058(0.00%)#4,101 |
| 68. | Ypsilanti | 53 | 46,834(0.11%)#68 | 4,292,058(0.00%)#4,142 |
| 69. | Grandville | 52 | 46,834(0.11%)#69 | 4,292,058(0.00%)#4,193 |
| 70. | Northville | 51 | 46,834(0.11%)#70 | 4,292,058(0.00%)#4,235 |
| 71. | Hancock | 51 | 46,834(0.11%)#71 | 4,292,058(0.00%)#4,239 |
| 72. | Dearborn Heights | 48 | 46,834(0.10%)#72 | 4,292,058(0.00%)#4,336 |
| 73. | Muskegon | 48 | 46,834(0.10%)#73 | 4,292,058(0.00%)#4,337 |
| 74. | Big Rapids | 47 | 46,834(0.10%)#74 | 4,292,058(0.00%)#4,391 |
| 75. | Fraser | 45 | 46,834(0.10%)#75 | 4,292,058(0.00%)#4,455 |
| 76. | Freeland | 45 | 46,834(0.10%)#76 | 4,292,058(0.00%)#4,475 |
| 77. | Kingsford | 45 | 46,834(0.10%)#77 | 4,292,058(0.00%)#4,483 |
| 78. | Trenton | 44 | 46,834(0.09%)#78 | 4,292,058(0.00%)#4,499 |
| 79. | South Haven | 44 | 46,834(0.09%)#79 | 4,292,058(0.00%)#4,536 |
| 80. | Three Rivers | 43 | 46,834(0.09%)#80 | 4,292,058(0.00%)#4,562 |
| 81. | Otsego | 42 | 46,834(0.09%)#81 | 4,292,058(0.00%)#4,623 |
| 82. | Marysville | 41 | 46,834(0.09%)#82 | 4,292,058(0.00%)#4,653 |
| 83. | Lambertville | 41 | 46,834(0.09%)#83 | 4,292,058(0.00%)#4,654 |
| 84. | Jackson | 40 | 46,834(0.09%)#84 | 4,292,058(0.00%)#4,704 |
| 85. | Berrien Springs | 40 | 46,834(0.09%)#85 | 4,292,058(0.00%)#4,751 |
| 86. | Birmingham | 38 | 46,834(0.08%)#86 | 4,292,058(0.00%)#4,820 |
| 87. | Whitmore Lake | 38 | 46,834(0.08%)#87 | 4,292,058(0.00%)#4,834 |
| 88. | Ludington | 38 | 46,834(0.08%)#88 | 4,292,058(0.00%)#4,836 |
| 89. | Bad Axe | 37 | 46,834(0.08%)#89 | 4,292,058(0.00%)#4,894 |
| 90. | Saginaw | 36 | 46,834(0.08%)#90 | 4,292,058(0.00%)#4,906 |
| 91. | Comstock Park | 36 | 46,834(0.08%)#91 | 4,292,058(0.00%)#4,918 |
| 92. | Ishpeming | 35 | 46,834(0.07%)#92 | 4,292,058(0.00%)#4,977 |
| 93. | Davison | 35 | 46,834(0.07%)#93 | 4,292,058(0.00%)#4,982 |
| 94. | Wolf Lake | 35 | 46,834(0.07%)#94 | 4,292,058(0.00%)#4,988 |
| 95. | Cassopolis | 35 | 46,834(0.07%)#95 | 4,292,058(0.00%)#5,000 |
| 96. | Traverse City | 34 | 46,834(0.07%)#96 | 4,292,058(0.00%)#5,012 |
| 97. | Inkster | 33 | 46,834(0.07%)#97 | 4,292,058(0.00%)#5,061 |
| 98. | Northview | 33 | 46,834(0.07%)#98 | 4,292,058(0.00%)#5,065 |
| 99. | Dearborn | 32 | 46,834(0.07%)#99 | 4,292,058(0.00%)#5,119 |
| 100. | Tecumseh | 32 | 46,834(0.07%)#100 | 4,292,058(0.00%)#5,138 |
Common Questions
What are the Top 10 Cities with the Most Immigrants from South Eastern Asia in Michigan?
Top 10 Cities with the Most Immigrants from South Eastern Asia in Michigan are:
#1
2,527
#2
2,357
#3
1,950
#4
1,390
#5
1,316
#6
1,269
#7
1,240
#8
1,222
#9
939
#10
924
What city has the Most Immigrants from South Eastern Asia in Michigan?
Warren has the Most Immigrants from South Eastern Asia in Michigan with 2,527.
What is the Total Immigrants from South Eastern Asia in the State of Michigan?
Total Immigrants from South Eastern Asia in Michigan is 46,834.
What is the Total Immigrants from South Eastern Asia in the United States?
Total Immigrants from South Eastern Asia in the United States is 4,292,058.