Cities with the Highest Percentage of Population Employed in Firefighting & Prevention in Michigan
RELATED REPORTS & OPTIONS
Firefighting & Prevention
Michigan
Compare Cities
Map of Cities with the Highest Percentage of Population Employed in Firefighting & Prevention in Michigan
0.0%
25.0%
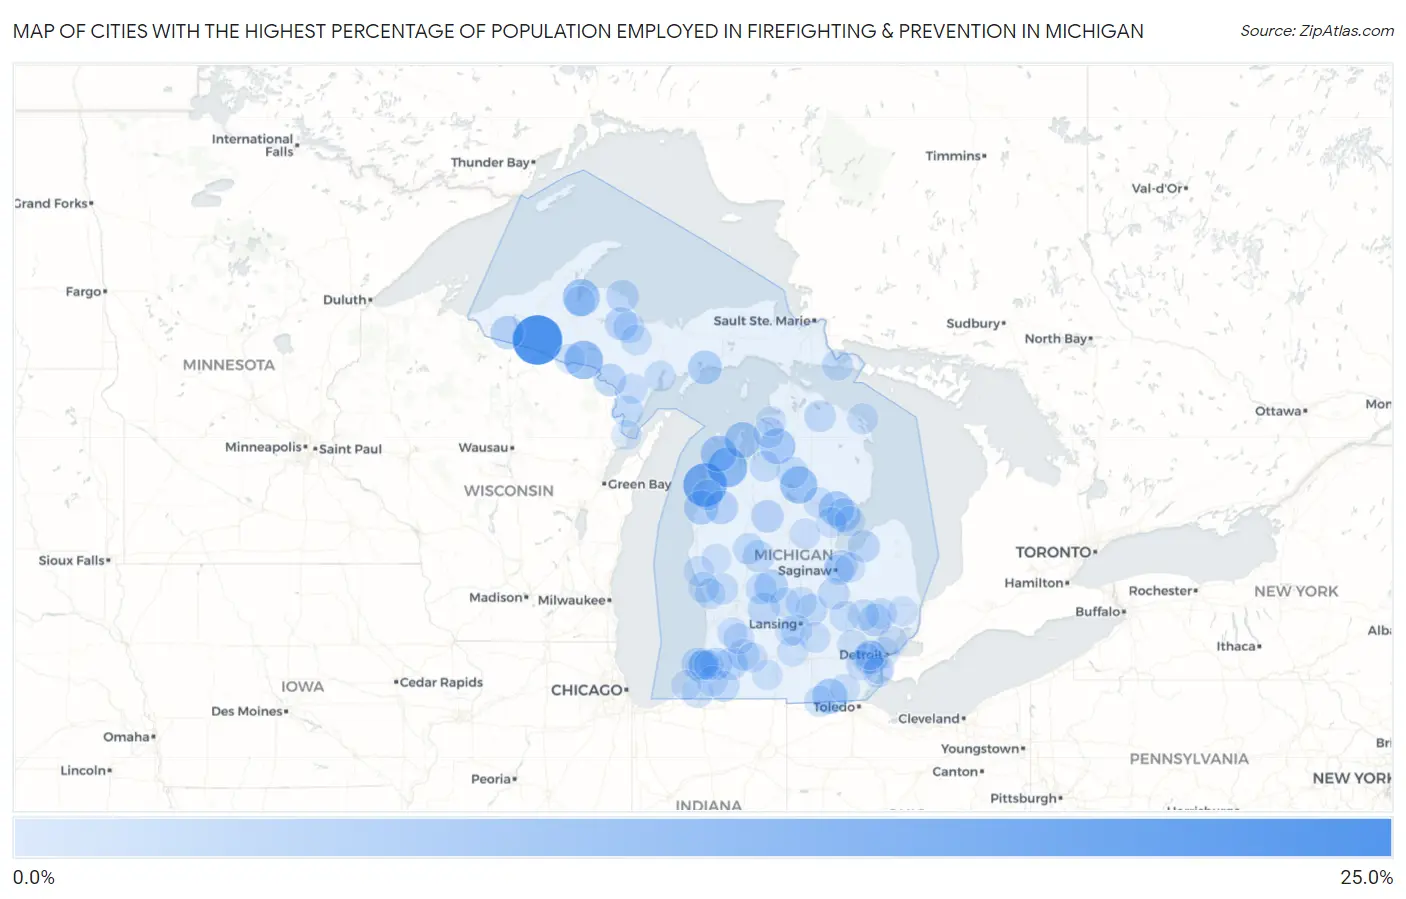
Cities with the Highest Percentage of Population Employed in Firefighting & Prevention in Michigan
| City | % Employed | vs State | vs National | |
| 1. | Watersmeet | 22.7% | 0.89%(+21.8)#1 | 1.2%(+21.5)#93 |
| 2. | Arcadia | 15.9% | 0.89%(+15.0)#2 | 1.2%(+14.7)#179 |
| 3. | Maple Grove | 11.7% | 0.89%(+10.8)#3 | 1.2%(+10.5)#329 |
| 4. | Bruce Crossing | 11.5% | 0.89%(+10.7)#4 | 1.2%(+10.4)#338 |
| 5. | Alpha | 10.6% | 0.89%(+9.75)#5 | 1.2%(+9.45)#385 |
| 6. | Tower | 9.6% | 0.89%(+8.71)#6 | 1.2%(+8.41)#452 |
| 7. | Roscommon | 9.2% | 0.89%(+8.36)#7 | 1.2%(+8.06)#476 |
| 8. | Zeba | 8.9% | 0.89%(+8.04)#8 | 1.2%(+7.74)#515 |
| 9. | Glen Arbor | 8.0% | 0.89%(+7.08)#9 | 1.2%(+6.78)#624 |
| 10. | Omena | 7.7% | 0.89%(+6.81)#10 | 1.2%(+6.51)#658 |
| 11. | Alba | 7.5% | 0.89%(+6.57)#11 | 1.2%(+6.27)#690 |
| 12. | Jasper | 7.0% | 0.89%(+6.07)#12 | 1.2%(+5.77)#768 |
| 13. | Prescott | 6.9% | 0.89%(+6.01)#13 | 1.2%(+5.71)#776 |
| 14. | Oak Hill | 6.1% | 0.89%(+5.19)#14 | 1.2%(+4.89)#936 |
| 15. | Mass | 5.7% | 0.89%(+4.83)#15 | 1.2%(+4.53)#1,037 |
| 16. | Manistique | 5.7% | 0.89%(+4.80)#16 | 1.2%(+4.50)#1,047 |
| 17. | Twining | 5.5% | 0.89%(+4.59)#17 | 1.2%(+4.29)#1,110 |
| 18. | Wellston | 5.3% | 0.89%(+4.45)#18 | 1.2%(+4.15)#1,154 |
| 19. | Sheridan | 5.2% | 0.89%(+4.36)#19 | 1.2%(+4.06)#1,191 |
| 20. | Marenisco | 5.2% | 0.89%(+4.31)#20 | 1.2%(+4.01)#1,204 |
| 21. | Kincheloe | 5.1% | 0.89%(+4.17)#21 | 1.2%(+3.87)#1,253 |
| 22. | Inkster | 4.7% | 0.89%(+3.81)#22 | 1.2%(+3.51)#1,405 |
| 23. | Lake Orion | 4.6% | 0.89%(+3.69)#23 | 1.2%(+3.38)#1,459 |
| 24. | West Ishpeming | 4.6% | 0.89%(+3.68)#24 | 1.2%(+3.37)#1,464 |
| 25. | Marion | 4.5% | 0.89%(+3.64)#25 | 1.2%(+3.34)#1,490 |
| 26. | Norway | 4.5% | 0.89%(+3.62)#26 | 1.2%(+3.32)#1,503 |
| 27. | Big Bay | 4.3% | 0.89%(+3.46)#27 | 1.2%(+3.16)#1,586 |
| 28. | Mattawan | 4.2% | 0.89%(+3.29)#28 | 1.2%(+2.99)#1,681 |
| 29. | Robin Glen Indiantown | 4.2% | 0.89%(+3.27)#29 | 1.2%(+2.97)#1,699 |
| 30. | Lake Michigan Beach | 4.1% | 0.89%(+3.21)#30 | 1.2%(+2.91)#1,726 |
| 31. | Sebewaing | 4.0% | 0.89%(+3.14)#31 | 1.2%(+2.84)#1,780 |
| 32. | Saranac | 4.0% | 0.89%(+3.13)#32 | 1.2%(+2.82)#1,788 |
| 33. | Lawrence | 4.0% | 0.89%(+3.11)#33 | 1.2%(+2.81)#1,792 |
| 34. | Canadian Lakes | 3.7% | 0.89%(+2.83)#34 | 1.2%(+2.53)#1,997 |
| 35. | Ruby | 3.6% | 0.89%(+2.75)#35 | 1.2%(+2.45)#2,083 |
| 36. | Lake Victoria | 3.6% | 0.89%(+2.73)#36 | 1.2%(+2.43)#2,104 |
| 37. | Onaway | 3.5% | 0.89%(+2.65)#37 | 1.2%(+2.35)#2,170 |
| 38. | Parchment | 3.5% | 0.89%(+2.59)#38 | 1.2%(+2.29)#2,231 |
| 39. | New Lothrop | 3.4% | 0.89%(+2.54)#39 | 1.2%(+2.24)#2,281 |
| 40. | Greenville | 3.4% | 0.89%(+2.47)#40 | 1.2%(+2.17)#2,358 |
| 41. | Coloma | 3.3% | 0.89%(+2.44)#41 | 1.2%(+2.14)#2,391 |
| 42. | Big Rapids | 3.3% | 0.89%(+2.37)#42 | 1.2%(+2.07)#2,468 |
| 43. | Grayling | 3.2% | 0.89%(+2.31)#43 | 1.2%(+2.01)#2,543 |
| 44. | Palmer | 3.2% | 0.89%(+2.29)#44 | 1.2%(+1.99)#2,561 |
| 45. | Ravenna | 3.1% | 0.89%(+2.26)#45 | 1.2%(+1.96)#2,589 |
| 46. | Paw Paw Lake | 3.1% | 0.89%(+2.20)#46 | 1.2%(+1.90)#2,649 |
| 47. | Stephenson | 3.1% | 0.89%(+2.18)#47 | 1.2%(+1.88)#2,686 |
| 48. | St Johns | 3.0% | 0.89%(+2.11)#48 | 1.2%(+1.81)#2,785 |
| 49. | Roosevelt Park | 3.0% | 0.89%(+2.07)#49 | 1.2%(+1.77)#2,842 |
| 50. | Morenci | 3.0% | 0.89%(+2.07)#50 | 1.2%(+1.76)#2,852 |
| 51. | Leonard | 2.9% | 0.89%(+2.06)#51 | 1.2%(+1.76)#2,867 |
| 52. | Kalkaska | 2.9% | 0.89%(+2.01)#52 | 1.2%(+1.71)#2,912 |
| 53. | Buchanan | 2.9% | 0.89%(+2.00)#53 | 1.2%(+1.70)#2,926 |
| 54. | Ortonville | 2.9% | 0.89%(+1.98)#54 | 1.2%(+1.68)#2,954 |
| 55. | Vandalia | 2.8% | 0.89%(+1.96)#55 | 1.2%(+1.66)#2,984 |
| 56. | Dimondale | 2.8% | 0.89%(+1.89)#56 | 1.2%(+1.59)#3,086 |
| 57. | East Jordan | 2.8% | 0.89%(+1.87)#57 | 1.2%(+1.56)#3,120 |
| 58. | De Tour Village | 2.7% | 0.89%(+1.85)#58 | 1.2%(+1.55)#3,135 |
| 59. | Presque Isle Harbor | 2.6% | 0.89%(+1.76)#59 | 1.2%(+1.46)#3,276 |
| 60. | Linden | 2.6% | 0.89%(+1.73)#60 | 1.2%(+1.43)#3,321 |
| 61. | Gladstone | 2.6% | 0.89%(+1.72)#61 | 1.2%(+1.42)#3,346 |
| 62. | Dansville | 2.6% | 0.89%(+1.71)#62 | 1.2%(+1.41)#3,374 |
| 63. | Detroit | 2.5% | 0.89%(+1.61)#63 | 1.2%(+1.31)#3,580 |
| 64. | Martin | 2.5% | 0.89%(+1.57)#64 | 1.2%(+1.27)#3,634 |
| 65. | Fruitport | 2.4% | 0.89%(+1.53)#65 | 1.2%(+1.23)#3,719 |
| 66. | Onekama | 2.4% | 0.89%(+1.52)#66 | 1.2%(+1.22)#3,733 |
| 67. | West Branch | 2.4% | 0.89%(+1.51)#67 | 1.2%(+1.21)#3,751 |
| 68. | Wayne | 2.4% | 0.89%(+1.51)#68 | 1.2%(+1.21)#3,768 |
| 69. | Buena Vista | 2.4% | 0.89%(+1.51)#69 | 1.2%(+1.20)#3,776 |
| 70. | Gwinn | 2.4% | 0.89%(+1.49)#70 | 1.2%(+1.19)#3,804 |
| 71. | Sterling | 2.3% | 0.89%(+1.42)#71 | 1.2%(+1.12)#3,966 |
| 72. | Whitehall | 2.3% | 0.89%(+1.42)#72 | 1.2%(+1.12)#3,968 |
| 73. | L Anse | 2.3% | 0.89%(+1.41)#73 | 1.2%(+1.11)#3,981 |
| 74. | Beaverton | 2.3% | 0.89%(+1.40)#74 | 1.2%(+1.10)#3,998 |
| 75. | South Lyon | 2.3% | 0.89%(+1.39)#75 | 1.2%(+1.09)#4,021 |
| 76. | Belleville | 2.2% | 0.89%(+1.34)#76 | 1.2%(+1.04)#4,134 |
| 77. | Dowagiac | 2.2% | 0.89%(+1.34)#77 | 1.2%(+1.04)#4,135 |
| 78. | Hopkins | 2.2% | 0.89%(+1.30)#78 | 1.2%(+1.00)#4,226 |
| 79. | Union City | 2.2% | 0.89%(+1.27)#79 | 1.2%(+0.965)#4,315 |
| 80. | Powers | 2.2% | 0.89%(+1.27)#80 | 1.2%(+0.965)#4,317 |
| 81. | Rapid River | 2.1% | 0.89%(+1.23)#81 | 1.2%(+0.927)#4,422 |
| 82. | Au Gres | 2.1% | 0.89%(+1.17)#82 | 1.2%(+0.869)#4,569 |
| 83. | Gibraltar | 2.0% | 0.89%(+1.15)#83 | 1.2%(+0.848)#4,629 |
| 84. | Reese | 2.0% | 0.89%(+1.11)#84 | 1.2%(+0.814)#4,730 |
| 85. | Memphis | 2.0% | 0.89%(+1.10)#85 | 1.2%(+0.803)#4,777 |
| 86. | Trenton | 2.0% | 0.89%(+1.10)#86 | 1.2%(+0.802)#4,779 |
| 87. | Menominee | 2.0% | 0.89%(+1.10)#87 | 1.2%(+0.795)#4,804 |
| 88. | Springport | 2.0% | 0.89%(+1.09)#88 | 1.2%(+0.792)#4,825 |
| 89. | Watervliet | 1.9% | 0.89%(+1.05)#89 | 1.2%(+0.754)#4,927 |
| 90. | Horton Bay | 1.9% | 0.89%(+1.05)#90 | 1.2%(+0.750)#4,940 |
| 91. | Gaastra | 1.9% | 0.89%(+1.04)#91 | 1.2%(+0.737)#4,974 |
| 92. | Pewamo | 1.9% | 0.89%(+1.02)#92 | 1.2%(+0.719)#5,040 |
| 93. | Galesburg | 1.9% | 0.89%(+1.02)#93 | 1.2%(+0.714)#5,055 |
| 94. | Hartford | 1.9% | 0.89%(+1.01)#94 | 1.2%(+0.709)#5,067 |
| 95. | Garden City | 1.9% | 0.89%(+0.998)#95 | 1.2%(+0.697)#5,108 |
| 96. | Roseville | 1.9% | 0.89%(+0.986)#96 | 1.2%(+0.685)#5,150 |
| 97. | Hesperia | 1.9% | 0.89%(+0.972)#97 | 1.2%(+0.672)#5,192 |
| 98. | Deerfield | 1.8% | 0.89%(+0.955)#98 | 1.2%(+0.655)#5,254 |
| 99. | Potterville | 1.8% | 0.89%(+0.947)#99 | 1.2%(+0.646)#5,283 |
| 100. | Bridgman | 1.8% | 0.89%(+0.940)#100 | 1.2%(+0.639)#5,309 |
Common Questions
What are the Top 10 Cities with the Highest Percentage of Population Employed in Firefighting & Prevention in Michigan?
Top 10 Cities with the Highest Percentage of Population Employed in Firefighting & Prevention in Michigan are:
#1
22.7%
#2
15.9%
#3
11.7%
#4
10.6%
#5
9.2%
#6
8.9%
#7
8.0%
#8
7.7%
#9
7.5%
#10
7.0%
What city has the Highest Percentage of Population Employed in Firefighting & Prevention in Michigan?
Watersmeet has the Highest Percentage of Population Employed in Firefighting & Prevention in Michigan with 22.7%.
What is the Percentage of Population Employed in Firefighting & Prevention in the State of Michigan?
Percentage of Population Employed in Firefighting & Prevention in Michigan is 0.89%.
What is the Percentage of Population Employed in Firefighting & Prevention in the United States?
Percentage of Population Employed in Firefighting & Prevention in the United States is 1.2%.