Cities with the Lowest Male Poverty Level in Michigan
RELATED REPORTS & OPTIONS
Lowest Poverty | Male
Michigan
Compare Cities
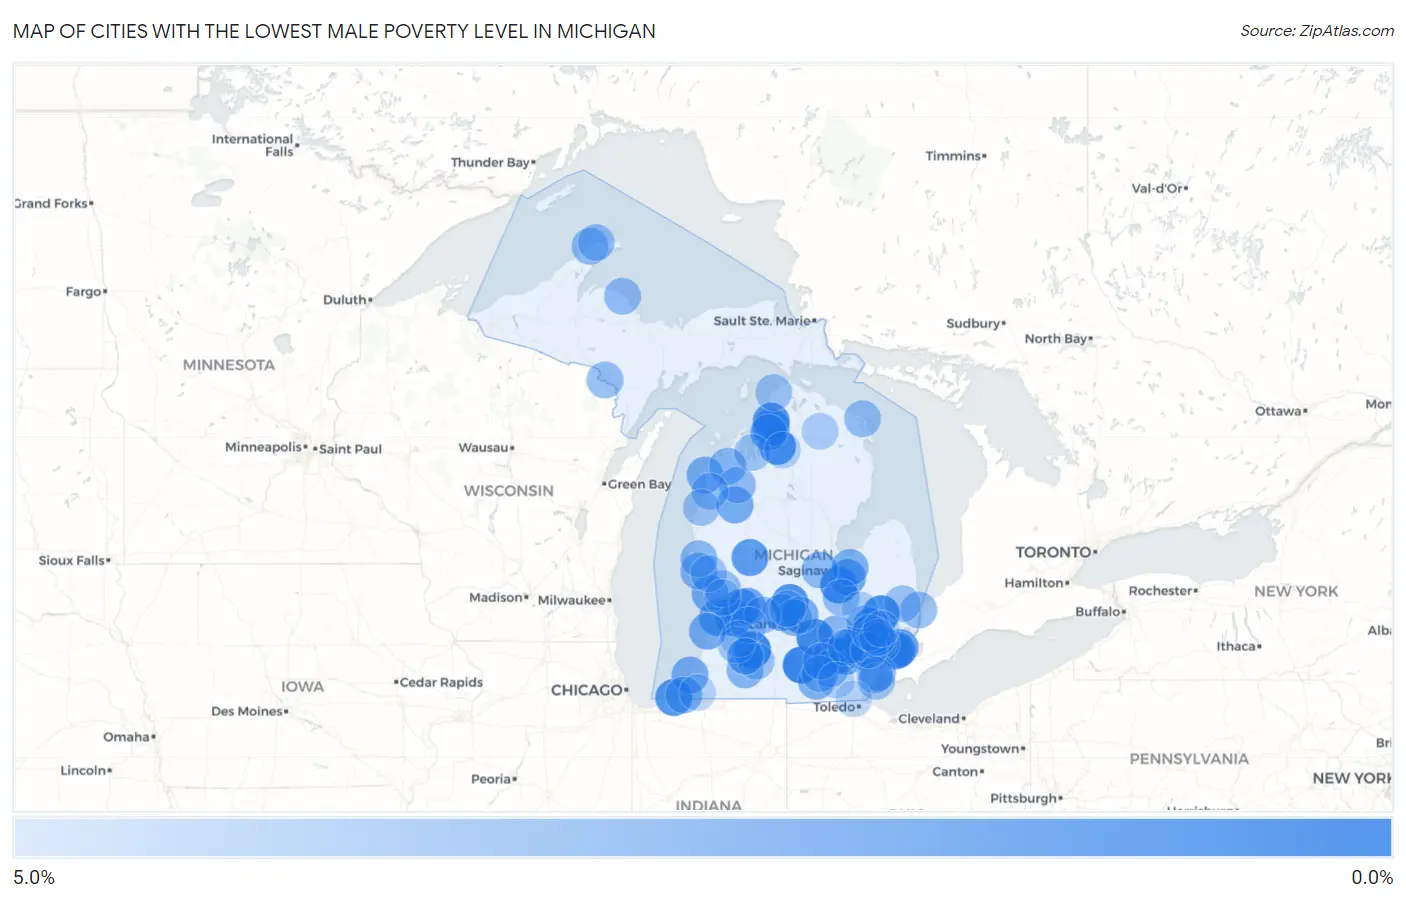
Map of Cities with the Lowest Male Poverty Level in Michigan
5.0%
0.0%
Cities with the Lowest Male Poverty Level in Michigan
| City | Male Poverty | vs State | vs National | |
| 1. | Spring Arbor | 0.17% | 12.0%(-11.8)#1 | 11.3%(-11.2)#26 |
| 2. | South Gull Lake | 0.24% | 12.0%(-11.7)#2 | 11.3%(-11.1)#38 |
| 3. | Dansville | 0.42% | 12.0%(-11.5)#3 | 11.3%(-10.9)#103 |
| 4. | Leonard | 0.60% | 12.0%(-11.4)#4 | 11.3%(-10.7)#197 |
| 5. | Ida | 0.62% | 12.0%(-11.3)#5 | 11.3%(-10.7)#208 |
| 6. | Burt | 0.69% | 12.0%(-11.3)#6 | 11.3%(-10.7)#251 |
| 7. | Alba | 0.93% | 12.0%(-11.0)#7 | 11.3%(-10.4)#428 |
| 8. | Fowler | 0.93% | 12.0%(-11.0)#8 | 11.3%(-10.4)#437 |
| 9. | Grand Beach | 0.98% | 12.0%(-11.0)#9 | 11.3%(-10.4)#470 |
| 10. | Advance | 1.1% | 12.0%(-10.9)#10 | 11.3%(-10.3)#540 |
| 11. | Byron Center | 1.1% | 12.0%(-10.8)#11 | 11.3%(-10.2)#590 |
| 12. | Horton Bay | 1.2% | 12.0%(-10.8)#12 | 11.3%(-10.2)#649 |
| 13. | East Grand Rapids | 1.3% | 12.0%(-10.7)#13 | 11.3%(-10.1)#734 |
| 14. | Huntington Woods | 1.3% | 12.0%(-10.7)#14 | 11.3%(-10.0)#743 |
| 15. | Stanwood | 1.3% | 12.0%(-10.6)#15 | 11.3%(-10.0)#786 |
| 16. | Northville | 1.4% | 12.0%(-10.5)#16 | 11.3%(-9.91)#869 |
| 17. | Zeeland | 1.5% | 12.0%(-10.5)#17 | 11.3%(-9.84)#938 |
| 18. | Village Of Grosse Pointe Shores | 1.5% | 12.0%(-10.4)#18 | 11.3%(-9.80)#971 |
| 19. | Lake Angelus | 1.5% | 12.0%(-10.4)#19 | 11.3%(-9.80)#973 |
| 20. | Chelsea | 1.6% | 12.0%(-10.4)#20 | 11.3%(-9.78)#992 |
| 21. | Grosse Pointe | 1.6% | 12.0%(-10.4)#21 | 11.3%(-9.76)#1,011 |
| 22. | Portland | 1.7% | 12.0%(-10.3)#22 | 11.3%(-9.67)#1,105 |
| 23. | Chassell | 1.7% | 12.0%(-10.3)#23 | 11.3%(-9.64)#1,143 |
| 24. | Keego Harbor | 1.7% | 12.0%(-10.3)#24 | 11.3%(-9.63)#1,150 |
| 25. | Barton Hills | 1.8% | 12.0%(-10.1)#25 | 11.3%(-9.52)#1,274 |
| 26. | Frankenmuth | 1.9% | 12.0%(-10.1)#26 | 11.3%(-9.44)#1,371 |
| 27. | Grosse Pointe Farms | 1.9% | 12.0%(-10.0)#27 | 11.3%(-9.41)#1,405 |
| 28. | Pleasant Ridge | 1.9% | 12.0%(-10.0)#28 | 11.3%(-9.40)#1,414 |
| 29. | Trufant | 1.9% | 12.0%(-10.0)#29 | 11.3%(-9.39)#1,418 |
| 30. | Beverly Hills | 2.0% | 12.0%(-10.00)#30 | 11.3%(-9.38)#1,441 |
| 31. | Forest Hills | 2.0% | 12.0%(-9.97)#31 | 11.3%(-9.35)#1,464 |
| 32. | East Jordan | 2.1% | 12.0%(-9.84)#32 | 11.3%(-9.23)#1,615 |
| 33. | Caberfae | 2.1% | 12.0%(-9.83)#33 | 11.3%(-9.21)#1,639 |
| 34. | Fruitport | 2.2% | 12.0%(-9.79)#34 | 11.3%(-9.17)#1,687 |
| 35. | Dewitt | 2.2% | 12.0%(-9.77)#35 | 11.3%(-9.15)#1,720 |
| 36. | Douglas | 2.2% | 12.0%(-9.75)#36 | 11.3%(-9.14)#1,738 |
| 37. | Shoreham | 2.2% | 12.0%(-9.75)#37 | 11.3%(-9.13)#1,747 |
| 38. | Plymouth | 2.2% | 12.0%(-9.74)#38 | 11.3%(-9.12)#1,751 |
| 39. | Elberta | 2.3% | 12.0%(-9.67)#39 | 11.3%(-9.05)#1,849 |
| 40. | Ruby | 2.3% | 12.0%(-9.64)#40 | 11.3%(-9.02)#1,879 |
| 41. | Manitou Beach Devils Lake | 2.4% | 12.0%(-9.60)#41 | 11.3%(-8.98)#1,930 |
| 42. | Reese | 2.4% | 12.0%(-9.59)#42 | 11.3%(-8.98)#1,939 |
| 43. | Dexter | 2.4% | 12.0%(-9.57)#43 | 11.3%(-8.95)#1,986 |
| 44. | Gibraltar | 2.4% | 12.0%(-9.54)#44 | 11.3%(-8.92)#2,021 |
| 45. | Novi | 2.4% | 12.0%(-9.53)#45 | 11.3%(-8.91)#2,030 |
| 46. | Vicksburg | 2.6% | 12.0%(-9.39)#46 | 11.3%(-8.78)#2,222 |
| 47. | Montague | 2.6% | 12.0%(-9.35)#47 | 11.3%(-8.73)#2,268 |
| 48. | Wacousta | 2.6% | 12.0%(-9.33)#48 | 11.3%(-8.71)#2,293 |
| 49. | Three Oaks | 2.7% | 12.0%(-9.30)#49 | 11.3%(-8.69)#2,340 |
| 50. | Lake Ann | 2.7% | 12.0%(-9.30)#50 | 11.3%(-8.68)#2,345 |
| 51. | Franklin | 2.7% | 12.0%(-9.27)#51 | 11.3%(-8.65)#2,380 |
| 52. | Howell | 2.7% | 12.0%(-9.24)#52 | 11.3%(-8.62)#2,420 |
| 53. | South Lyon | 2.8% | 12.0%(-9.17)#53 | 11.3%(-8.55)#2,500 |
| 54. | New Era | 2.8% | 12.0%(-9.17)#54 | 11.3%(-8.55)#2,506 |
| 55. | Manchester | 2.9% | 12.0%(-9.10)#55 | 11.3%(-8.49)#2,588 |
| 56. | Eagle River | 2.9% | 12.0%(-9.10)#56 | 11.3%(-8.48)#2,601 |
| 57. | Hemlock | 2.9% | 12.0%(-9.09)#57 | 11.3%(-8.47)#2,609 |
| 58. | Shaftsburg | 2.9% | 12.0%(-9.09)#58 | 11.3%(-8.47)#2,616 |
| 59. | Comstock Northwest | 2.9% | 12.0%(-9.09)#59 | 11.3%(-8.47)#2,620 |
| 60. | Buckley | 3.0% | 12.0%(-8.98)#60 | 11.3%(-8.37)#2,757 |
| 61. | Big Bay | 3.0% | 12.0%(-8.97)#61 | 11.3%(-8.36)#2,771 |
| 62. | Quinnesec | 3.1% | 12.0%(-8.89)#62 | 11.3%(-8.27)#2,901 |
| 63. | Presque Isle Harbor | 3.1% | 12.0%(-8.88)#63 | 11.3%(-8.26)#2,914 |
| 64. | Flushing | 3.1% | 12.0%(-8.88)#64 | 11.3%(-8.26)#2,916 |
| 65. | Marysville | 3.1% | 12.0%(-8.88)#65 | 11.3%(-8.26)#2,917 |
| 66. | Village Of Clarkston | 3.1% | 12.0%(-8.87)#66 | 11.3%(-8.25)#2,929 |
| 67. | Bear Lake | 3.1% | 12.0%(-8.83)#67 | 11.3%(-8.22)#2,968 |
| 68. | Eagle Harbor | 3.1% | 12.0%(-8.83)#68 | 11.3%(-8.22)#2,974 |
| 69. | Ravenna | 3.2% | 12.0%(-8.81)#69 | 11.3%(-8.19)#3,004 |
| 70. | Vineyard Lake | 3.2% | 12.0%(-8.74)#70 | 11.3%(-8.12)#3,095 |
| 71. | Cross Village | 3.2% | 12.0%(-8.73)#71 | 11.3%(-8.12)#3,117 |
| 72. | Grass Lake | 3.2% | 12.0%(-8.71)#72 | 11.3%(-8.09)#3,143 |
| 73. | Emmett | 3.3% | 12.0%(-8.71)#73 | 11.3%(-8.09)#3,151 |
| 74. | Oak Hill | 3.3% | 12.0%(-8.70)#74 | 11.3%(-8.08)#3,168 |
| 75. | Climax | 3.3% | 12.0%(-8.66)#75 | 11.3%(-8.04)#3,236 |
| 76. | Berkley | 3.3% | 12.0%(-8.64)#76 | 11.3%(-8.03)#3,260 |
| 77. | Estral Beach | 3.3% | 12.0%(-8.64)#77 | 11.3%(-8.02)#3,262 |
| 78. | Whitmore Lake | 3.3% | 12.0%(-8.64)#78 | 11.3%(-8.02)#3,266 |
| 79. | Twin Lake | 3.4% | 12.0%(-8.60)#79 | 11.3%(-7.99)#3,314 |
| 80. | Clarksville | 3.4% | 12.0%(-8.59)#80 | 11.3%(-7.97)#3,340 |
| 81. | Elk Rapids | 3.4% | 12.0%(-8.57)#81 | 11.3%(-7.95)#3,380 |
| 82. | Rockwood | 3.4% | 12.0%(-8.53)#82 | 11.3%(-7.92)#3,422 |
| 83. | Otsego | 3.5% | 12.0%(-8.47)#83 | 11.3%(-7.85)#3,517 |
| 84. | Three Lakes | 3.6% | 12.0%(-8.35)#84 | 11.3%(-7.74)#3,688 |
| 85. | Middleville | 3.7% | 12.0%(-8.30)#85 | 11.3%(-7.69)#3,736 |
| 86. | Bloomfield Hills | 3.8% | 12.0%(-8.17)#86 | 11.3%(-7.55)#3,951 |
| 87. | Canada Creek Ranch | 3.8% | 12.0%(-8.16)#87 | 11.3%(-7.54)#3,964 |
| 88. | Goodrich | 3.8% | 12.0%(-8.12)#88 | 11.3%(-7.51)#4,014 |
| 89. | Livonia | 3.9% | 12.0%(-8.10)#89 | 11.3%(-7.48)#4,065 |
| 90. | Lakes Of The North | 3.9% | 12.0%(-8.05)#90 | 11.3%(-7.44)#4,142 |
| 91. | Sylvan Lake | 3.9% | 12.0%(-8.05)#91 | 11.3%(-7.43)#4,145 |
| 92. | Coopersville | 4.0% | 12.0%(-8.01)#92 | 11.3%(-7.39)#4,208 |
| 93. | Tecumseh | 4.0% | 12.0%(-7.98)#93 | 11.3%(-7.36)#4,252 |
| 94. | Birmingham | 4.0% | 12.0%(-7.97)#94 | 11.3%(-7.35)#4,268 |
| 95. | Martin | 4.0% | 12.0%(-7.96)#95 | 11.3%(-7.34)#4,285 |
| 96. | Westphalia | 4.0% | 12.0%(-7.93)#96 | 11.3%(-7.32)#4,325 |
| 97. | Eastwood | 4.0% | 12.0%(-7.93)#97 | 11.3%(-7.32)#4,326 |
| 98. | Rochester Hills | 4.0% | 12.0%(-7.91)#98 | 11.3%(-7.29)#4,359 |
| 99. | Buchanan | 4.1% | 12.0%(-7.89)#99 | 11.3%(-7.27)#4,388 |
| 100. | Lambertville | 4.2% | 12.0%(-7.77)#100 | 11.3%(-7.15)#4,590 |
Common Questions
What are the Top 10 Cities with the Lowest Male Poverty Level in Michigan?
Top 10 Cities with the Lowest Male Poverty Level in Michigan are:
#1
0.17%
#2
0.24%
#3
0.42%
#4
0.60%
#5
0.69%
#6
0.93%
#7
0.93%
#8
0.98%
#9
1.1%
#10
1.1%
What city has the Lowest Male Poverty Level in Michigan?
Spring Arbor has the Lowest Male Poverty Level in Michigan with 0.17%.
What is the Poverty Level Among Males in the State of Michigan?
Poverty Level Among Males in Michigan is 12.0%.
What is the Poverty Level Among Males in the United States?
Poverty Level Among Males in the United States is 11.3%.