Cities with the Lowest Poverty Level Among Single Mothers in Michigan
RELATED REPORTS & OPTIONS
Lowest Poverty | Single Mother
Michigan
Compare Cities
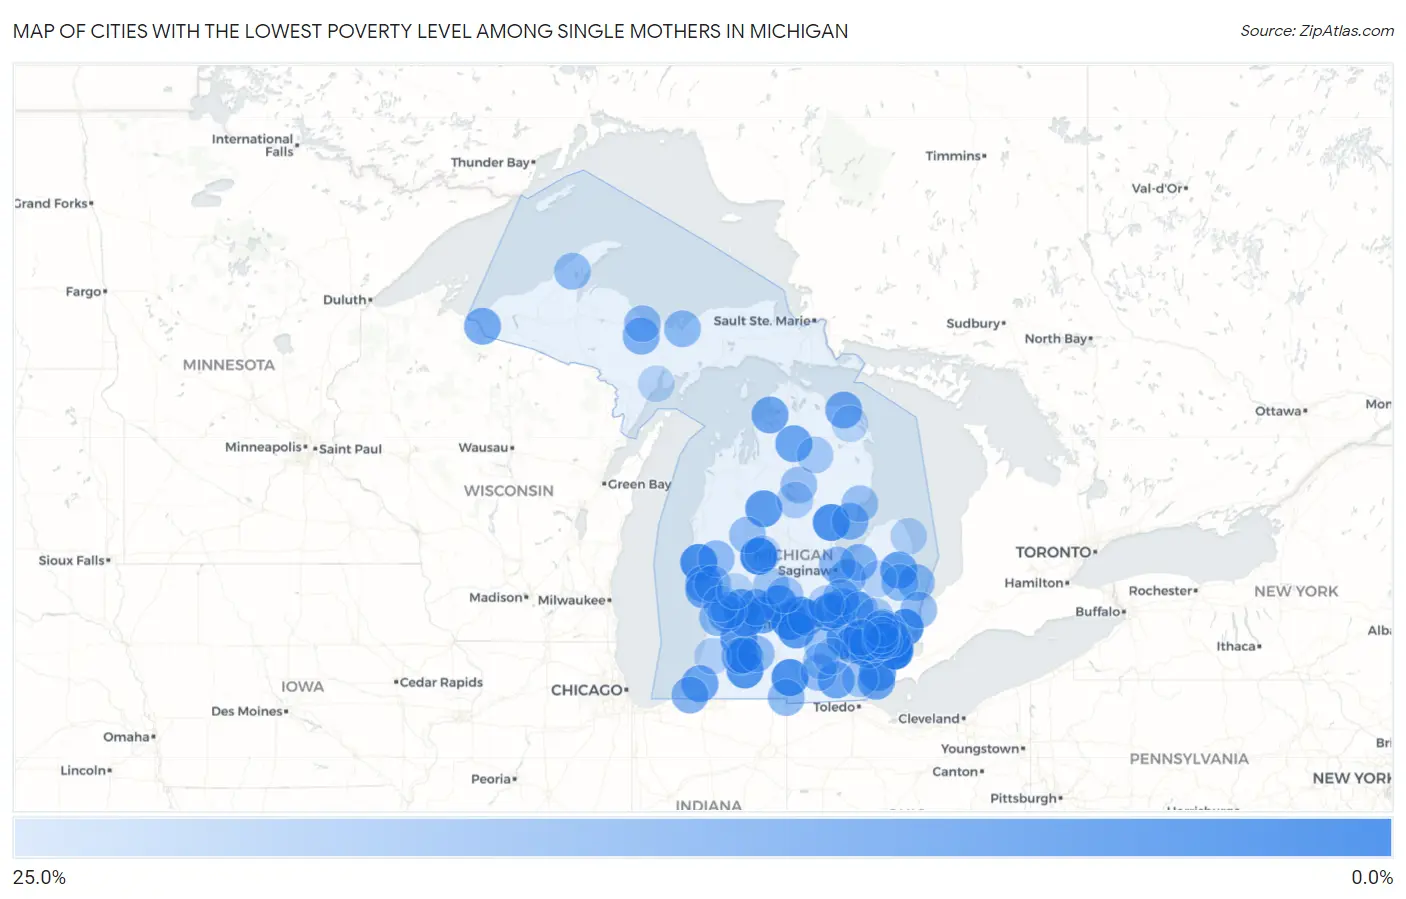
Map of Cities with the Lowest Poverty Level Among Single Mothers in Michigan
25.0%
0.0%
Cities with the Lowest Poverty Level Among Single Mothers in Michigan
| City | Single Mother Poverty | vs State | vs National | |
| 1. | Grosse Pointe Park | 0.56% | 35.5%(-35.0)#1 | 33.1%(-32.6)#2 |
| 2. | Canadian Lakes | 1.3% | 35.5%(-34.2)#2 | 33.1%(-31.8)#13 |
| 3. | Wixom | 2.4% | 35.5%(-33.2)#3 | 33.1%(-30.8)#51 |
| 4. | Grand Ledge | 2.5% | 35.5%(-33.1)#4 | 33.1%(-30.7)#56 |
| 5. | Center Line | 3.0% | 35.5%(-32.5)#5 | 33.1%(-30.1)#90 |
| 6. | Bancroft | 3.2% | 35.5%(-32.3)#6 | 33.1%(-29.9)#107 |
| 7. | Rothbury | 3.2% | 35.5%(-32.3)#7 | 33.1%(-29.9)#108 |
| 8. | New Baltimore | 3.5% | 35.5%(-32.0)#8 | 33.1%(-29.6)#135 |
| 9. | Litchfield | 3.8% | 35.5%(-31.8)#9 | 33.1%(-29.4)#159 |
| 10. | Sterling | 3.8% | 35.5%(-31.7)#10 | 33.1%(-29.3)#166 |
| 11. | Grosse Pointe Woods | 4.0% | 35.5%(-31.6)#11 | 33.1%(-29.2)#174 |
| 12. | Dewitt | 4.5% | 35.5%(-31.0)#12 | 33.1%(-28.6)#224 |
| 13. | Vicksburg | 4.7% | 35.5%(-30.8)#13 | 33.1%(-28.4)#252 |
| 14. | Martin | 5.3% | 35.5%(-30.3)#14 | 33.1%(-27.9)#335 |
| 15. | Lyons | 5.6% | 35.5%(-30.0)#15 | 33.1%(-27.6)#372 |
| 16. | Gibraltar | 5.7% | 35.5%(-29.8)#16 | 33.1%(-27.4)#397 |
| 17. | Dimondale | 5.9% | 35.5%(-29.7)#17 | 33.1%(-27.3)#419 |
| 18. | Mcbain | 6.7% | 35.5%(-28.9)#18 | 33.1%(-26.5)#543 |
| 19. | Brighton | 7.0% | 35.5%(-28.5)#19 | 33.1%(-26.1)#598 |
| 20. | Sandusky | 7.3% | 35.5%(-28.2)#20 | 33.1%(-25.8)#651 |
| 21. | North Muskegon | 7.3% | 35.5%(-28.2)#21 | 33.1%(-25.8)#658 |
| 22. | Farmington | 7.7% | 35.5%(-27.9)#22 | 33.1%(-25.5)#709 |
| 23. | East Grand Rapids | 8.0% | 35.5%(-27.6)#23 | 33.1%(-25.2)#773 |
| 24. | Clarksville | 8.3% | 35.5%(-27.2)#24 | 33.1%(-24.8)#856 |
| 25. | Caledonia | 8.7% | 35.5%(-26.8)#25 | 33.1%(-24.4)#935 |
| 26. | Tecumseh | 8.8% | 35.5%(-26.7)#26 | 33.1%(-24.3)#941 |
| 27. | Gaylord | 8.8% | 35.5%(-26.7)#27 | 33.1%(-24.3)#953 |
| 28. | Berrien Springs | 9.0% | 35.5%(-26.6)#28 | 33.1%(-24.2)#975 |
| 29. | Bay Shore | 9.1% | 35.5%(-26.4)#29 | 33.1%(-24.0)#1,007 |
| 30. | Estral Beach | 9.1% | 35.5%(-26.4)#30 | 33.1%(-24.0)#1,013 |
| 31. | Norton Shores | 9.5% | 35.5%(-26.0)#31 | 33.1%(-23.6)#1,068 |
| 32. | Rogers City | 9.6% | 35.5%(-26.0)#32 | 33.1%(-23.6)#1,090 |
| 33. | Grand Blanc | 9.8% | 35.5%(-25.7)#33 | 33.1%(-23.3)#1,129 |
| 34. | Lowell | 9.8% | 35.5%(-25.7)#34 | 33.1%(-23.3)#1,133 |
| 35. | Hudsonville | 10.0% | 35.5%(-25.5)#35 | 33.1%(-23.1)#1,156 |
| 36. | Ironwood | 10.3% | 35.5%(-25.3)#36 | 33.1%(-22.9)#1,225 |
| 37. | Grosse Pointe | 10.3% | 35.5%(-25.2)#37 | 33.1%(-22.8)#1,249 |
| 38. | Eastwood | 10.4% | 35.5%(-25.2)#38 | 33.1%(-22.8)#1,255 |
| 39. | Huntington Woods | 10.4% | 35.5%(-25.1)#39 | 33.1%(-22.7)#1,262 |
| 40. | Rochester | 11.4% | 35.5%(-24.2)#40 | 33.1%(-21.8)#1,481 |
| 41. | Frankenmuth | 11.4% | 35.5%(-24.1)#41 | 33.1%(-21.7)#1,497 |
| 42. | Au Gres | 11.5% | 35.5%(-24.0)#42 | 33.1%(-21.6)#1,519 |
| 43. | Bath | 11.6% | 35.5%(-24.0)#43 | 33.1%(-21.6)#1,526 |
| 44. | Galien | 11.8% | 35.5%(-23.8)#44 | 33.1%(-21.4)#1,569 |
| 45. | K I Sawyer | 11.9% | 35.5%(-23.7)#45 | 33.1%(-21.3)#1,591 |
| 46. | Westwood | 11.9% | 35.5%(-23.6)#46 | 33.1%(-21.2)#1,595 |
| 47. | Fairgrove | 12.0% | 35.5%(-23.5)#47 | 33.1%(-21.1)#1,629 |
| 48. | Livonia | 12.0% | 35.5%(-23.5)#48 | 33.1%(-21.1)#1,631 |
| 49. | Northville | 12.7% | 35.5%(-22.9)#49 | 33.1%(-20.5)#1,788 |
| 50. | Southfield | 12.9% | 35.5%(-22.7)#50 | 33.1%(-20.3)#1,829 |
| 51. | Lexington | 13.3% | 35.5%(-22.2)#51 | 33.1%(-19.8)#1,933 |
| 52. | Montgomery | 13.3% | 35.5%(-22.2)#52 | 33.1%(-19.8)#1,959 |
| 53. | Swartz Creek | 13.5% | 35.5%(-22.0)#53 | 33.1%(-19.6)#1,980 |
| 54. | Utica | 13.6% | 35.5%(-21.9)#54 | 33.1%(-19.5)#2,000 |
| 55. | Zeeland | 13.6% | 35.5%(-21.9)#55 | 33.1%(-19.5)#2,006 |
| 56. | Munising | 13.6% | 35.5%(-21.9)#56 | 33.1%(-19.5)#2,011 |
| 57. | Peck | 13.9% | 35.5%(-21.6)#57 | 33.1%(-19.2)#2,069 |
| 58. | Fraser | 13.9% | 35.5%(-21.6)#58 | 33.1%(-19.2)#2,075 |
| 59. | Hesperia | 14.0% | 35.5%(-21.6)#59 | 33.1%(-19.2)#2,078 |
| 60. | South Lyon | 14.0% | 35.5%(-21.6)#60 | 33.1%(-19.2)#2,080 |
| 61. | Harvey | 14.1% | 35.5%(-21.4)#61 | 33.1%(-19.0)#2,109 |
| 62. | Zilwaukee | 14.3% | 35.5%(-21.3)#62 | 33.1%(-18.8)#2,147 |
| 63. | Augusta | 14.3% | 35.5%(-21.3)#63 | 33.1%(-18.8)#2,158 |
| 64. | Brooklyn | 14.3% | 35.5%(-21.3)#64 | 33.1%(-18.8)#2,160 |
| 65. | Royal Oak | 14.4% | 35.5%(-21.1)#65 | 33.1%(-18.7)#2,227 |
| 66. | Durand | 14.4% | 35.5%(-21.1)#66 | 33.1%(-18.7)#2,232 |
| 67. | Marysville | 14.7% | 35.5%(-20.9)#67 | 33.1%(-18.5)#2,276 |
| 68. | Houghton | 15.0% | 35.5%(-20.5)#68 | 33.1%(-18.1)#2,340 |
| 69. | Reed City | 15.3% | 35.5%(-20.2)#69 | 33.1%(-17.8)#2,398 |
| 70. | Jenison | 15.4% | 35.5%(-20.2)#70 | 33.1%(-17.8)#2,406 |
| 71. | Flushing | 15.4% | 35.5%(-20.1)#71 | 33.1%(-17.7)#2,454 |
| 72. | Clawson | 15.5% | 35.5%(-20.0)#72 | 33.1%(-17.6)#2,470 |
| 73. | Farmington Hills | 15.5% | 35.5%(-20.0)#73 | 33.1%(-17.6)#2,471 |
| 74. | Wolf Lake | 15.6% | 35.5%(-20.0)#74 | 33.1%(-17.6)#2,478 |
| 75. | Roscommon | 15.8% | 35.5%(-19.7)#75 | 33.1%(-17.3)#2,533 |
| 76. | Tawas City | 16.0% | 35.5%(-19.6)#76 | 33.1%(-17.2)#2,579 |
| 77. | Goodrich | 16.2% | 35.5%(-19.3)#77 | 33.1%(-16.9)#2,636 |
| 78. | Stockbridge | 16.4% | 35.5%(-19.2)#78 | 33.1%(-16.8)#2,668 |
| 79. | Sheridan | 16.7% | 35.5%(-18.9)#79 | 33.1%(-16.5)#2,757 |
| 80. | Maybee | 16.7% | 35.5%(-18.9)#80 | 33.1%(-16.5)#2,764 |
| 81. | Hubbardston | 16.7% | 35.5%(-18.9)#81 | 33.1%(-16.5)#2,782 |
| 82. | Lewiston | 17.6% | 35.5%(-17.9)#82 | 33.1%(-15.5)#2,993 |
| 83. | Oxford | 17.8% | 35.5%(-17.7)#83 | 33.1%(-15.3)#3,038 |
| 84. | Madison Heights | 17.8% | 35.5%(-17.7)#84 | 33.1%(-15.3)#3,046 |
| 85. | Grass Lake | 18.1% | 35.5%(-17.5)#85 | 33.1%(-15.1)#3,099 |
| 86. | Prudenville | 18.4% | 35.5%(-17.1)#86 | 33.1%(-14.7)#3,216 |
| 87. | Rochester Hills | 18.5% | 35.5%(-17.0)#87 | 33.1%(-14.6)#3,223 |
| 88. | Troy | 18.9% | 35.5%(-16.7)#88 | 33.1%(-14.3)#3,348 |
| 89. | Harbor Beach | 19.0% | 35.5%(-16.5)#89 | 33.1%(-14.1)#3,379 |
| 90. | Mecosta | 19.0% | 35.5%(-16.5)#90 | 33.1%(-14.1)#3,392 |
| 91. | Wolverine Lake | 19.2% | 35.5%(-16.3)#91 | 33.1%(-13.9)#3,420 |
| 92. | Corunna | 19.4% | 35.5%(-16.2)#92 | 33.1%(-13.8)#3,456 |
| 93. | Allendale | 19.5% | 35.5%(-16.0)#93 | 33.1%(-13.6)#3,493 |
| 94. | Bangor | 19.7% | 35.5%(-15.9)#94 | 33.1%(-13.5)#3,530 |
| 95. | Parchment | 19.8% | 35.5%(-15.7)#95 | 33.1%(-13.3)#3,558 |
| 96. | Clifford | 20.0% | 35.5%(-15.5)#96 | 33.1%(-13.1)#3,671 |
| 97. | Posen | 20.0% | 35.5%(-15.5)#97 | 33.1%(-13.1)#3,678 |
| 98. | Sparta | 20.1% | 35.5%(-15.4)#98 | 33.1%(-13.0)#3,708 |
| 99. | Chelsea | 20.4% | 35.5%(-15.2)#99 | 33.1%(-12.8)#3,754 |
| 100. | Escanaba | 20.4% | 35.5%(-15.2)#100 | 33.1%(-12.8)#3,758 |
Common Questions
What are the Top 10 Cities with the Lowest Poverty Level Among Single Mothers in Michigan?
Top 10 Cities with the Lowest Poverty Level Among Single Mothers in Michigan are:
#1
0.56%
#2
1.3%
#3
2.4%
#4
2.5%
#5
3.0%
#6
3.2%
#7
3.2%
#8
3.5%
#9
3.8%
#10
3.8%
What city has the Lowest Poverty Level Among Single Mothers in Michigan?
Grosse Pointe Park has the Lowest Poverty Level Among Single Mothers in Michigan with 0.56%.
What is the Poverty Level Among Single Mothers in the State of Michigan?
Poverty Level Among Single Mothers in Michigan is 35.5%.
What is the Poverty Level Among Single Mothers in the United States?
Poverty Level Among Single Mothers in the United States is 33.1%.