Cities with the Most Immigrants from Bosnia and Herzegovina in Michigan
RELATED REPORTS & OPTIONS
Bosnia and Herzegovina
Michigan
Compare Cities
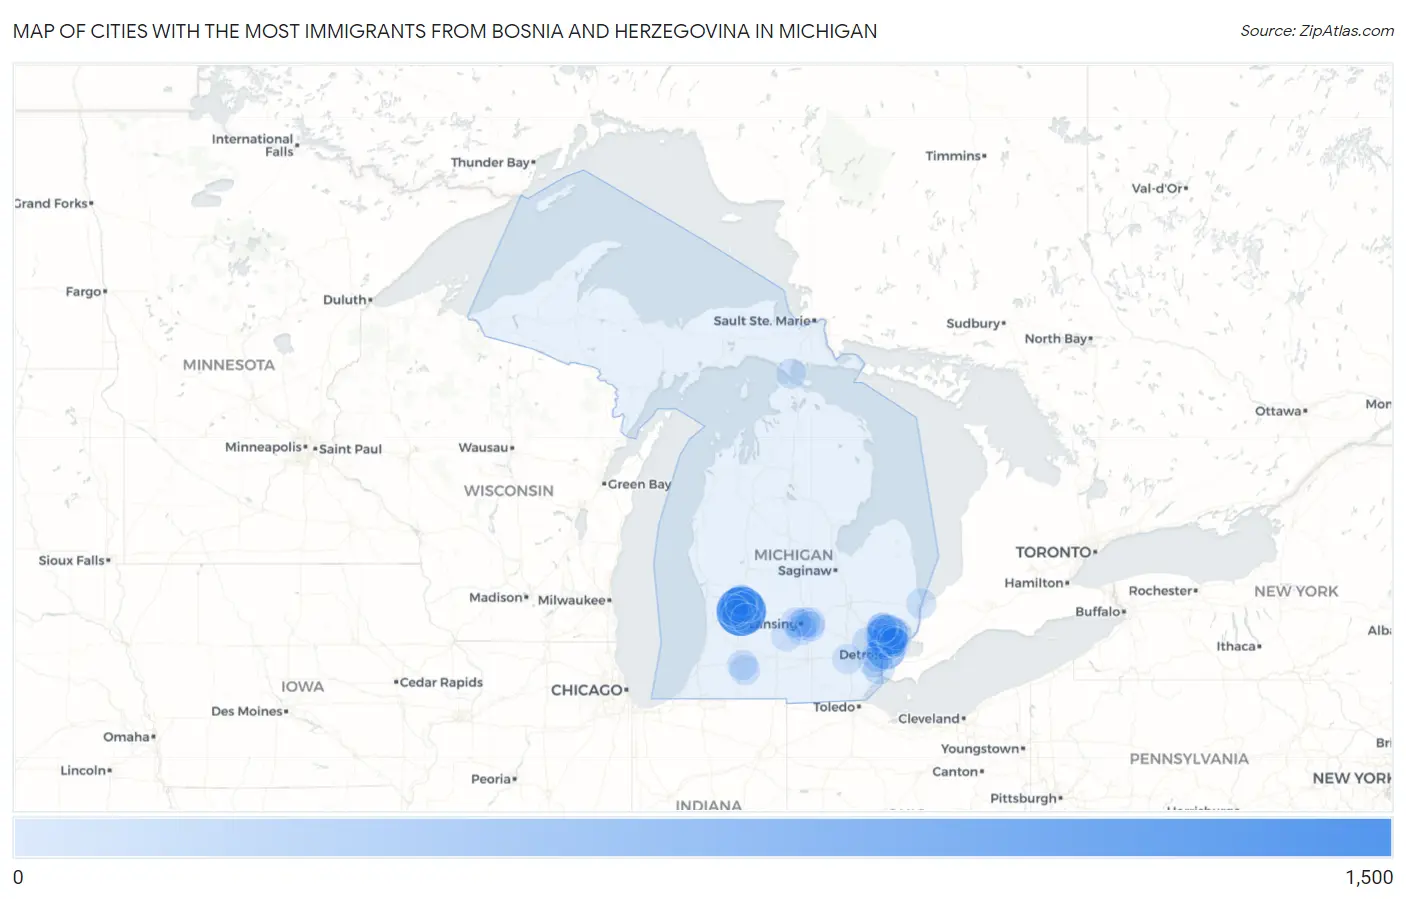
Map of Cities with the Most Immigrants from Bosnia and Herzegovina in Michigan
0
1,500
Cities with the Most Immigrants from Bosnia and Herzegovina in Michigan
| City | Bosnia and Herzegovina | vs State | vs National | |
| 1. | Kentwood | 1,078 | 6,009(17.94%)#1 | 106,359(1.01%)#9 |
| 2. | Sterling Heights | 585 | 6,009(9.74%)#2 | 106,359(0.55%)#21 |
| 3. | Hamtramck | 453 | 6,009(7.54%)#3 | 106,359(0.43%)#38 |
| 4. | Grand Rapids | 401 | 6,009(6.67%)#4 | 106,359(0.38%)#43 |
| 5. | Warren | 306 | 6,009(5.09%)#5 | 106,359(0.29%)#59 |
| 6. | Madison Heights | 126 | 6,009(2.10%)#6 | 106,359(0.12%)#136 |
| 7. | Troy | 117 | 6,009(1.95%)#7 | 106,359(0.11%)#143 |
| 8. | Forest Hills | 93 | 6,009(1.55%)#8 | 106,359(0.09%)#192 |
| 9. | Wyoming | 83 | 6,009(1.38%)#9 | 106,359(0.08%)#216 |
| 10. | Trenton | 65 | 6,009(1.08%)#10 | 106,359(0.06%)#272 |
| 11. | Northview | 56 | 6,009(0.93%)#11 | 106,359(0.05%)#312 |
| 12. | Dearborn | 49 | 6,009(0.82%)#12 | 106,359(0.05%)#342 |
| 13. | Grandville | 49 | 6,009(0.82%)#13 | 106,359(0.05%)#349 |
| 14. | Mount Clemens | 44 | 6,009(0.73%)#14 | 106,359(0.04%)#379 |
| 15. | Cutlerville | 37 | 6,009(0.62%)#15 | 106,359(0.03%)#427 |
| 16. | Fraser | 36 | 6,009(0.60%)#16 | 106,359(0.03%)#433 |
| 17. | Farmington Hills | 35 | 6,009(0.58%)#17 | 106,359(0.03%)#437 |
| 18. | Lansing | 34 | 6,009(0.57%)#18 | 106,359(0.03%)#447 |
| 19. | Holt | 24 | 6,009(0.40%)#19 | 106,359(0.02%)#550 |
| 20. | Haslett | 19 | 6,009(0.32%)#20 | 106,359(0.02%)#624 |
| 21. | Utica | 19 | 6,009(0.32%)#21 | 106,359(0.02%)#625 |
| 22. | East Grand Rapids | 18 | 6,009(0.30%)#22 | 106,359(0.02%)#650 |
| 23. | Rochester Hills | 15 | 6,009(0.25%)#23 | 106,359(0.01%)#704 |
| 24. | Roseville | 15 | 6,009(0.25%)#24 | 106,359(0.01%)#708 |
| 25. | East Lansing | 15 | 6,009(0.25%)#25 | 106,359(0.01%)#709 |
| 26. | Vicksburg | 15 | 6,009(0.25%)#26 | 106,359(0.01%)#728 |
| 27. | Portage | 12 | 6,009(0.20%)#27 | 106,359(0.01%)#775 |
| 28. | Okemos | 12 | 6,009(0.20%)#28 | 106,359(0.01%)#786 |
| 29. | Waverly | 12 | 6,009(0.20%)#29 | 106,359(0.01%)#788 |
| 30. | Port Huron | 11 | 6,009(0.18%)#30 | 106,359(0.01%)#811 |
| 31. | Rochester | 10 | 6,009(0.17%)#31 | 106,359(0.01%)#851 |
| 32. | Charlotte | 9 | 6,009(0.15%)#32 | 106,359(0.01%)#893 |
| 33. | Taylor | 8 | 6,009(0.13%)#33 | 106,359(0.01%)#912 |
| 34. | Ann Arbor | 6 | 6,009(0.10%)#34 | 106,359(0.01%)#967 |
| 35. | St Clair Shores | 5 | 6,009(0.08%)#35 | 106,359(0.00%)#991 |
| 36. | St Ignace | 4 | 6,009(0.07%)#36 | 106,359(0.00%)#1,025 |
| 37. | Caledonia | 3 | 6,009(0.05%)#37 | 106,359(0.00%)#1,038 |
Common Questions
What are the Top 10 Cities with the Most Immigrants from Bosnia and Herzegovina in Michigan?
Top 10 Cities with the Most Immigrants from Bosnia and Herzegovina in Michigan are:
#1
1,078
#2
585
#3
453
#4
401
#5
306
#6
126
#7
117
#8
93
#9
83
#10
65
What city has the Most Immigrants from Bosnia and Herzegovina in Michigan?
Kentwood has the Most Immigrants from Bosnia and Herzegovina in Michigan with 1,078.
What is the Total Immigrants from Bosnia and Herzegovina in the State of Michigan?
Total Immigrants from Bosnia and Herzegovina in Michigan is 6,009.
What is the Total Immigrants from Bosnia and Herzegovina in the United States?
Total Immigrants from Bosnia and Herzegovina in the United States is 106,359.