Cities with the Highest Percentage of Population Employed in Health Care & Social Assistance in Michigan
RELATED REPORTS & OPTIONS
Health Care & Social Assistance
Michigan
Compare Cities
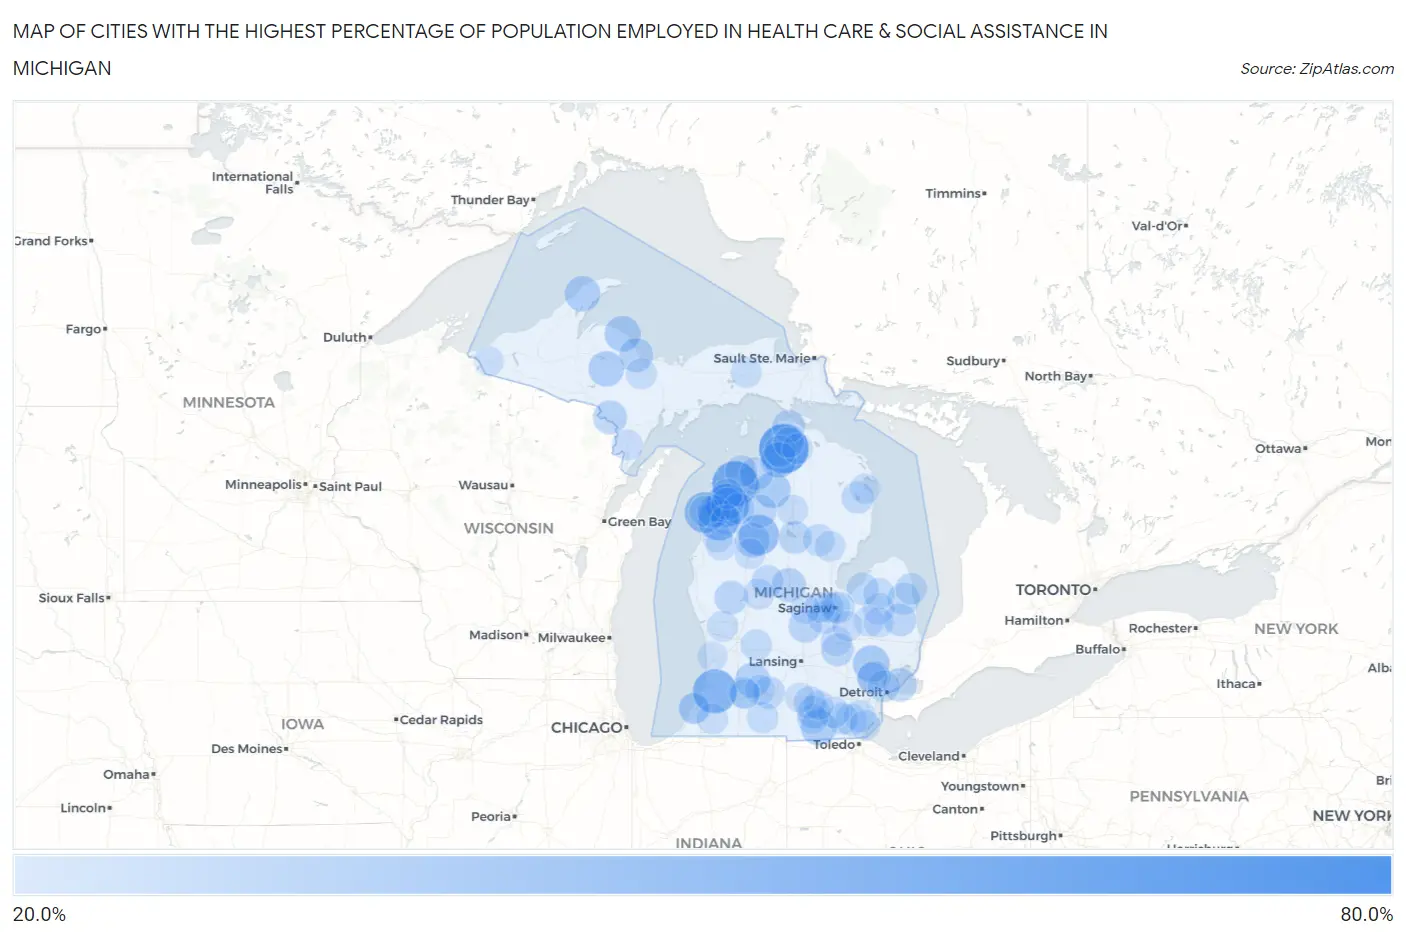
Map of Cities with the Highest Percentage of Population Employed in Health Care & Social Assistance in Michigan
0.0%
80.0%
Cities with the Highest Percentage of Population Employed in Health Care & Social Assistance in Michigan
| City | % Employed | vs State | vs National | |
| 1. | Millers Lake | 74.7% | 14.7%(+60.0)#1 | 13.9%(+60.8)#100 |
| 2. | Conway | 61.5% | 14.7%(+46.8)#2 | 13.9%(+47.6)#173 |
| 3. | Lake Leelanau | 53.3% | 14.7%(+38.6)#3 | 13.9%(+39.4)#268 |
| 4. | Paris | 51.9% | 14.7%(+37.2)#4 | 13.9%(+37.9)#289 |
| 5. | Breedsville | 49.5% | 14.7%(+34.9)#5 | 13.9%(+35.6)#355 |
| 6. | Maple Grove | 47.4% | 14.7%(+32.7)#6 | 13.9%(+33.5)#384 |
| 7. | Crystal Mountain | 43.1% | 14.7%(+28.4)#7 | 13.9%(+29.2)#489 |
| 8. | Elberta | 43.1% | 14.7%(+28.4)#8 | 13.9%(+29.1)#492 |
| 9. | Jennings | 42.4% | 14.7%(+27.7)#9 | 13.9%(+28.4)#520 |
| 10. | Lake Angelus | 34.1% | 14.7%(+19.4)#10 | 13.9%(+20.1)#954 |
| 11. | Mancelona | 32.9% | 14.7%(+18.2)#11 | 13.9%(+19.0)#1,084 |
| 12. | Greenland | 32.9% | 14.7%(+18.2)#12 | 13.9%(+19.0)#1,086 |
| 13. | Big Bay | 32.6% | 14.7%(+17.9)#13 | 13.9%(+18.7)#1,106 |
| 14. | Clayton | 32.6% | 14.7%(+17.9)#14 | 13.9%(+18.6)#1,111 |
| 15. | Walloon Lake | 32.3% | 14.7%(+17.6)#15 | 13.9%(+18.4)#1,145 |
| 16. | Republic | 31.9% | 14.7%(+17.2)#16 | 13.9%(+17.9)#1,215 |
| 17. | Ahmeek | 31.8% | 14.7%(+17.1)#17 | 13.9%(+17.9)#1,221 |
| 18. | Delton | 30.4% | 14.7%(+15.7)#18 | 13.9%(+16.5)#1,407 |
| 19. | Haring | 30.1% | 14.7%(+15.4)#19 | 13.9%(+16.2)#1,447 |
| 20. | Lakeport | 29.0% | 14.7%(+14.3)#20 | 13.9%(+15.1)#1,630 |
| 21. | Rosebush | 28.9% | 14.7%(+14.2)#21 | 13.9%(+15.0)#1,654 |
| 22. | Rockland | 28.8% | 14.7%(+14.1)#22 | 13.9%(+14.9)#1,676 |
| 23. | Trowbridge Park | 28.7% | 14.7%(+14.0)#23 | 13.9%(+14.7)#1,690 |
| 24. | Norway | 28.5% | 14.7%(+13.8)#24 | 13.9%(+14.6)#1,740 |
| 25. | Village Of Grosse Pointe Shores | 28.1% | 14.7%(+13.4)#25 | 13.9%(+14.2)#1,819 |
| 26. | Bingham Farms | 28.1% | 14.7%(+13.4)#26 | 13.9%(+14.2)#1,821 |
| 27. | White Cloud | 27.5% | 14.7%(+12.8)#27 | 13.9%(+13.5)#1,947 |
| 28. | South Boardman | 27.5% | 14.7%(+12.8)#28 | 13.9%(+13.5)#1,948 |
| 29. | Eastport | 27.4% | 14.7%(+12.7)#29 | 13.9%(+13.4)#1,962 |
| 30. | Ramsay | 27.3% | 14.7%(+12.6)#30 | 13.9%(+13.3)#1,980 |
| 31. | Ashley | 26.6% | 14.7%(+11.9)#31 | 13.9%(+12.7)#2,129 |
| 32. | Beulah | 26.5% | 14.7%(+11.8)#32 | 13.9%(+12.6)#2,155 |
| 33. | Carp Lake | 26.4% | 14.7%(+11.7)#33 | 13.9%(+12.5)#2,184 |
| 34. | Cement City | 26.1% | 14.7%(+11.4)#34 | 13.9%(+12.2)#2,266 |
| 35. | Gaines | 26.1% | 14.7%(+11.4)#35 | 13.9%(+12.1)#2,288 |
| 36. | Prudenville | 26.0% | 14.7%(+11.3)#36 | 13.9%(+12.0)#2,312 |
| 37. | Peck | 25.7% | 14.7%(+11.0)#37 | 13.9%(+11.8)#2,376 |
| 38. | Lake Ann | 25.6% | 14.7%(+10.9)#38 | 13.9%(+11.7)#2,404 |
| 39. | Deckerville | 25.5% | 14.7%(+10.8)#39 | 13.9%(+11.6)#2,431 |
| 40. | Brownlee Park | 25.5% | 14.7%(+10.8)#40 | 13.9%(+11.6)#2,438 |
| 41. | Vandercook Lake | 25.5% | 14.7%(+10.8)#41 | 13.9%(+11.5)#2,445 |
| 42. | Unionville | 25.4% | 14.7%(+10.7)#42 | 13.9%(+11.5)#2,460 |
| 43. | Barryton | 25.0% | 14.7%(+10.3)#43 | 13.9%(+11.1)#2,588 |
| 44. | St Charles | 24.9% | 14.7%(+10.2)#44 | 13.9%(+11.0)#2,660 |
| 45. | Hubbard Lake | 24.9% | 14.7%(+10.2)#45 | 13.9%(+10.9)#2,673 |
| 46. | Northport | 24.8% | 14.7%(+10.1)#46 | 13.9%(+10.9)#2,690 |
| 47. | Highland Park | 24.8% | 14.7%(+10.1)#47 | 13.9%(+10.8)#2,716 |
| 48. | Bay View | 24.5% | 14.7%(+9.83)#48 | 13.9%(+10.6)#2,791 |
| 49. | Dundee | 24.4% | 14.7%(+9.72)#49 | 13.9%(+10.5)#2,822 |
| 50. | West Branch | 24.4% | 14.7%(+9.70)#50 | 13.9%(+10.5)#2,830 |
| 51. | Buena Vista | 24.3% | 14.7%(+9.65)#51 | 13.9%(+10.4)#2,845 |
| 52. | Forestville | 24.2% | 14.7%(+9.54)#52 | 13.9%(+10.3)#2,890 |
| 53. | Maybee | 24.2% | 14.7%(+9.52)#53 | 13.9%(+10.3)#2,901 |
| 54. | Parchment | 23.9% | 14.7%(+9.25)#54 | 13.9%(+10.0)#3,004 |
| 55. | Britton | 23.9% | 14.7%(+9.19)#55 | 13.9%(+9.96)#3,025 |
| 56. | Benton Heights | 23.9% | 14.7%(+9.18)#56 | 13.9%(+9.94)#3,035 |
| 57. | Sherwood | 23.7% | 14.7%(+9.01)#57 | 13.9%(+9.77)#3,098 |
| 58. | Clinton | 23.6% | 14.7%(+8.95)#58 | 13.9%(+9.71)#3,127 |
| 59. | Kingston | 23.6% | 14.7%(+8.90)#59 | 13.9%(+9.67)#3,150 |
| 60. | Lowell | 23.4% | 14.7%(+8.75)#60 | 13.9%(+9.51)#3,227 |
| 61. | Cass City | 23.3% | 14.7%(+8.59)#61 | 13.9%(+9.35)#3,303 |
| 62. | Chums Corner | 23.1% | 14.7%(+8.40)#62 | 13.9%(+9.16)#3,388 |
| 63. | Dowagiac | 22.9% | 14.7%(+8.16)#63 | 13.9%(+8.92)#3,517 |
| 64. | K I Sawyer | 22.8% | 14.7%(+8.09)#64 | 13.9%(+8.85)#3,548 |
| 65. | Crystal | 22.8% | 14.7%(+8.07)#65 | 13.9%(+8.84)#3,553 |
| 66. | Newberry | 22.8% | 14.7%(+8.06)#66 | 13.9%(+8.82)#3,564 |
| 67. | Wellston | 22.7% | 14.7%(+7.97)#67 | 13.9%(+8.73)#3,610 |
| 68. | Saginaw | 22.7% | 14.7%(+7.96)#68 | 13.9%(+8.72)#3,619 |
| 69. | Frankfort | 22.6% | 14.7%(+7.94)#69 | 13.9%(+8.70)#3,627 |
| 70. | Ravenna | 22.5% | 14.7%(+7.84)#70 | 13.9%(+8.61)#3,662 |
| 71. | Canadian Lakes | 22.5% | 14.7%(+7.77)#71 | 13.9%(+8.53)#3,691 |
| 72. | Addison | 22.3% | 14.7%(+7.57)#72 | 13.9%(+8.33)#3,787 |
| 73. | Lamont | 22.3% | 14.7%(+7.56)#73 | 13.9%(+8.32)#3,792 |
| 74. | Shields | 22.2% | 14.7%(+7.54)#74 | 13.9%(+8.31)#3,800 |
| 75. | Grayling | 22.2% | 14.7%(+7.48)#75 | 13.9%(+8.24)#3,841 |
| 76. | Skidway Lake | 22.2% | 14.7%(+7.48)#76 | 13.9%(+8.24)#3,844 |
| 77. | Hemlock | 22.1% | 14.7%(+7.44)#77 | 13.9%(+8.20)#3,860 |
| 78. | Benton Harbor | 22.1% | 14.7%(+7.39)#78 | 13.9%(+8.15)#3,886 |
| 79. | Daggett | 22.1% | 14.7%(+7.38)#79 | 13.9%(+8.14)#3,889 |
| 80. | Indian River | 21.8% | 14.7%(+7.06)#80 | 13.9%(+7.82)#4,092 |
| 81. | Maple City | 21.7% | 14.7%(+7.04)#81 | 13.9%(+7.80)#4,104 |
| 82. | Fostoria | 21.7% | 14.7%(+7.00)#82 | 13.9%(+7.76)#4,132 |
| 83. | Lennon | 21.6% | 14.7%(+6.94)#83 | 13.9%(+7.70)#4,173 |
| 84. | Clio | 21.6% | 14.7%(+6.90)#84 | 13.9%(+7.66)#4,195 |
| 85. | Level Park Oak Park | 21.6% | 14.7%(+6.88)#85 | 13.9%(+7.64)#4,216 |
| 86. | Tustin | 21.5% | 14.7%(+6.80)#86 | 13.9%(+7.56)#4,258 |
| 87. | Nessen City | 21.4% | 14.7%(+6.73)#87 | 13.9%(+7.49)#4,304 |
| 88. | South Monroe | 21.4% | 14.7%(+6.70)#88 | 13.9%(+7.46)#4,328 |
| 89. | Ossineke | 21.4% | 14.7%(+6.67)#89 | 13.9%(+7.43)#4,341 |
| 90. | North Branch | 21.4% | 14.7%(+6.67)#90 | 13.9%(+7.43)#4,347 |
| 91. | Brutus | 21.3% | 14.7%(+6.56)#91 | 13.9%(+7.32)#4,413 |
| 92. | Breckenridge | 21.3% | 14.7%(+6.55)#92 | 13.9%(+7.32)#4,415 |
| 93. | Brethren | 21.2% | 14.7%(+6.51)#93 | 13.9%(+7.28)#4,451 |
| 94. | Bessemer | 21.0% | 14.7%(+6.30)#94 | 13.9%(+7.06)#4,628 |
| 95. | Beechwood | 21.0% | 14.7%(+6.27)#95 | 13.9%(+7.03)#4,657 |
| 96. | Ruby | 20.9% | 14.7%(+6.25)#96 | 13.9%(+7.01)#4,667 |
| 97. | Napoleon | 20.8% | 14.7%(+6.14)#97 | 13.9%(+6.91)#4,748 |
| 98. | Franklin | 20.8% | 14.7%(+6.08)#98 | 13.9%(+6.85)#4,793 |
| 99. | Parma | 20.8% | 14.7%(+6.08)#99 | 13.9%(+6.84)#4,797 |
| 100. | Eastwood | 20.8% | 14.7%(+6.07)#100 | 13.9%(+6.83)#4,802 |
Common Questions
What are the Top 10 Cities with the Highest Percentage of Population Employed in Health Care & Social Assistance in Michigan?
Top 10 Cities with the Highest Percentage of Population Employed in Health Care & Social Assistance in Michigan are:
#1
61.5%
#2
53.3%
#3
49.5%
#4
47.4%
#5
43.1%
#6
43.1%
#7
42.4%
#8
34.1%
#9
32.9%
#10
32.6%
What city has the Highest Percentage of Population Employed in Health Care & Social Assistance in Michigan?
Conway has the Highest Percentage of Population Employed in Health Care & Social Assistance in Michigan with 61.5%.
What is the Percentage of Population Employed in Health Care & Social Assistance in the State of Michigan?
Percentage of Population Employed in Health Care & Social Assistance in Michigan is 14.7%.
What is the Percentage of Population Employed in Health Care & Social Assistance in the United States?
Percentage of Population Employed in Health Care & Social Assistance in the United States is 13.9%.