Cities with the Most Immigrants from Latin America in Michigan
RELATED REPORTS & OPTIONS
Latin America
Michigan
Compare Cities
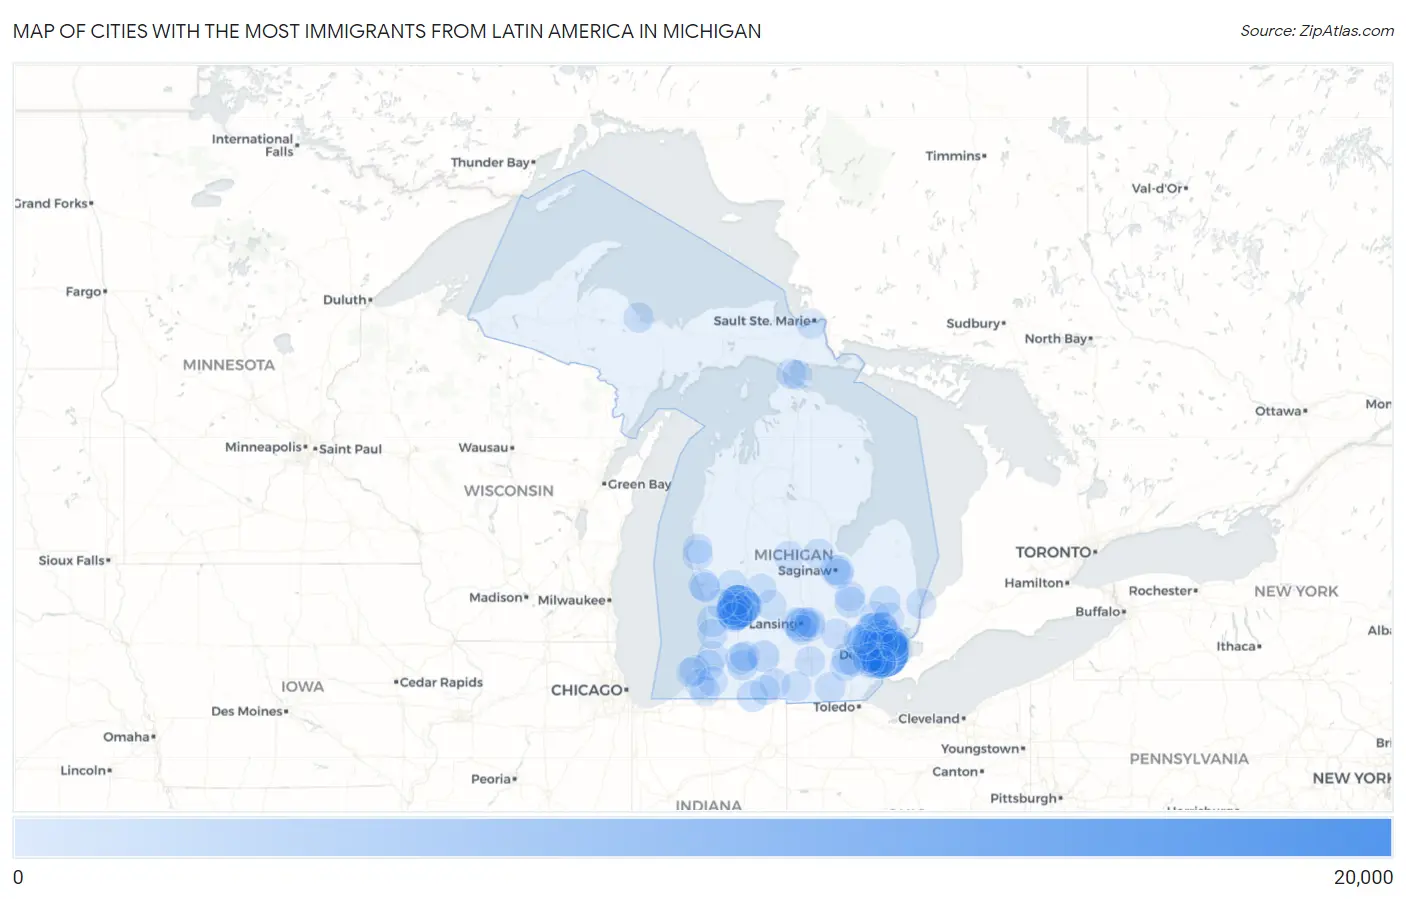
Map of Cities with the Most Immigrants from Latin America in Michigan
0
20,000
Cities with the Most Immigrants from Latin America in Michigan
| City | Latin America | vs State | vs National | |
| 1. | Detroit | 16,410 | 129,602(12.66%)#1 | 22,649,518(0.07%)#196 |
| 2. | Grand Rapids | 10,402 | 129,602(8.03%)#2 | 22,649,518(0.05%)#321 |
| 3. | Wyoming | 6,605 | 129,602(5.10%)#3 | 22,649,518(0.03%)#514 |
| 4. | Pontiac | 3,335 | 129,602(2.57%)#4 | 22,649,518(0.01%)#921 |
| 5. | Lincoln Park | 3,049 | 129,602(2.35%)#5 | 22,649,518(0.01%)#989 |
| 6. | Lansing | 2,899 | 129,602(2.24%)#6 | 22,649,518(0.01%)#1,030 |
| 7. | Rochester Hills | 2,012 | 129,602(1.55%)#7 | 22,649,518(0.01%)#1,338 |
| 8. | Ann Arbor | 1,638 | 129,602(1.26%)#8 | 22,649,518(0.01%)#1,535 |
| 9. | Kentwood | 1,364 | 129,602(1.05%)#9 | 22,649,518(0.01%)#1,744 |
| 10. | Battle Creek | 1,248 | 129,602(0.96%)#10 | 22,649,518(0.01%)#1,849 |
| 11. | Kalamazoo | 1,245 | 129,602(0.96%)#11 | 22,649,518(0.01%)#1,853 |
| 12. | Troy | 1,222 | 129,602(0.94%)#12 | 22,649,518(0.01%)#1,880 |
| 13. | Novi | 1,160 | 129,602(0.90%)#13 | 22,649,518(0.01%)#1,950 |
| 14. | Melvindale | 1,124 | 129,602(0.87%)#14 | 22,649,518(0.00%)#1,986 |
| 15. | Holland | 1,121 | 129,602(0.86%)#15 | 22,649,518(0.00%)#1,989 |
| 16. | Sturgis | 1,024 | 129,602(0.79%)#16 | 22,649,518(0.00%)#2,106 |
| 17. | Auburn Hills | 992 | 129,602(0.77%)#17 | 22,649,518(0.00%)#2,152 |
| 18. | Westland | 959 | 129,602(0.74%)#18 | 22,649,518(0.00%)#2,203 |
| 19. | Taylor | 879 | 129,602(0.68%)#19 | 22,649,518(0.00%)#2,318 |
| 20. | Muskegon | 839 | 129,602(0.65%)#20 | 22,649,518(0.00%)#2,384 |
| 21. | Livonia | 810 | 129,602(0.62%)#21 | 22,649,518(0.00%)#2,437 |
| 22. | Sterling Heights | 808 | 129,602(0.62%)#22 | 22,649,518(0.00%)#2,442 |
| 23. | Farmington Hills | 804 | 129,602(0.62%)#23 | 22,649,518(0.00%)#2,451 |
| 24. | Flint | 781 | 129,602(0.60%)#24 | 22,649,518(0.00%)#2,502 |
| 25. | Portage | 760 | 129,602(0.59%)#25 | 22,649,518(0.00%)#2,553 |
| 26. | Royal Oak | 690 | 129,602(0.53%)#26 | 22,649,518(0.00%)#2,707 |
| 27. | Grosse Pointe Farms | 630 | 129,602(0.49%)#27 | 22,649,518(0.00%)#2,845 |
| 28. | Imlay City | 618 | 129,602(0.48%)#28 | 22,649,518(0.00%)#2,877 |
| 29. | Southfield | 611 | 129,602(0.47%)#29 | 22,649,518(0.00%)#2,895 |
| 30. | Adrian | 599 | 129,602(0.46%)#30 | 22,649,518(0.00%)#2,929 |
| 31. | Warren | 590 | 129,602(0.46%)#31 | 22,649,518(0.00%)#2,959 |
| 32. | Dearborn Heights | 535 | 129,602(0.41%)#32 | 22,649,518(0.00%)#3,155 |
| 33. | Coldwater | 534 | 129,602(0.41%)#33 | 22,649,518(0.00%)#3,163 |
| 34. | Dearborn | 480 | 129,602(0.37%)#34 | 22,649,518(0.00%)#3,360 |
| 35. | Allen Park | 411 | 129,602(0.32%)#35 | 22,649,518(0.00%)#3,672 |
| 36. | Okemos | 376 | 129,602(0.29%)#36 | 22,649,518(0.00%)#3,853 |
| 37. | Wixom | 368 | 129,602(0.28%)#37 | 22,649,518(0.00%)#3,907 |
| 38. | Shelby | 362 | 129,602(0.28%)#38 | 22,649,518(0.00%)#3,942 |
| 39. | Birmingham | 351 | 129,602(0.27%)#39 | 22,649,518(0.00%)#3,998 |
| 40. | East Lansing | 350 | 129,602(0.27%)#40 | 22,649,518(0.00%)#4,009 |
| 41. | Cutlerville | 346 | 129,602(0.27%)#41 | 22,649,518(0.00%)#4,039 |
| 42. | Roseville | 338 | 129,602(0.26%)#42 | 22,649,518(0.00%)#4,081 |
| 43. | Howell | 334 | 129,602(0.26%)#43 | 22,649,518(0.00%)#4,111 |
| 44. | Midland | 309 | 129,602(0.24%)#44 | 22,649,518(0.00%)#4,267 |
| 45. | Southgate | 309 | 129,602(0.24%)#45 | 22,649,518(0.00%)#4,268 |
| 46. | Waverly | 304 | 129,602(0.23%)#46 | 22,649,518(0.00%)#4,301 |
| 47. | Mount Pleasant | 304 | 129,602(0.23%)#47 | 22,649,518(0.00%)#4,302 |
| 48. | Holt | 303 | 129,602(0.23%)#48 | 22,649,518(0.00%)#4,310 |
| 49. | St Clair Shores | 299 | 129,602(0.23%)#49 | 22,649,518(0.00%)#4,332 |
| 50. | Walker | 295 | 129,602(0.23%)#50 | 22,649,518(0.00%)#4,364 |
| 51. | Bangor | 290 | 129,602(0.22%)#51 | 22,649,518(0.00%)#4,397 |
| 52. | River Rouge | 286 | 129,602(0.22%)#52 | 22,649,518(0.00%)#4,434 |
| 53. | Eastpointe | 281 | 129,602(0.22%)#53 | 22,649,518(0.00%)#4,461 |
| 54. | Benton Heights | 277 | 129,602(0.21%)#54 | 22,649,518(0.00%)#4,500 |
| 55. | Kent City | 273 | 129,602(0.21%)#55 | 22,649,518(0.00%)#4,529 |
| 56. | Haslett | 268 | 129,602(0.21%)#56 | 22,649,518(0.00%)#4,567 |
| 57. | Eastwood | 265 | 129,602(0.20%)#57 | 22,649,518(0.00%)#4,591 |
| 58. | Ionia | 243 | 129,602(0.19%)#58 | 22,649,518(0.00%)#4,763 |
| 59. | Buena Vista | 243 | 129,602(0.19%)#59 | 22,649,518(0.00%)#4,766 |
| 60. | Romulus | 233 | 129,602(0.18%)#60 | 22,649,518(0.00%)#4,865 |
| 61. | Saginaw | 212 | 129,602(0.16%)#61 | 22,649,518(0.00%)#5,081 |
| 62. | Hartford | 205 | 129,602(0.16%)#62 | 22,649,518(0.00%)#5,181 |
| 63. | Marquette | 204 | 129,602(0.16%)#63 | 22,649,518(0.00%)#5,186 |
| 64. | Grandville | 202 | 129,602(0.16%)#64 | 22,649,518(0.00%)#5,202 |
| 65. | St Ignace | 202 | 129,602(0.16%)#65 | 22,649,518(0.00%)#5,209 |
| 66. | Oak Park | 199 | 129,602(0.15%)#66 | 22,649,518(0.00%)#5,232 |
| 67. | Greenville | 196 | 129,602(0.15%)#67 | 22,649,518(0.00%)#5,276 |
| 68. | Berrien Springs | 195 | 129,602(0.15%)#68 | 22,649,518(0.00%)#5,298 |
| 69. | Madison Heights | 191 | 129,602(0.15%)#69 | 22,649,518(0.00%)#5,340 |
| 70. | Ferndale | 190 | 129,602(0.15%)#70 | 22,649,518(0.00%)#5,352 |
| 71. | Beecher | 188 | 129,602(0.15%)#71 | 22,649,518(0.00%)#5,388 |
| 72. | Ecorse | 185 | 129,602(0.14%)#72 | 22,649,518(0.00%)#5,424 |
| 73. | Rochester | 180 | 129,602(0.14%)#73 | 22,649,518(0.00%)#5,482 |
| 74. | Wyandotte | 175 | 129,602(0.14%)#74 | 22,649,518(0.00%)#5,572 |
| 75. | Wayne | 166 | 129,602(0.13%)#75 | 22,649,518(0.00%)#5,718 |
| 76. | Ypsilanti | 164 | 129,602(0.13%)#76 | 22,649,518(0.00%)#5,762 |
| 77. | Port Huron | 159 | 129,602(0.12%)#77 | 22,649,518(0.00%)#5,843 |
| 78. | Comstock Park | 149 | 129,602(0.11%)#78 | 22,649,518(0.00%)#6,001 |
| 79. | Jackson | 148 | 129,602(0.11%)#79 | 22,649,518(0.00%)#6,015 |
| 80. | Fennville | 148 | 129,602(0.11%)#80 | 22,649,518(0.00%)#6,029 |
| 81. | Byron Center | 147 | 129,602(0.11%)#81 | 22,649,518(0.00%)#6,036 |
| 82. | Forest Hills | 146 | 129,602(0.11%)#82 | 22,649,518(0.00%)#6,051 |
| 83. | Bridgeport | 145 | 129,602(0.11%)#83 | 22,649,518(0.00%)#6,075 |
| 84. | Inkster | 140 | 129,602(0.11%)#84 | 22,649,518(0.00%)#6,157 |
| 85. | Farmington | 140 | 129,602(0.11%)#85 | 22,649,518(0.00%)#6,159 |
| 86. | Niles | 137 | 129,602(0.11%)#86 | 22,649,518(0.00%)#6,214 |
| 87. | Hillsdale | 136 | 129,602(0.10%)#87 | 22,649,518(0.00%)#6,231 |
| 88. | Hart | 134 | 129,602(0.10%)#88 | 22,649,518(0.00%)#6,266 |
| 89. | Mackinac Island | 134 | 129,602(0.10%)#89 | 22,649,518(0.00%)#6,272 |
| 90. | Allendale | 133 | 129,602(0.10%)#90 | 22,649,518(0.00%)#6,273 |
| 91. | Muskegon Heights | 132 | 129,602(0.10%)#91 | 22,649,518(0.00%)#6,299 |
| 92. | Dowagiac | 131 | 129,602(0.10%)#92 | 22,649,518(0.00%)#6,329 |
| 93. | Oxford | 131 | 129,602(0.10%)#93 | 22,649,518(0.00%)#6,332 |
| 94. | Walled Lake | 125 | 129,602(0.10%)#94 | 22,649,518(0.00%)#6,444 |
| 95. | Sault Ste Marie | 122 | 129,602(0.09%)#95 | 22,649,518(0.00%)#6,503 |
| 96. | St Joseph | 119 | 129,602(0.09%)#96 | 22,649,518(0.00%)#6,585 |
| 97. | Saline | 118 | 129,602(0.09%)#97 | 22,649,518(0.00%)#6,600 |
| 98. | Romeo | 117 | 129,602(0.09%)#98 | 22,649,518(0.00%)#6,628 |
| 99. | Grosse Pointe Woods | 114 | 129,602(0.09%)#99 | 22,649,518(0.00%)#6,687 |
| 100. | Bronson | 114 | 129,602(0.09%)#100 | 22,649,518(0.00%)#6,705 |
Common Questions
What are the Top 10 Cities with the Most Immigrants from Latin America in Michigan?
Top 10 Cities with the Most Immigrants from Latin America in Michigan are:
#1
16,410
#2
10,402
#3
6,605
#4
3,335
#5
3,049
#6
2,899
#7
2,012
#8
1,638
#9
1,364
#10
1,248
What city has the Most Immigrants from Latin America in Michigan?
Detroit has the Most Immigrants from Latin America in Michigan with 16,410.
What is the Total Immigrants from Latin America in the State of Michigan?
Total Immigrants from Latin America in Michigan is 129,602.
What is the Total Immigrants from Latin America in the United States?
Total Immigrants from Latin America in the United States is 22,649,518.