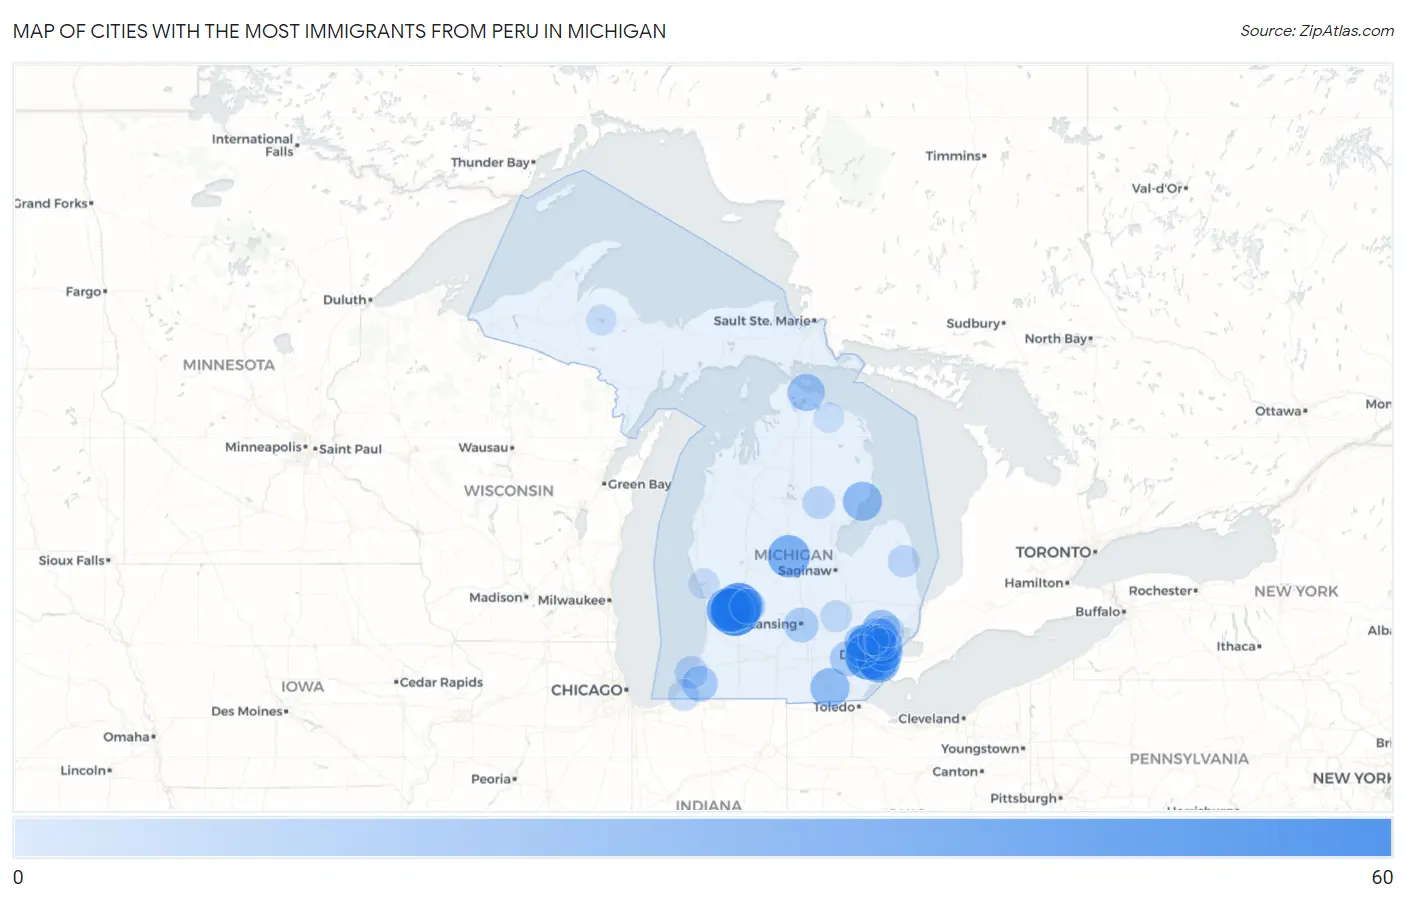
Cities with the Most Immigrants from Peru in Michigan
RELATED REPORTS & OPTIONS
Peru
Michigan
Compare Cities
Map of Cities with the Most Immigrants from Peru in Michigan
0
60
Cities with the Most Immigrants from Peru in Michigan
| City | Peru | vs State | vs National | |
| 1. | Wyoming | 55 | 1,298(4.24%)#1 | 461,322(0.01%)#1,170 |
| 2. | Livonia | 48 | 1,298(3.70%)#2 | 461,322(0.01%)#1,281 |
| 3. | Westland | 48 | 1,298(3.70%)#3 | 461,322(0.01%)#1,282 |
| 4. | Grand Rapids | 47 | 1,298(3.62%)#4 | 461,322(0.01%)#1,295 |
| 5. | Jenison | 40 | 1,298(3.08%)#5 | 461,322(0.01%)#1,416 |
| 6. | Grandville | 39 | 1,298(3.00%)#6 | 461,322(0.01%)#1,433 |
| 7. | Lincoln Park | 35 | 1,298(2.70%)#7 | 461,322(0.01%)#1,515 |
| 8. | Mount Pleasant | 34 | 1,298(2.62%)#8 | 461,322(0.01%)#1,542 |
| 9. | Allen Park | 31 | 1,298(2.39%)#9 | 461,322(0.01%)#1,623 |
| 10. | Ferndale | 27 | 1,298(2.08%)#10 | 461,322(0.01%)#1,752 |
| 11. | Adrian | 25 | 1,298(1.93%)#11 | 461,322(0.01%)#1,810 |
| 12. | East Tawas | 25 | 1,298(1.93%)#12 | 461,322(0.01%)#1,829 |
| 13. | Birmingham | 24 | 1,298(1.85%)#13 | 461,322(0.01%)#1,844 |
| 14. | Detroit | 21 | 1,298(1.62%)#14 | 461,322(0.00%)#1,928 |
| 15. | Farmington Hills | 21 | 1,298(1.62%)#15 | 461,322(0.00%)#1,931 |
| 16. | Rochester Hills | 21 | 1,298(1.62%)#16 | 461,322(0.00%)#1,934 |
| 17. | Cheboygan | 20 | 1,298(1.54%)#17 | 461,322(0.00%)#1,990 |
| 18. | Berrien Springs | 15 | 1,298(1.16%)#18 | 461,322(0.00%)#2,216 |
| 19. | Ann Arbor | 14 | 1,298(1.08%)#19 | 461,322(0.00%)#2,225 |
| 20. | Forest Hills | 14 | 1,298(1.08%)#20 | 461,322(0.00%)#2,240 |
| 21. | Lansing | 13 | 1,298(1.00%)#21 | 461,322(0.00%)#2,282 |
| 22. | Novi | 13 | 1,298(1.00%)#22 | 461,322(0.00%)#2,286 |
| 23. | Troy | 8 | 1,298(0.62%)#23 | 461,322(0.00%)#2,589 |
| 24. | St Joseph | 8 | 1,298(0.62%)#24 | 461,322(0.00%)#2,613 |
| 25. | Royal Oak | 7 | 1,298(0.54%)#25 | 461,322(0.00%)#2,661 |
| 26. | Plymouth | 7 | 1,298(0.54%)#26 | 461,322(0.00%)#2,691 |
| 27. | West Branch | 7 | 1,298(0.54%)#27 | 461,322(0.00%)#2,722 |
| 28. | Deckerville | 6 | 1,298(0.46%)#28 | 461,322(0.00%)#2,808 |
| 29. | Utica | 5 | 1,298(0.39%)#29 | 461,322(0.00%)#2,851 |
| 30. | Pleasant Ridge | 5 | 1,298(0.39%)#30 | 461,322(0.00%)#2,862 |
| 31. | Three Oaks | 5 | 1,298(0.39%)#31 | 461,322(0.00%)#2,876 |
| 32. | Byron | 5 | 1,298(0.39%)#32 | 461,322(0.00%)#2,881 |
| 33. | North Muskegon | 2 | 1,298(0.15%)#33 | 461,322(0.00%)#3,045 |
| 34. | Michigamme | 2 | 1,298(0.15%)#34 | 461,322(0.00%)#3,096 |
| 35. | Millersburg | 2 | 1,298(0.15%)#35 | 461,322(0.00%)#3,097 |
| 36. | Bingham Farms | 1 | 1,298(0.08%)#36 | 461,322(0.00%)#3,118 |
Common Questions
What are the Top 10 Cities with the Most Immigrants from Peru in Michigan?
Top 10 Cities with the Most Immigrants from Peru in Michigan are:
#1
55
#2
48
#3
48
#4
47
#5
40
#6
39
#7
35
#8
34
#9
31
#10
27
What city has the Most Immigrants from Peru in Michigan?
Wyoming has the Most Immigrants from Peru in Michigan with 55.
What is the Total Immigrants from Peru in the State of Michigan?
Total Immigrants from Peru in Michigan is 1,298.
What is the Total Immigrants from Peru in the United States?
Total Immigrants from Peru in the United States is 461,322.