Cities with the Most Immigrants from Taiwan in Michigan
RELATED REPORTS & OPTIONS
Taiwan
Michigan
Compare Cities
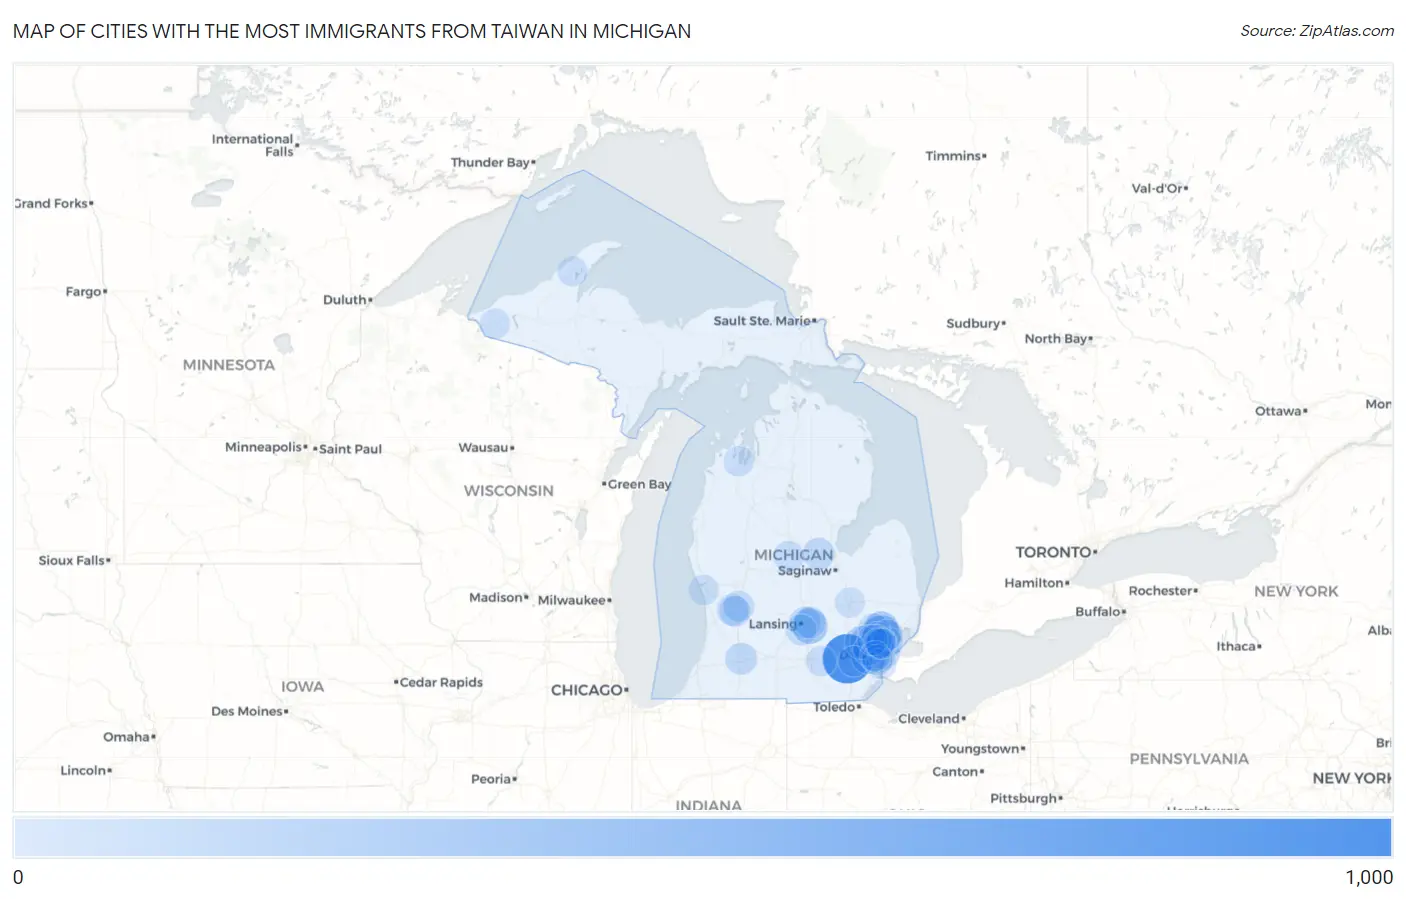
Map of Cities with the Most Immigrants from Taiwan in Michigan
0
1,000
Cities with the Most Immigrants from Taiwan in Michigan
| City | Taiwan | vs State | vs National | |
| 1. | Ann Arbor | 874 | 4,450(19.64%)#1 | 376,336(0.23%)#63 |
| 2. | Troy | 395 | 4,450(8.88%)#2 | 376,336(0.10%)#144 |
| 3. | Okemos | 218 | 4,450(4.90%)#3 | 376,336(0.06%)#252 |
| 4. | Westland | 217 | 4,450(4.88%)#4 | 376,336(0.06%)#253 |
| 5. | Rochester Hills | 204 | 4,450(4.58%)#5 | 376,336(0.05%)#270 |
| 6. | Farmington Hills | 198 | 4,450(4.45%)#6 | 376,336(0.05%)#273 |
| 7. | Novi | 129 | 4,450(2.90%)#7 | 376,336(0.03%)#402 |
| 8. | Detroit | 104 | 4,450(2.34%)#8 | 376,336(0.03%)#482 |
| 9. | Dearborn | 104 | 4,450(2.34%)#9 | 376,336(0.03%)#483 |
| 10. | Midland | 75 | 4,450(1.69%)#10 | 376,336(0.02%)#636 |
| 11. | Royal Oak | 74 | 4,450(1.66%)#11 | 376,336(0.02%)#643 |
| 12. | Kalamazoo | 70 | 4,450(1.57%)#12 | 376,336(0.02%)#675 |
| 13. | East Lansing | 61 | 4,450(1.37%)#13 | 376,336(0.02%)#762 |
| 14. | Haslett | 59 | 4,450(1.33%)#14 | 376,336(0.02%)#780 |
| 15. | Grandville | 51 | 4,450(1.15%)#15 | 376,336(0.01%)#874 |
| 16. | Grand Rapids | 37 | 4,450(0.83%)#16 | 376,336(0.01%)#1,052 |
| 17. | Livonia | 37 | 4,450(0.83%)#17 | 376,336(0.01%)#1,054 |
| 18. | Holt | 37 | 4,450(0.83%)#18 | 376,336(0.01%)#1,063 |
| 19. | Birmingham | 35 | 4,450(0.79%)#19 | 376,336(0.01%)#1,106 |
| 20. | Wyoming | 31 | 4,450(0.70%)#20 | 376,336(0.01%)#1,187 |
| 21. | Warren | 25 | 4,450(0.56%)#21 | 376,336(0.01%)#1,338 |
| 22. | Auburn Hills | 25 | 4,450(0.56%)#22 | 376,336(0.01%)#1,355 |
| 23. | Mount Pleasant | 25 | 4,450(0.56%)#23 | 376,336(0.01%)#1,357 |
| 24. | Sterling Heights | 22 | 4,450(0.49%)#24 | 376,336(0.01%)#1,432 |
| 25. | Beverly Hills | 20 | 4,450(0.45%)#25 | 376,336(0.01%)#1,527 |
| 26. | Oak Park | 17 | 4,450(0.38%)#26 | 376,336(0.00%)#1,646 |
| 27. | Ypsilanti | 16 | 4,450(0.36%)#27 | 376,336(0.00%)#1,701 |
| 28. | Wyandotte | 13 | 4,450(0.29%)#28 | 376,336(0.00%)#1,876 |
| 29. | Huntington Woods | 12 | 4,450(0.27%)#29 | 376,336(0.00%)#1,950 |
| 30. | Greilickville | 12 | 4,450(0.27%)#30 | 376,336(0.00%)#1,968 |
| 31. | Grass Lake | 12 | 4,450(0.27%)#31 | 376,336(0.00%)#1,970 |
| 32. | Norton Shores | 11 | 4,450(0.25%)#32 | 376,336(0.00%)#1,993 |
| 33. | Allen Park | 8 | 4,450(0.18%)#33 | 376,336(0.00%)#2,201 |
| 34. | Franklin | 8 | 4,450(0.18%)#34 | 376,336(0.00%)#2,239 |
| 35. | Flint | 7 | 4,450(0.16%)#35 | 376,336(0.00%)#2,255 |
| 36. | Dearborn Heights | 7 | 4,450(0.16%)#36 | 376,336(0.00%)#2,256 |
| 37. | Houghton | 5 | 4,450(0.11%)#37 | 376,336(0.00%)#2,424 |
| 38. | Pleasant Ridge | 4 | 4,450(0.09%)#38 | 376,336(0.00%)#2,476 |
| 39. | Wakefield | 4 | 4,450(0.09%)#39 | 376,336(0.00%)#2,483 |
Common Questions
What are the Top 10 Cities with the Most Immigrants from Taiwan in Michigan?
Top 10 Cities with the Most Immigrants from Taiwan in Michigan are:
#1
874
#2
395
#3
218
#4
217
#5
204
#6
198
#7
129
#8
104
#9
104
#10
75
What city has the Most Immigrants from Taiwan in Michigan?
Ann Arbor has the Most Immigrants from Taiwan in Michigan with 874.
What is the Total Immigrants from Taiwan in the State of Michigan?
Total Immigrants from Taiwan in Michigan is 4,450.
What is the Total Immigrants from Taiwan in the United States?
Total Immigrants from Taiwan in the United States is 376,336.