Cities with the Highest Percentage of Immigrants from Vietnam in Michigan
RELATED REPORTS & OPTIONS
Vietnam
Michigan
Compare Cities
Map of Cities with the Highest Percentage of Immigrants from Vietnam in Michigan
0.00%
2.50%
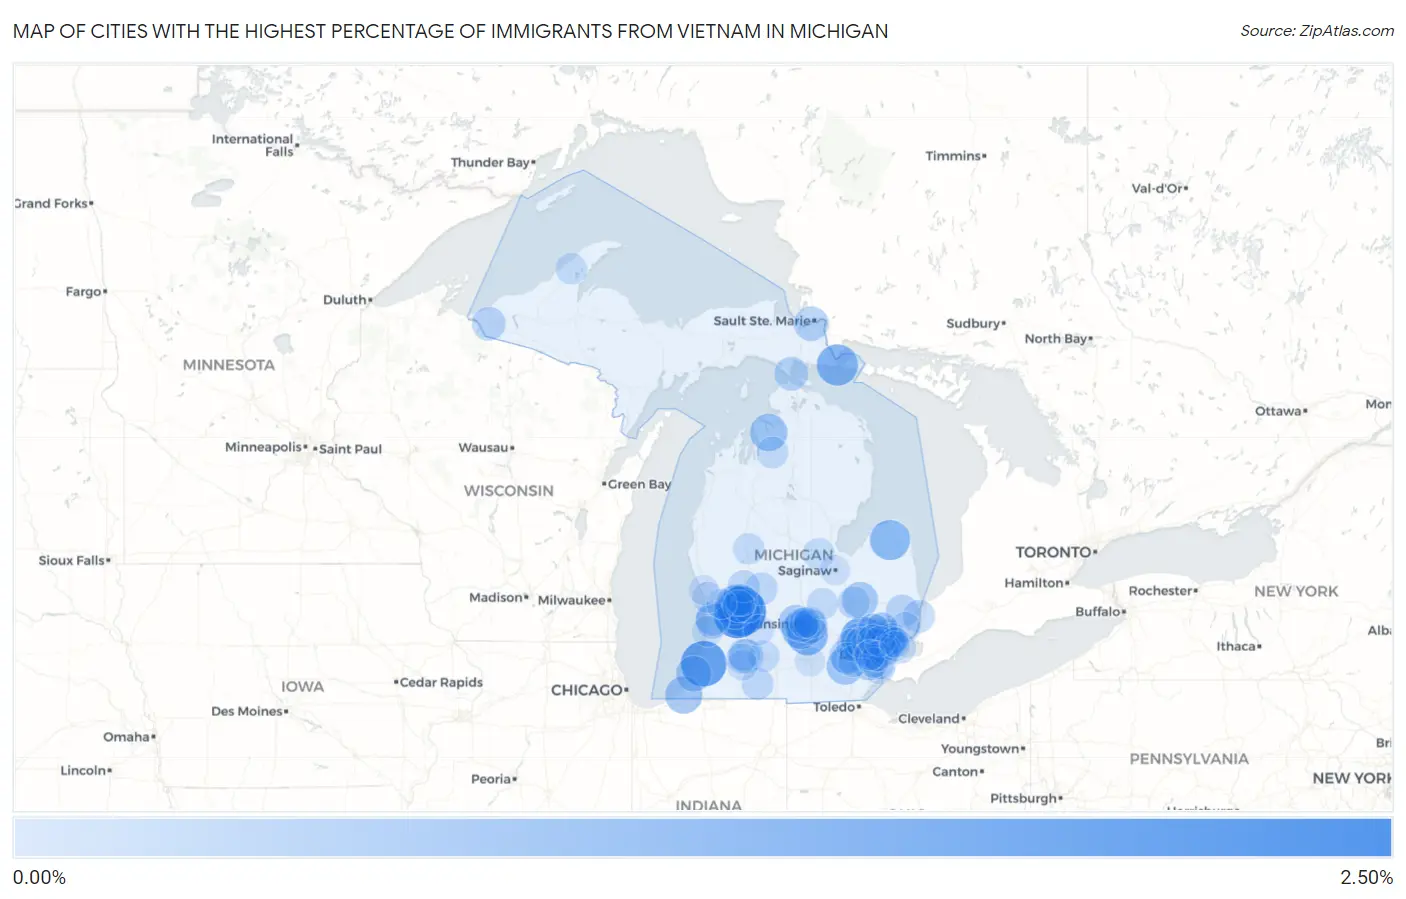
Cities with the Highest Percentage of Immigrants from Vietnam in Michigan
| City | Vietnam | vs State | vs National | |
| 1. | Kentwood | 2.35% | 0.13%(+2.23)#-1 | 0.41%(+1.94)#0 |
| 2. | Cutlerville | 1.99% | 0.13%(+1.86)#0 | 0.41%(+1.58)#1 |
| 3. | Paw Paw Lake | 1.87% | 0.13%(+1.74)#1 | 0.41%(+1.46)#2 |
| 4. | Walled Lake | 1.65% | 0.13%(+1.53)#2 | 0.41%(+1.24)#3 |
| 5. | De Tour Village | 1.33% | 0.13%(+1.20)#3 | 0.41%(+0.920)#4 |
| 6. | Mason | 1.26% | 0.13%(+1.13)#4 | 0.41%(+0.848)#5 |
| 7. | Bad Axe | 1.19% | 0.13%(+1.06)#5 | 0.41%(+0.782)#6 |
| 8. | Walker | 1.08% | 0.13%(+0.954)#6 | 0.41%(+0.673)#7 |
| 9. | Oak Park | 0.99% | 0.13%(+0.861)#7 | 0.41%(+0.579)#8 |
| 10. | Holt | 0.98% | 0.13%(+0.855)#8 | 0.41%(+0.574)#9 |
| 11. | East Jordan | 0.85% | 0.13%(+0.727)#9 | 0.41%(+0.445)#10 |
| 12. | Three Oaks | 0.83% | 0.13%(+0.702)#10 | 0.41%(+0.421)#11 |
| 13. | Saline | 0.78% | 0.13%(+0.654)#11 | 0.41%(+0.372)#12 |
| 14. | Davison | 0.68% | 0.13%(+0.558)#12 | 0.41%(+0.277)#13 |
| 15. | Fair Plain | 0.65% | 0.13%(+0.528)#13 | 0.41%(+0.246)#14 |
| 16. | Center Line | 0.64% | 0.13%(+0.510)#14 | 0.41%(+0.228)#15 |
| 17. | Wyoming | 0.63% | 0.13%(+0.505)#15 | 0.41%(+0.223)#16 |
| 18. | Waverly | 0.59% | 0.13%(+0.468)#22 | 0.41%(+0.187)#1,198 |
| 19. | Northville | 0.59% | 0.13%(+0.465)#23 | 0.41%(+0.184)#1,199 |
| 20. | Romulus | 0.57% | 0.13%(+0.445)#47 | 0.41%(+0.163)#2,477 |
| 21. | Okemos | 0.55% | 0.13%(+0.422)#48 | 0.41%(+0.140)#2,478 |
| 22. | Sault Ste Marie | 0.51% | 0.13%(+0.389)#49 | 0.41%(+0.107)#2,479 |
| 23. | Holland | 0.48% | 0.13%(+0.354)#50 | 0.41%(+0.072)#2,480 |
| 24. | Troy | 0.48% | 0.13%(+0.351)#51 | 0.41%(+0.070)#2,481 |
| 25. | Comstock Northwest | 0.47% | 0.13%(+0.342)#52 | 0.41%(+0.060)#2,482 |
| 26. | Barton Hills | 0.45% | 0.13%(+0.324)#53 | 0.41%(+0.043)#2,483 |
| 27. | Warren | 0.45% | 0.13%(+0.323)#54 | 0.41%(+0.042)#2,484 |
| 28. | St Ignace | 0.45% | 0.13%(+0.322)#55 | 0.41%(+0.040)#2,485 |
| 29. | Madison Heights | 0.43% | 0.13%(+0.309)#56 | 0.41%(+0.027)#2,636 |
| 30. | Beechwood | 0.43% | 0.13%(+0.302)#57 | 0.41%(+0.020)#2,637 |
| 31. | Lansing | 0.42% | 0.13%(+0.293)#58 | 0.41%(+0.011)#2,638 |
| 32. | Wixom | 0.41% | 0.13%(+0.286)#59 | 0.41%(+0.004)#2,639 |
| 33. | Bessemer | 0.41% | 0.13%(+0.284)#60 | 0.41%(+0.002)#2,640 |
| 34. | Memphis | 0.35% | 0.13%(+0.222)#61 | 0.41%(-0.060)#2,641 |
| 35. | Greenville | 0.29% | 0.13%(+0.167)#62 | 0.41%(-0.114)#2,642 |
| 36. | St Clair | 0.29% | 0.13%(+0.165)#63 | 0.41%(-0.117)#2,643 |
| 37. | Livonia | 0.28% | 0.13%(+0.156)#64 | 0.41%(-0.125)#2,786 |
| 38. | South Lyon | 0.28% | 0.13%(+0.154)#65 | 0.41%(-0.128)#2,787 |
| 39. | Forest Hills | 0.28% | 0.13%(+0.152)#66 | 0.41%(-0.130)#2,788 |
| 40. | Clawson | 0.27% | 0.13%(+0.146)#67 | 0.41%(-0.135)#2,789 |
| 41. | Ann Arbor | 0.26% | 0.13%(+0.132)#68 | 0.41%(-0.150)#2,790 |
| 42. | Parchment | 0.24% | 0.13%(+0.119)#69 | 0.41%(-0.163)#2,791 |
| 43. | Comstock Park | 0.24% | 0.13%(+0.115)#70 | 0.41%(-0.167)#2,792 |
| 44. | Sterling Heights | 0.24% | 0.13%(+0.111)#71 | 0.41%(-0.171)#2,793 |
| 45. | Burton | 0.23% | 0.13%(+0.104)#72 | 0.41%(-0.178)#2,794 |
| 46. | Cedar Springs | 0.22% | 0.13%(+0.093)#73 | 0.41%(-0.188)#2,795 |
| 47. | Grand Rapids | 0.22% | 0.13%(+0.091)#74 | 0.41%(-0.191)#2,946 |
| 48. | Colon | 0.22% | 0.13%(+0.090)#75 | 0.41%(-0.192)#2,947 |
| 49. | Haslett | 0.21% | 0.13%(+0.089)#76 | 0.41%(-0.193)#2,948 |
| 50. | Pontiac | 0.21% | 0.13%(+0.087)#77 | 0.41%(-0.195)#2,949 |
| 51. | Village Of Grosse Pointe Shores | 0.19% | 0.13%(+0.066)#78 | 0.41%(-0.216)#2,950 |
| 52. | Mancelona | 0.18% | 0.13%(+0.059)#79 | 0.41%(-0.223)#2,951 |
| 53. | Bingham Farms | 0.18% | 0.13%(+0.059)#80 | 0.41%(-0.223)#2,952 |
| 54. | Rochester Hills | 0.18% | 0.13%(+0.055)#81 | 0.41%(-0.226)#2,953 |
| 55. | Ypsilanti | 0.16% | 0.13%(+0.037)#82 | 0.41%(-0.244)#2,954 |
| 56. | Midland | 0.16% | 0.13%(+0.037)#83 | 0.41%(-0.245)#2,955 |
| 57. | Northview | 0.16% | 0.13%(+0.036)#84 | 0.41%(-0.246)#2,956 |
| 58. | Farmington Hills | 0.16% | 0.13%(+0.035)#85 | 0.41%(-0.246)#2,957 |
| 59. | Hancock | 0.15% | 0.13%(+0.029)#86 | 0.41%(-0.253)#2,958 |
| 60. | Big Rapids | 0.15% | 0.13%(+0.026)#87 | 0.41%(-0.256)#2,959 |
| 61. | Owosso | 0.14% | 0.13%(+0.017)#88 | 0.41%(-0.265)#2,960 |
| 62. | Battle Creek | 0.14% | 0.13%(+0.017)#89 | 0.41%(-0.265)#2,961 |
| 63. | Southgate | 0.13% | 0.13%(+0.008)#90 | 0.41%(-0.274)#2,962 |
| 64. | Inkster | 0.13% | 0.13%(+0.002)#91 | 0.41%(-0.280)#2,963 |
| 65. | New Baltimore | 0.12% | 0.13%(-0.002)#92 | 0.41%(-0.284)#2,964 |
| 66. | Southfield | 0.10% | 0.13%(-0.024)#93 | 0.41%(-0.305)#2,986 |
| 67. | Novi | 0.10% | 0.13%(-0.026)#94 | 0.41%(-0.307)#2,987 |
| 68. | Fraser | 0.095% | 0.13%(-0.031)#95 | 0.41%(-0.312)#2,988 |
| 69. | Portage | 0.090% | 0.13%(-0.036)#96 | 0.41%(-0.318)#2,989 |
| 70. | Douglas | 0.088% | 0.13%(-0.038)#97 | 0.41%(-0.320)#2,990 |
| 71. | Spring Lake | 0.079% | 0.13%(-0.047)#98 | 0.41%(-0.329)#2,991 |
| 72. | Lake Leann | 0.078% | 0.13%(-0.048)#99 | 0.41%(-0.330)#2,992 |
| 73. | Wyandotte | 0.068% | 0.13%(-0.058)#100 | 0.41%(-0.339)#2,993 |
| 74. | Trenton | 0.065% | 0.13%(-0.061)#101 | 0.41%(-0.342)#2,994 |
| 75. | Rochester | 0.062% | 0.13%(-0.064)#102 | 0.41%(-0.346)#2,995 |
| 76. | Roseville | 0.059% | 0.13%(-0.067)#103 | 0.41%(-0.349)#2,996 |
| 77. | Hastings | 0.053% | 0.13%(-0.073)#104 | 0.41%(-0.354)#2,997 |
| 78. | Westland | 0.052% | 0.13%(-0.074)#105 | 0.41%(-0.356)#2,998 |
| 79. | Hamtramck | 0.047% | 0.13%(-0.079)#106 | 0.41%(-0.361)#2,999 |
| 80. | East Lansing | 0.044% | 0.13%(-0.082)#107 | 0.41%(-0.364)#3,000 |
| 81. | Dearborn Heights | 0.042% | 0.13%(-0.084)#108 | 0.41%(-0.366)#3,001 |
| 82. | Detroit | 0.038% | 0.13%(-0.088)#109 | 0.41%(-0.369)#3,002 |
| 83. | Franklin | 0.038% | 0.13%(-0.088)#110 | 0.41%(-0.370)#3,003 |
| 84. | Auburn Hills | 0.037% | 0.13%(-0.089)#111 | 0.41%(-0.371)#3,004 |
| 85. | Taylor | 0.035% | 0.13%(-0.091)#112 | 0.41%(-0.373)#3,005 |
| 86. | Dearborn | 0.030% | 0.13%(-0.097)#113 | 0.41%(-0.378)#3,006 |
| 87. | Royal Oak | 0.029% | 0.13%(-0.097)#114 | 0.41%(-0.378)#3,007 |
| 88. | Allendale | 0.028% | 0.13%(-0.098)#115 | 0.41%(-0.380)#3,008 |
| 89. | Garden City | 0.026% | 0.13%(-0.100)#116 | 0.41%(-0.382)#3,009 |
| 90. | Kalamazoo | 0.016% | 0.13%(-0.110)#117 | 0.41%(-0.391)#3,010 |
| 91. | Saginaw | 0.014% | 0.13%(-0.113)#118 | 0.41%(-0.394)#3,011 |
| 92. | Norton Shores | 0.012% | 0.13%(-0.114)#119 | 0.41%(-0.396)#3,012 |
| 93. | Grosse Pointe Woods | 0.0061% | 0.13%(-0.120)#120 | 0.41%(-0.402)#3,013 |
| 94. | St Clair Shores | 0.0051% | 0.13%(-0.121)#121 | 0.41%(-0.403)#3,014 |
| 95. | Jackson | 0.0032% | 0.13%(-0.123)#122 | 0.41%(-0.404)#3,015 |
Common Questions
What are the Top 10 Cities with the Highest Percentage of Immigrants from Vietnam in Michigan?
Top 10 Cities with the Highest Percentage of Immigrants from Vietnam in Michigan are:
#1
2.35%
#2
1.99%
#3
1.87%
#4
1.65%
#5
1.33%
#6
1.26%
#7
1.19%
#8
1.08%
#9
0.99%
#10
0.98%
What city has the Highest Percentage of Immigrants from Vietnam in Michigan?
Kentwood has the Highest Percentage of Immigrants from Vietnam in Michigan with 2.35%.
What is the Percentage of Immigrants from Vietnam in the State of Michigan?
Percentage of Immigrants from Vietnam in Michigan is 0.13%.
What is the Percentage of Immigrants from Vietnam in the United States?
Percentage of Immigrants from Vietnam in the United States is 0.41%.