Beechwood, MI
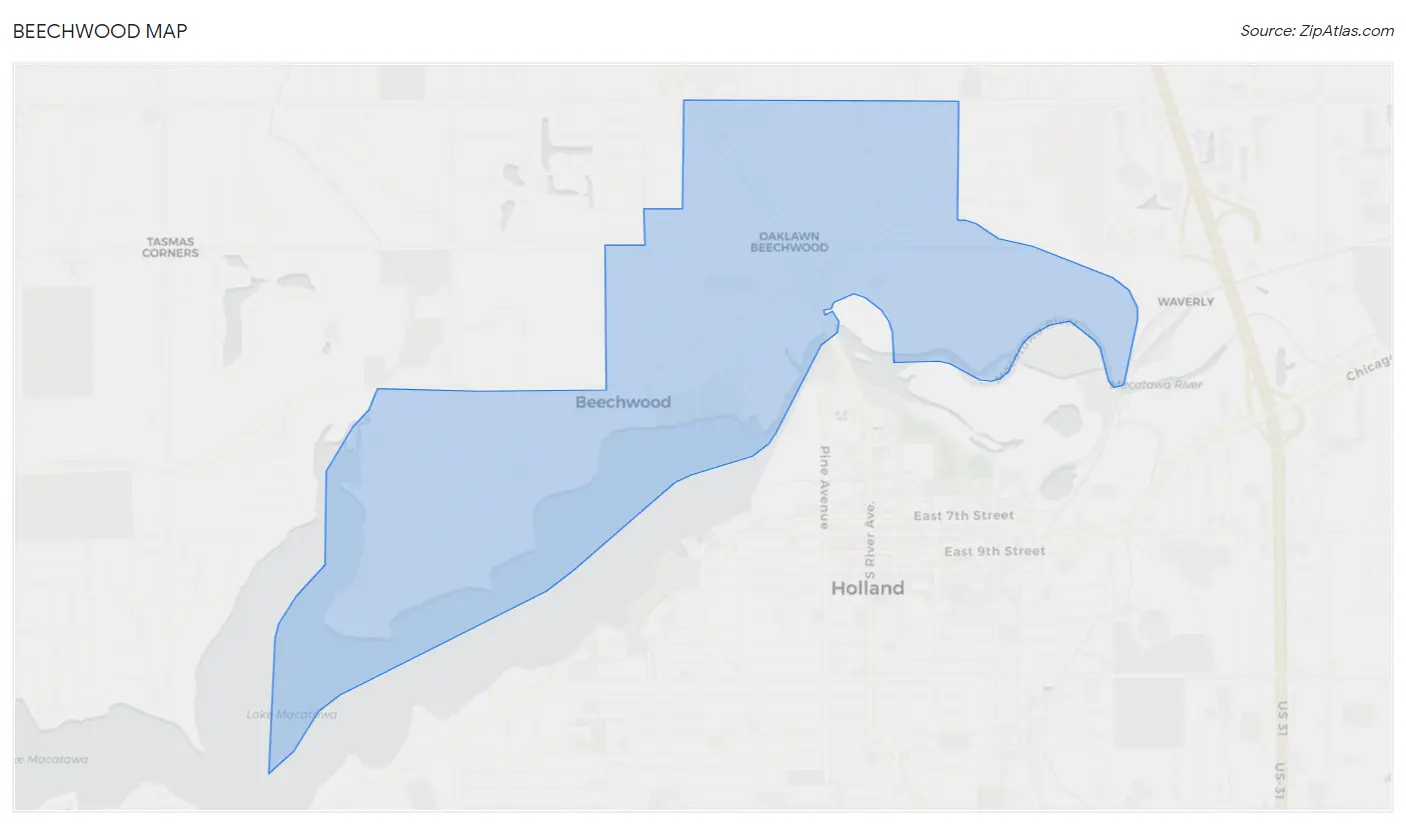
Beechwood Map
Beechwood Overview
2,803
TOTAL POPULATION
1,445
MALE POPULATION
1,358
FEMALE POPULATION
106.41
MALES / 100 FEMALES
93.98
FEMALES / 100 MALES
36.2
MEDIAN AGE
3.2
AVG FAMILY SIZE
2.8
AVG HOUSEHOLD SIZE
$34,997
PER CAPITA INCOME
$60,592
AVG FAMILY INCOME
$63,750
AVG HOUSEHOLD INCOME
26.1%
WAGE / INCOME GAP [ % ]
73.9¢/ $1
WAGE / INCOME GAP [ $ ]
0.50
INEQUALITY / GINI INDEX
1,713
LABOR FORCE [ PEOPLE ]
74.2%
PERCENT IN LABOR FORCE
17.9%
UNEMPLOYMENT RATE
Beechwood Area Codes
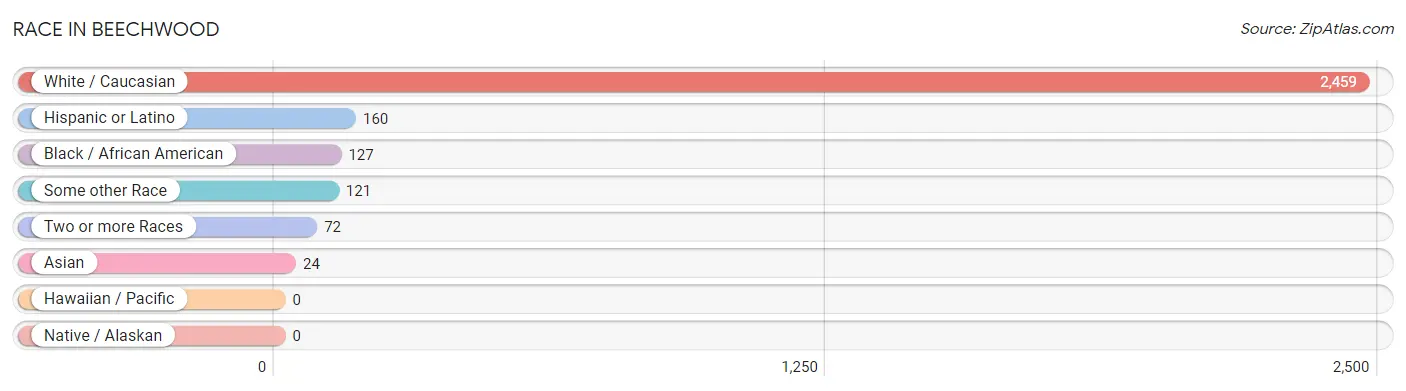
Race in Beechwood
The most populous races in Beechwood are White / Caucasian (2,459 | 87.7%), Hispanic or Latino (160 | 5.7%), and Black / African American (127 | 4.5%).
| Race | # Population | % Population |
| Asian | 24 | 0.9% |
| Black / African American | 127 | 4.5% |
| Hawaiian / Pacific | 0 | 0.0% |
| Hispanic or Latino | 160 | 5.7% |
| Native / Alaskan | 0 | 0.0% |
| White / Caucasian | 2,459 | 87.7% |
| Two or more Races | 72 | 2.6% |
| Some other Race | 121 | 4.3% |
| Total | 2,803 | 100.0% |
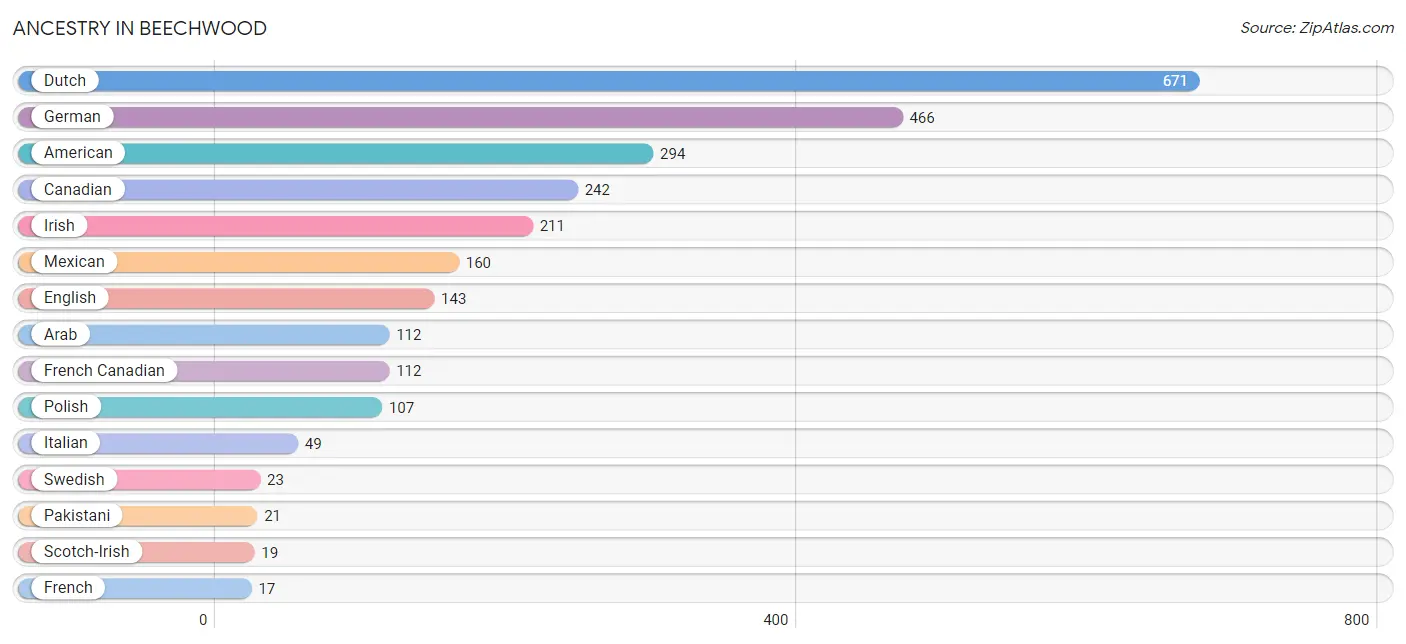
Ancestry in Beechwood
The most populous ancestries reported in Beechwood are Dutch (671 | 23.9%), German (466 | 16.6%), American (294 | 10.5%), Canadian (242 | 8.6%), and Irish (211 | 7.5%), together accounting for 67.2% of all Beechwood residents.
| Ancestry | # Population | % Population |
| American | 294 | 10.5% |
| Arab | 112 | 4.0% |
| Austrian | 12 | 0.4% |
| Blackfeet | 8 | 0.3% |
| Canadian | 242 | 8.6% |
| Cherokee | 8 | 0.3% |
| Danish | 12 | 0.4% |
| Dutch | 671 | 23.9% |
| English | 143 | 5.1% |
| French | 17 | 0.6% |
| French Canadian | 112 | 4.0% |
| German | 466 | 16.6% |
| Irish | 211 | 7.5% |
| Italian | 49 | 1.8% |
| Malaysian | 10 | 0.4% |
| Mexican | 160 | 5.7% |
| Pakistani | 21 | 0.7% |
| Polish | 107 | 3.8% |
| Scotch-Irish | 19 | 0.7% |
| Scottish | 15 | 0.5% |
| Sri Lankan | 17 | 0.6% |
| Swedish | 23 | 0.8% |
| Swiss | 16 | 0.6% | View All 23 Rows |
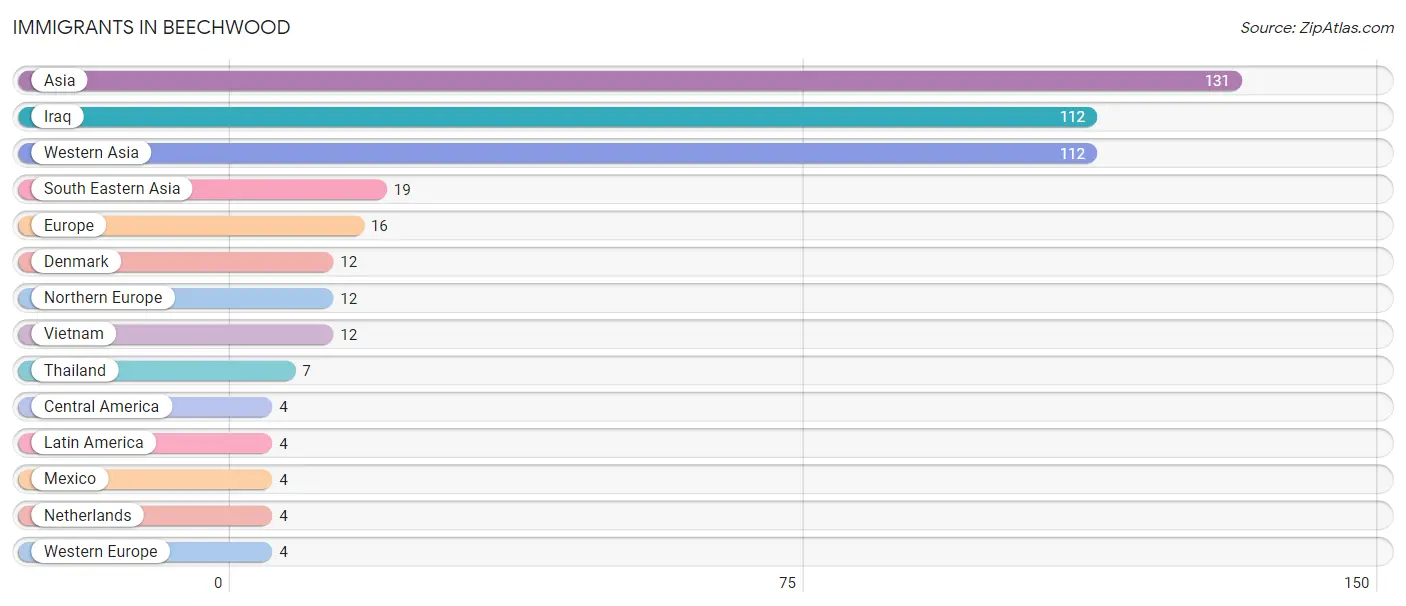
Immigrants in Beechwood
The most numerous immigrant groups reported in Beechwood came from Asia (131 | 4.7%), Iraq (112 | 4.0%), Western Asia (112 | 4.0%), South Eastern Asia (19 | 0.7%), and Europe (16 | 0.6%), together accounting for 13.9% of all Beechwood residents.
| Immigration Origin | # Population | % Population |
| Asia | 131 | 4.7% |
| Central America | 4 | 0.1% |
| Denmark | 12 | 0.4% |
| Europe | 16 | 0.6% |
| Iraq | 112 | 4.0% |
| Latin America | 4 | 0.1% |
| Mexico | 4 | 0.1% |
| Netherlands | 4 | 0.1% |
| Northern Europe | 12 | 0.4% |
| South Eastern Asia | 19 | 0.7% |
| Thailand | 7 | 0.3% |
| Vietnam | 12 | 0.4% |
| Western Asia | 112 | 4.0% |
| Western Europe | 4 | 0.1% | View All 14 Rows |
Sex and Age in Beechwood
Sex and Age in Beechwood
The most populous age groups in Beechwood are 10 to 14 Years (188 | 13.0%) for men and 40 to 44 Years (173 | 12.7%) for women.
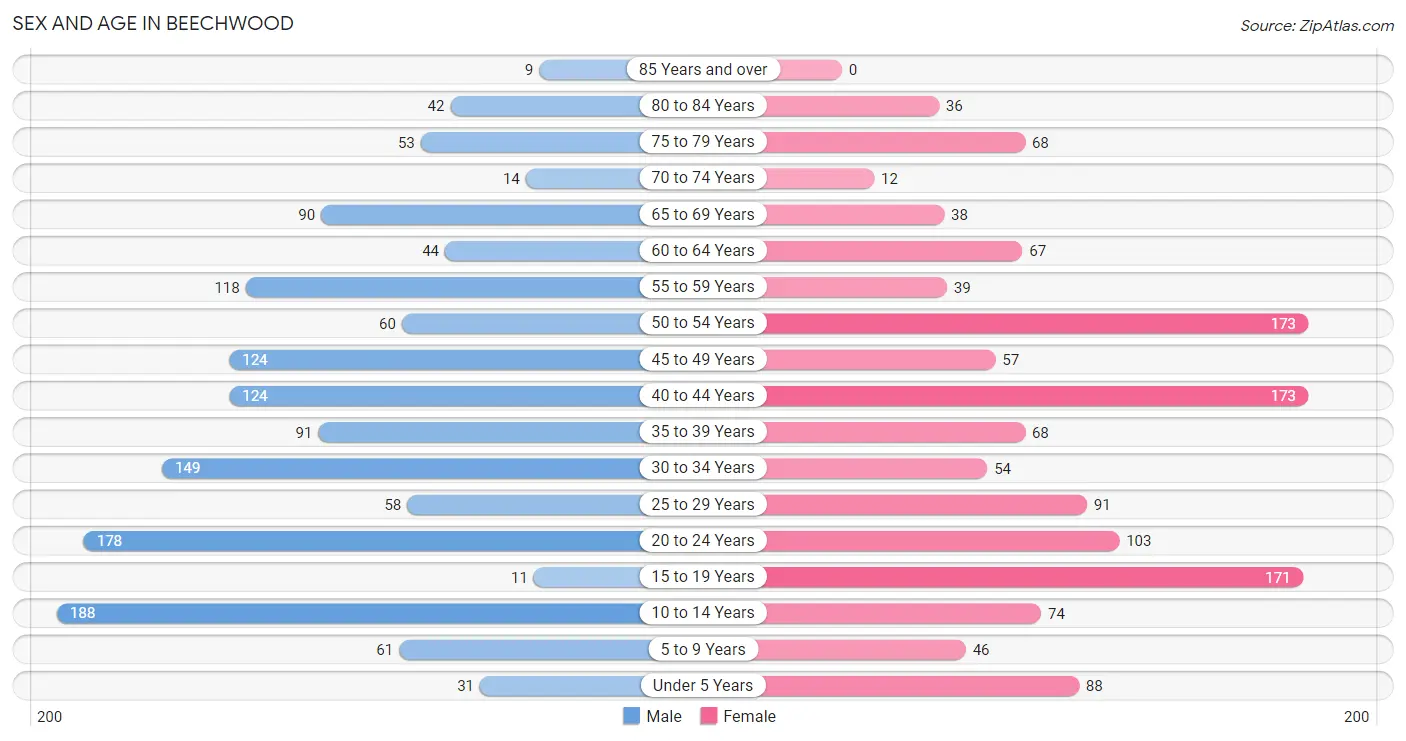
| Age Bracket | Male | Female |
| Under 5 Years | 31 (2.1%) | 88 (6.5%) |
| 5 to 9 Years | 61 (4.2%) | 46 (3.4%) |
| 10 to 14 Years | 188 (13.0%) | 74 (5.4%) |
| 15 to 19 Years | 11 (0.8%) | 171 (12.6%) |
| 20 to 24 Years | 178 (12.3%) | 103 (7.6%) |
| 25 to 29 Years | 58 (4.0%) | 91 (6.7%) |
| 30 to 34 Years | 149 (10.3%) | 54 (4.0%) |
| 35 to 39 Years | 91 (6.3%) | 68 (5.0%) |
| 40 to 44 Years | 124 (8.6%) | 173 (12.7%) |
| 45 to 49 Years | 124 (8.6%) | 57 (4.2%) |
| 50 to 54 Years | 60 (4.2%) | 173 (12.7%) |
| 55 to 59 Years | 118 (8.2%) | 39 (2.9%) |
| 60 to 64 Years | 44 (3.0%) | 67 (4.9%) |
| 65 to 69 Years | 90 (6.2%) | 38 (2.8%) |
| 70 to 74 Years | 14 (1.0%) | 12 (0.9%) |
| 75 to 79 Years | 53 (3.7%) | 68 (5.0%) |
| 80 to 84 Years | 42 (2.9%) | 36 (2.6%) |
| 85 Years and over | 9 (0.6%) | 0 (0.0%) |
| Total | 1,445 (100.0%) | 1,358 (100.0%) |
Families and Households in Beechwood
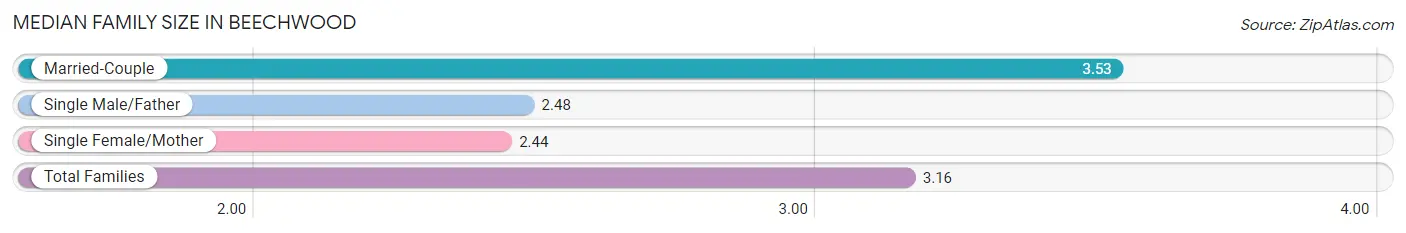
Median Family Size in Beechwood
The median family size in Beechwood is 3.16 persons per family, with married-couple families (467 | 65.5%) accounting for the largest median family size of 3.53 persons per family. On the other hand, single female/mother families (185 | 26.0%) represent the smallest median family size with 2.44 persons per family.
| Family Type | # Families | Family Size |
| Married-Couple | 467 (65.5%) | 3.53 |
| Single Male/Father | 61 (8.6%) | 2.48 |
| Single Female/Mother | 185 (26.0%) | 2.44 |
| Total Families | 713 (100.0%) | 3.16 |
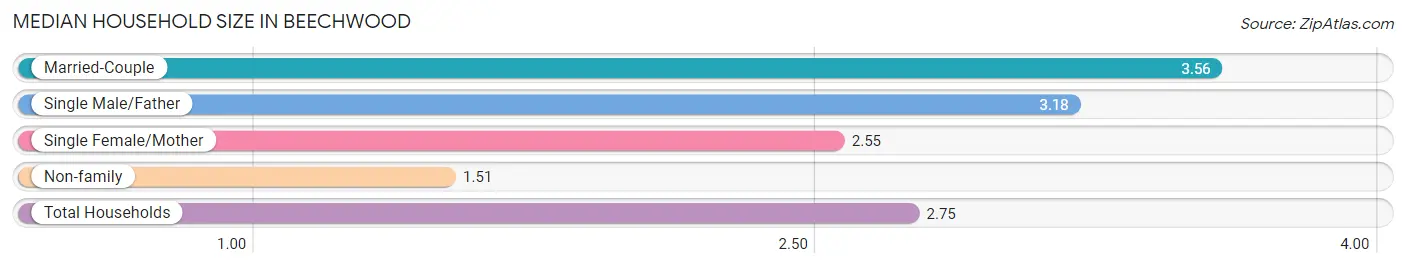
Median Household Size in Beechwood
The median household size in Beechwood is 2.75 persons per household, with married-couple households (467 | 46.2%) accounting for the largest median household size of 3.56 persons per household. non-family households (299 | 29.5%) represent the smallest median household size with 1.51 persons per household.
| Household Type | # Households | Household Size |
| Married-Couple | 467 (46.2%) | 3.56 |
| Single Male/Father | 61 (6.0%) | 3.18 |
| Single Female/Mother | 185 (18.3%) | 2.55 |
| Non-family | 299 (29.5%) | 1.51 |
| Total Households | 1,012 (100.0%) | 2.75 |
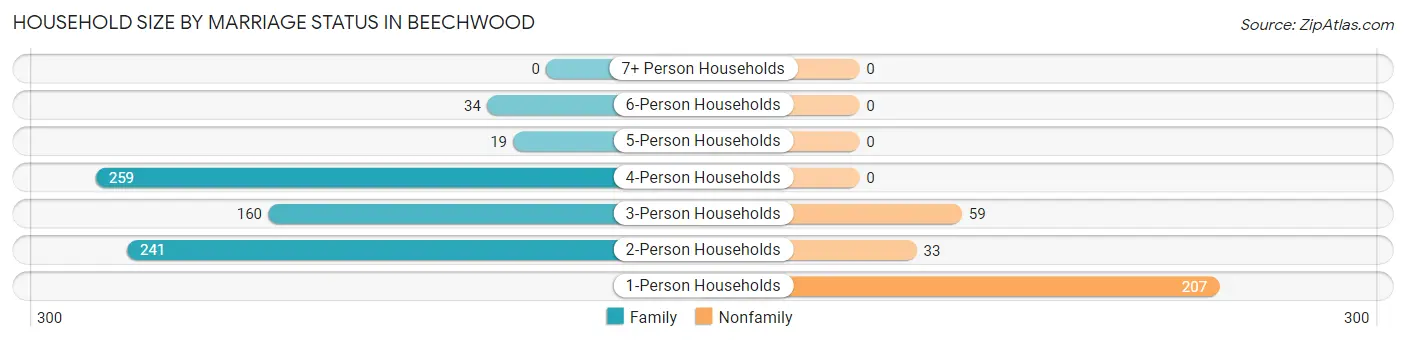
Household Size by Marriage Status in Beechwood
Out of a total of 1,012 households in Beechwood, 713 (70.5%) are family households, while 299 (29.5%) are nonfamily households. The most numerous type of family households are 4-person households, comprising 259, and the most common type of nonfamily households are 1-person households, comprising 207.
| Household Size | Family Households | Nonfamily Households |
| 1-Person Households | - | 207 (20.4%) |
| 2-Person Households | 241 (23.8%) | 33 (3.3%) |
| 3-Person Households | 160 (15.8%) | 59 (5.8%) |
| 4-Person Households | 259 (25.6%) | 0 (0.0%) |
| 5-Person Households | 19 (1.9%) | 0 (0.0%) |
| 6-Person Households | 34 (3.4%) | 0 (0.0%) |
| 7+ Person Households | 0 (0.0%) | 0 (0.0%) |
| Total | 713 (70.5%) | 299 (29.5%) |
Female Fertility in Beechwood
Fertility by Age in Beechwood
Average fertility rate in Beechwood is 61.0 births per 1,000 women. Women in the age bracket of 20 to 34 years have the highest fertility rate with 177.0 births per 1,000 women. Women in the age bracket of 20 to 34 years acount for 100.0% of all women with births.
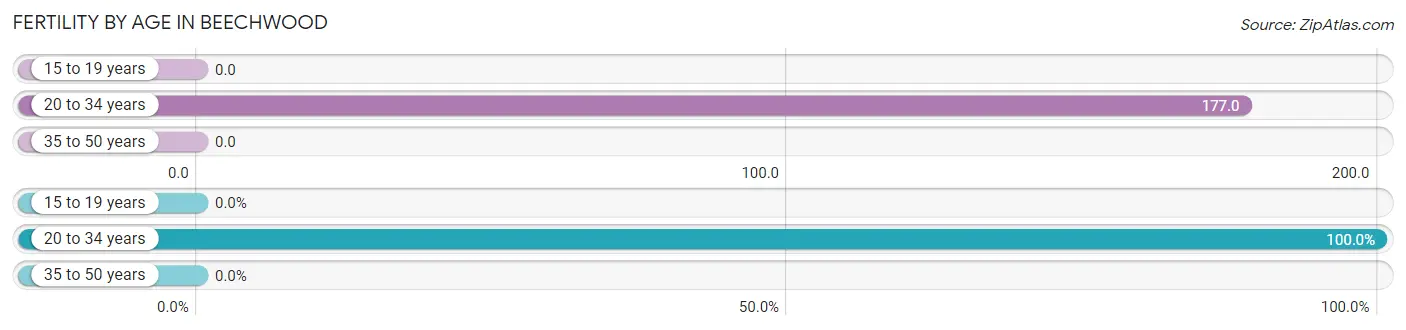
| Age Bracket | Women with Births | Births / 1,000 Women |
| 15 to 19 years | 0 (0.0%) | 0.0 |
| 20 to 34 years | 44 (100.0%) | 177.0 |
| 35 to 50 years | 0 (0.0%) | 0.0 |
| Total | 44 (100.0%) | 61.0 |
Fertility by Age by Marriage Status in Beechwood
68.2% of women with births (44) in Beechwood are married. The highest percentage of unmarried women with births falls into 20 to 34 years age bracket with 31.8% of them unmarried at the time of birth, while the lowest percentage of unmarried women with births belong to 20 to 34 years age bracket with 31.8% of them unmarried.
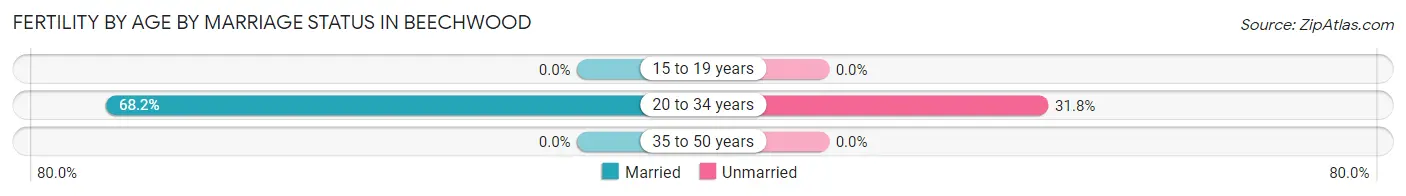
| Age Bracket | Married | Unmarried |
| 15 to 19 years | 0 (0.0%) | 0 (0.0%) |
| 20 to 34 years | 30 (68.2%) | 14 (31.8%) |
| 35 to 50 years | 0 (0.0%) | 0 (0.0%) |
| Total | 30 (68.2%) | 14 (31.8%) |
Fertility by Education in Beechwood
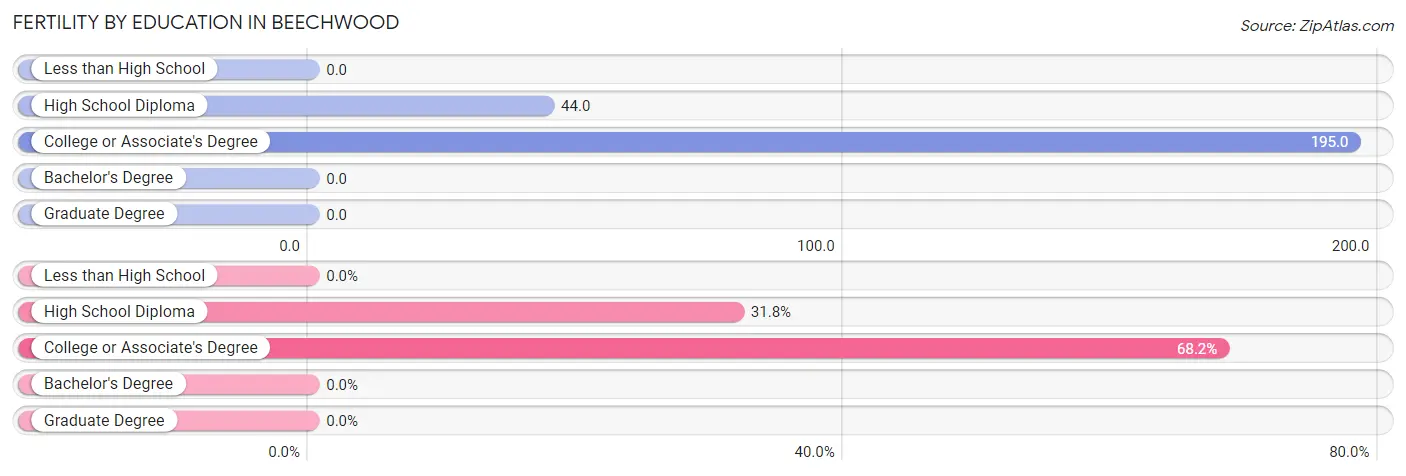
| Educational Attainment | Women with Births | Births / 1,000 Women |
| Less than High School | 0 (0.0%) | 0.0 |
| High School Diploma | 14 (31.8%) | 44.0 |
| College or Associate's Degree | 30 (68.2%) | 195.0 |
| Bachelor's Degree | 0 (0.0%) | 0.0 |
| Graduate Degree | 0 (0.0%) | 0.0 |
| Total | 44 (100.0%) | 61.0 |
Fertility by Education by Marriage Status in Beechwood
31.8% of women with births in Beechwood are unmarried. Women with the educational attainment of college or associate's degree are most likely to be married with 100.0% of them married at childbirth, while women with the educational attainment of high school diploma are least likely to be married with 100.0% of them unmarried at childbirth.
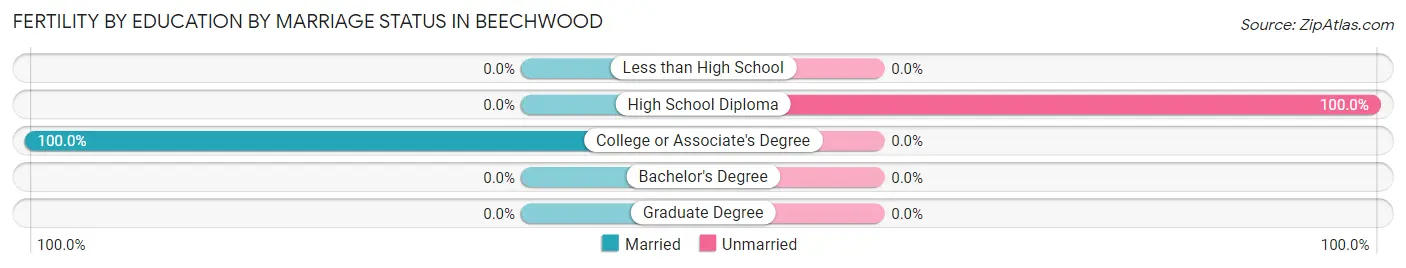
| Educational Attainment | Married | Unmarried |
| Less than High School | 0 (0.0%) | 0 (0.0%) |
| High School Diploma | 0 (0.0%) | 14 (100.0%) |
| College or Associate's Degree | 30 (100.0%) | 0 (0.0%) |
| Bachelor's Degree | 0 (0.0%) | 0 (0.0%) |
| Graduate Degree | 0 (0.0%) | 0 (0.0%) |
| Total | 30 (68.2%) | 14 (31.8%) |
Income in Beechwood
Income Overview in Beechwood
Per Capita Income in Beechwood is $34,997, while median incomes of families and households are $60,592 and $63,750 respectively.
| Characteristic | Number | Measure |
| Per Capita Income | 2,803 | $34,997 |
| Median Family Income | 713 | $60,592 |
| Mean Family Income | 713 | $108,148 |
| Median Household Income | 1,012 | $63,750 |
| Mean Household Income | 1,012 | $96,150 |
| Income Deficit | 713 | $0 |
| Wage / Income Gap (%) | 2,803 | 26.13% |
| Wage / Income Gap ($) | 2,803 | 73.87¢ per $1 |
| Gini / Inequality Index | 2,803 | 0.50 |
Earnings by Sex in Beechwood
Average Earnings in Beechwood are $35,647, $47,500 for men and $35,086 for women, a difference of 26.1%.
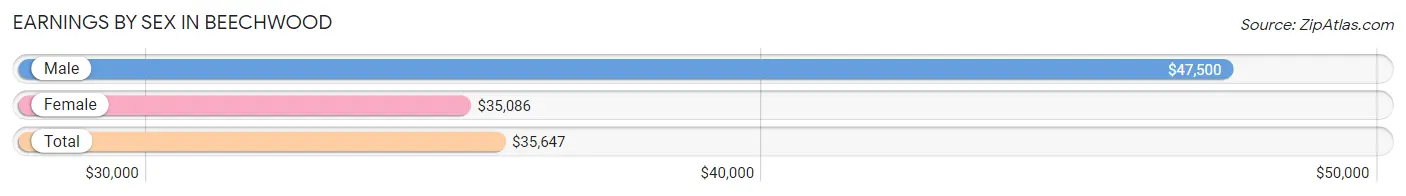
| Sex | Number | Average Earnings |
| Male | 966 (64.7%) | $47,500 |
| Female | 526 (35.2%) | $35,086 |
| Total | 1,492 (100.0%) | $35,647 |
Earnings by Sex by Income Bracket in Beechwood
The most common earnings brackets in Beechwood are $25,000 to $29,999 for men (159 | 16.5%) and $35,000 to $39,999 for women (86 | 16.4%).
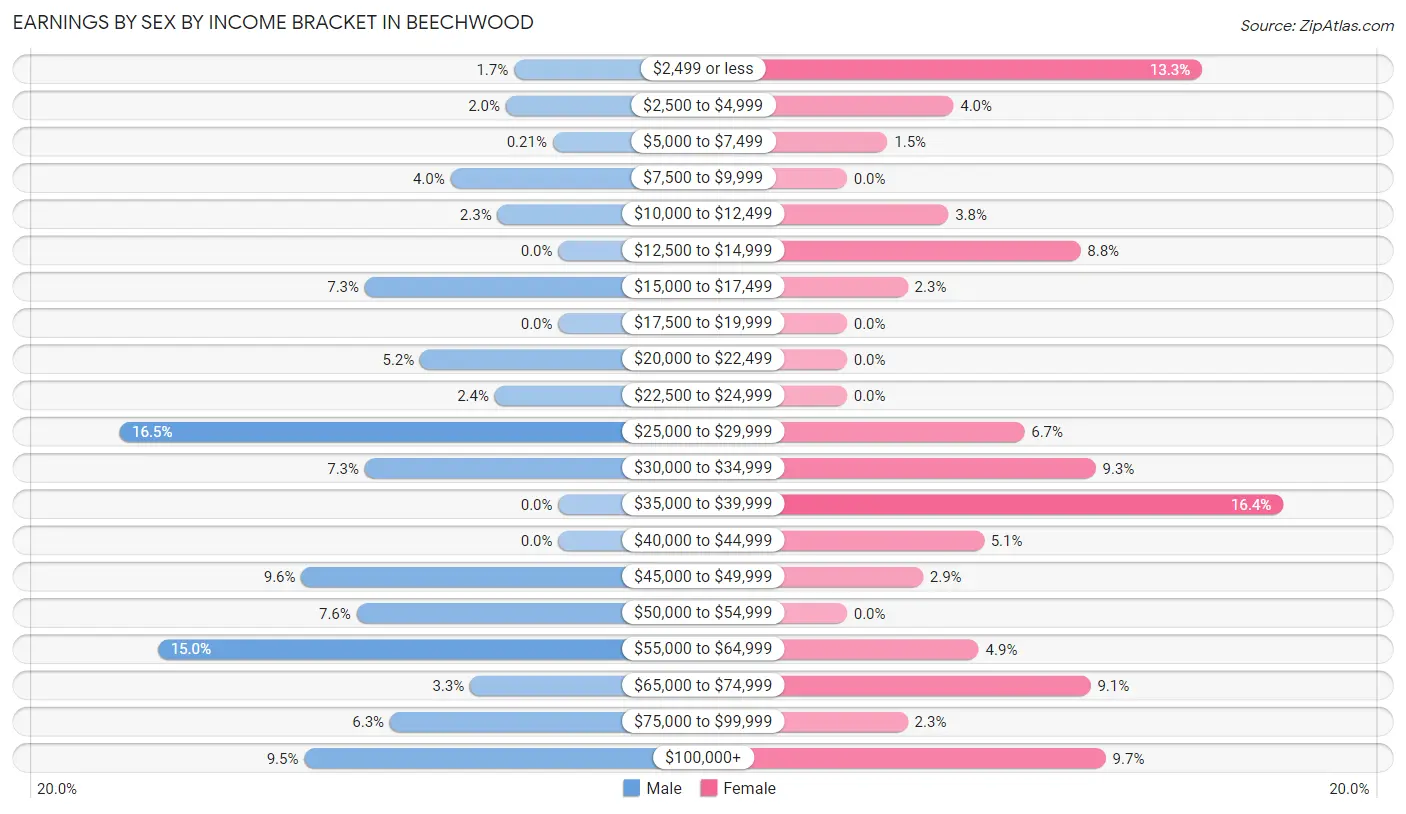
| Income | Male | Female |
| $2,499 or less | 16 (1.7%) | 70 (13.3%) |
| $2,500 to $4,999 | 19 (2.0%) | 21 (4.0%) |
| $5,000 to $7,499 | 2 (0.2%) | 8 (1.5%) |
| $7,500 to $9,999 | 39 (4.0%) | 0 (0.0%) |
| $10,000 to $12,499 | 22 (2.3%) | 20 (3.8%) |
| $12,500 to $14,999 | 0 (0.0%) | 46 (8.7%) |
| $15,000 to $17,499 | 70 (7.2%) | 12 (2.3%) |
| $17,500 to $19,999 | 0 (0.0%) | 0 (0.0%) |
| $20,000 to $22,499 | 50 (5.2%) | 0 (0.0%) |
| $22,500 to $24,999 | 23 (2.4%) | 0 (0.0%) |
| $25,000 to $29,999 | 159 (16.5%) | 35 (6.7%) |
| $30,000 to $34,999 | 70 (7.2%) | 49 (9.3%) |
| $35,000 to $39,999 | 0 (0.0%) | 86 (16.4%) |
| $40,000 to $44,999 | 0 (0.0%) | 27 (5.1%) |
| $45,000 to $49,999 | 93 (9.6%) | 15 (2.9%) |
| $50,000 to $54,999 | 73 (7.6%) | 0 (0.0%) |
| $55,000 to $64,999 | 145 (15.0%) | 26 (4.9%) |
| $65,000 to $74,999 | 32 (3.3%) | 48 (9.1%) |
| $75,000 to $99,999 | 61 (6.3%) | 12 (2.3%) |
| $100,000+ | 92 (9.5%) | 51 (9.7%) |
| Total | 966 (100.0%) | 526 (100.0%) |
Earnings by Sex by Educational Attainment in Beechwood
Average earnings in Beechwood are $48,165 for men and $36,530 for women, a difference of 24.2%. Men with an educational attainment of high school diploma enjoy the highest average annual earnings of $55,781, while those with less than high school education earn the least with $29,107. Women with an educational attainment of bachelor's degree earn the most with the average annual earnings of $65,755, while those with college or associate's degree education have the smallest earnings of $30,972.
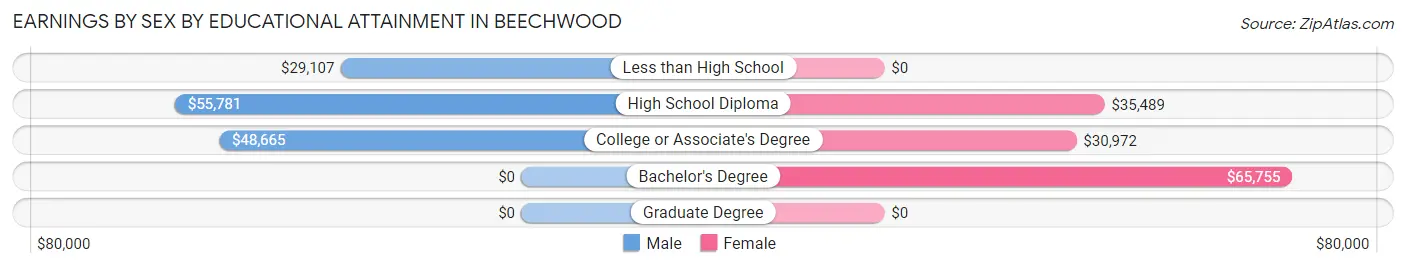
| Educational Attainment | Male Income | Female Income |
| Less than High School | $29,107 | $0 |
| High School Diploma | $55,781 | $35,489 |
| College or Associate's Degree | $48,665 | $30,972 |
| Bachelor's Degree | - | - |
| Graduate Degree | - | - |
| Total | $48,165 | $36,530 |
Family Income in Beechwood
Family Income Brackets in Beechwood
According to the Beechwood family income data, there are 128 families falling into the $100,000 to $149,999 income range, which is the most common income bracket and makes up 17.9% of all families.
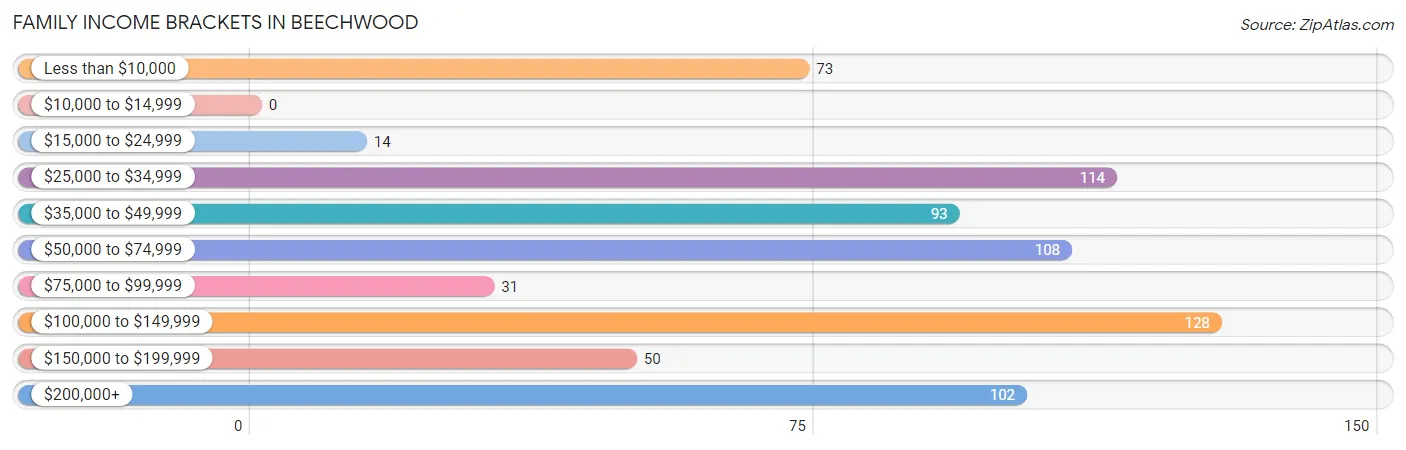
| Income Bracket | # Families | % Families |
| Less than $10,000 | 73 | 10.2% |
| $10,000 to $14,999 | 0 | 0.0% |
| $15,000 to $24,999 | 14 | 2.0% |
| $25,000 to $34,999 | 114 | 16.0% |
| $35,000 to $49,999 | 93 | 13.0% |
| $50,000 to $74,999 | 108 | 15.1% |
| $75,000 to $99,999 | 31 | 4.3% |
| $100,000 to $149,999 | 128 | 18.0% |
| $150,000 to $199,999 | 50 | 7.0% |
| $200,000+ | 102 | 14.3% |
Family Income by Famaliy Size in Beechwood
2-person families (279 | 39.1%) account for the highest median family income in Beechwood with $58,438 per family, while 2-person families (279 | 39.1%) have the highest median income of $29,219 per family member.
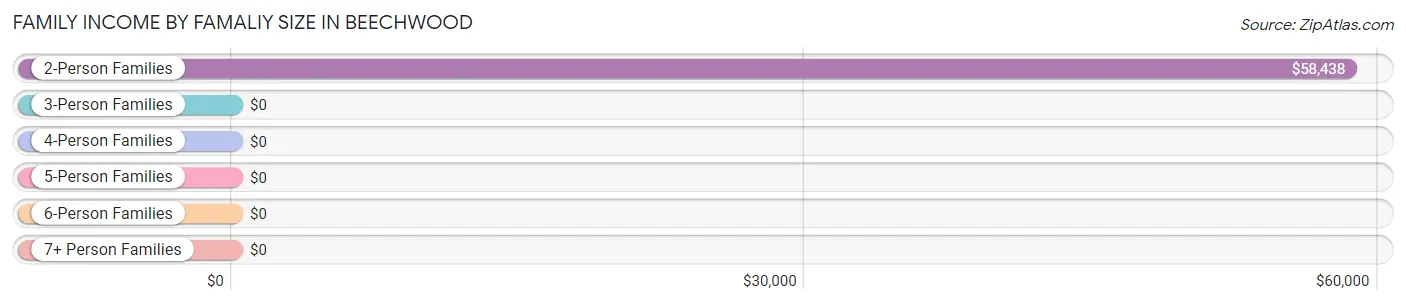
| Income Bracket | # Families | Median Income |
| 2-Person Families | 279 (39.1%) | $58,438 |
| 3-Person Families | 151 (21.2%) | $0 |
| 4-Person Families | 242 (33.9%) | $0 |
| 5-Person Families | 7 (1.0%) | $0 |
| 6-Person Families | 34 (4.8%) | $0 |
| 7+ Person Families | 0 (0.0%) | $0 |
| Total | 713 (100.0%) | $60,592 |
Family Income by Number of Earners in Beechwood
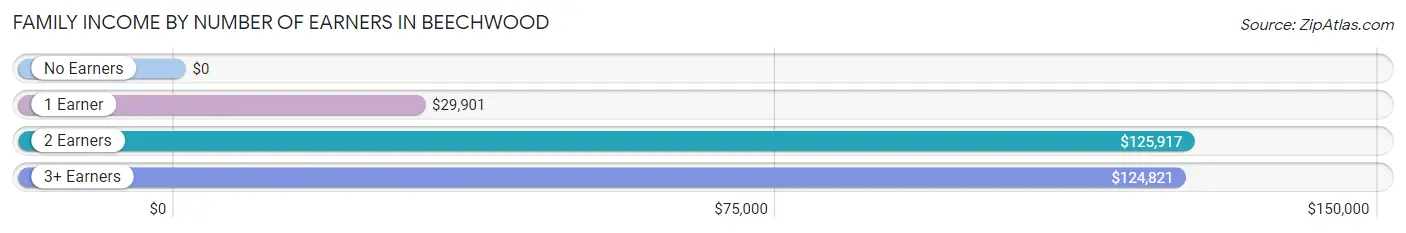
| Number of Earners | # Families | Median Income |
| No Earners | 106 (14.9%) | $0 |
| 1 Earner | 285 (40.0%) | $29,901 |
| 2 Earners | 265 (37.2%) | $125,917 |
| 3+ Earners | 57 (8.0%) | $124,821 |
| Total | 713 (100.0%) | $60,592 |
Household Income in Beechwood
Household Income Brackets in Beechwood
With 171 households falling in the category, the $100,000 to $149,999 income range is the most frequent in Beechwood, accounting for 16.9% of all households. In contrast, only 14 households (1.4%) fall into the $15,000 to $24,999 income bracket, making it the least populous group.
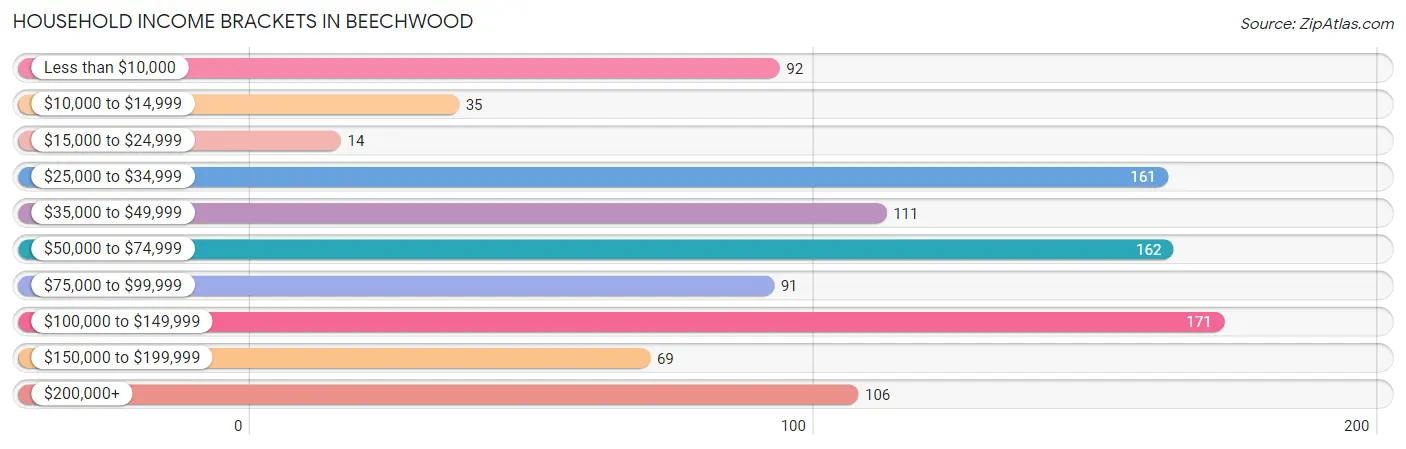
| Income Bracket | # Households | % Households |
| Less than $10,000 | 92 | 9.1% |
| $10,000 to $14,999 | 35 | 3.5% |
| $15,000 to $24,999 | 14 | 1.4% |
| $25,000 to $34,999 | 161 | 15.9% |
| $35,000 to $49,999 | 111 | 11.0% |
| $50,000 to $74,999 | 162 | 16.0% |
| $75,000 to $99,999 | 91 | 9.0% |
| $100,000 to $149,999 | 171 | 16.9% |
| $150,000 to $199,999 | 69 | 6.8% |
| $200,000+ | 106 | 10.5% |
Household Income by Householder Age in Beechwood
The median household income in Beechwood is $63,750, with the highest median household income of $126,000 found in the 45 to 64 years age bracket for the primary householder. A total of 318 households (31.4%) fall into this category.
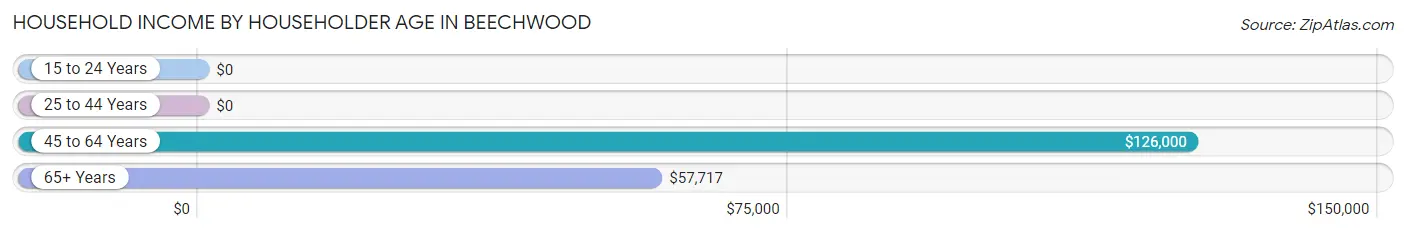
| Income Bracket | # Households | Median Income |
| 15 to 24 Years | 0 (0.0%) | $0 |
| 25 to 44 Years | 442 (43.7%) | $0 |
| 45 to 64 Years | 318 (31.4%) | $126,000 |
| 65+ Years | 252 (24.9%) | $57,717 |
| Total | 1,012 (100.0%) | $63,750 |
Poverty in Beechwood
Income Below Poverty by Sex and Age in Beechwood
With 21.8% poverty level for males and 31.7% for females among the residents of Beechwood, 12 to 14 year old males and 16 and 17 year old females are the most vulnerable to poverty, with 130 males (73.0%) and 128 females (90.1%) in their respective age groups living below the poverty level.
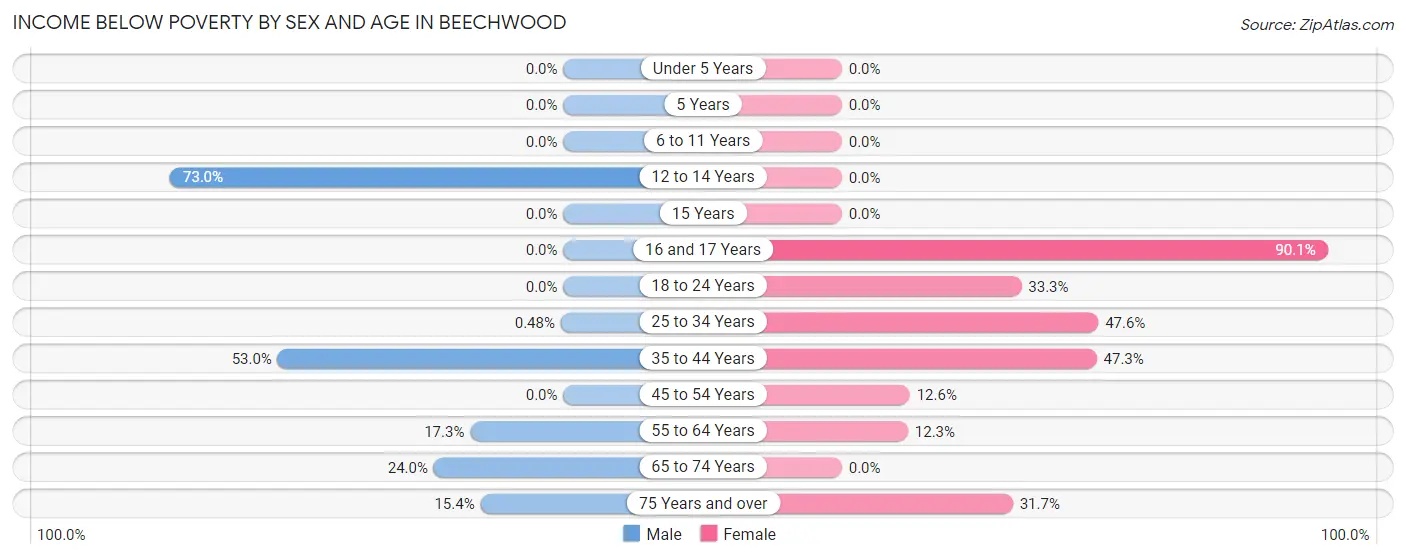
| Age Bracket | Male | Female |
| Under 5 Years | 0 (0.0%) | 0 (0.0%) |
| 5 Years | 0 (0.0%) | 0 (0.0%) |
| 6 to 11 Years | 0 (0.0%) | 0 (0.0%) |
| 12 to 14 Years | 130 (73.0%) | 0 (0.0%) |
| 15 Years | 0 (0.0%) | 0 (0.0%) |
| 16 and 17 Years | 0 (0.0%) | 128 (90.1%) |
| 18 to 24 Years | 0 (0.0%) | 44 (33.3%) |
| 25 to 34 Years | 1 (0.5%) | 69 (47.6%) |
| 35 to 44 Years | 114 (53.0%) | 114 (47.3%) |
| 45 to 54 Years | 0 (0.0%) | 29 (12.6%) |
| 55 to 64 Years | 28 (17.3%) | 13 (12.3%) |
| 65 to 74 Years | 25 (24.0%) | 0 (0.0%) |
| 75 Years and over | 16 (15.4%) | 33 (31.7%) |
| Total | 314 (21.8%) | 430 (31.7%) |
Income Above Poverty by Sex and Age in Beechwood
According to the poverty statistics in Beechwood, males aged under 5 years and females aged under 5 years are the age groups that are most secure financially, with 100.0% of males and 100.0% of females in these age groups living above the poverty line.
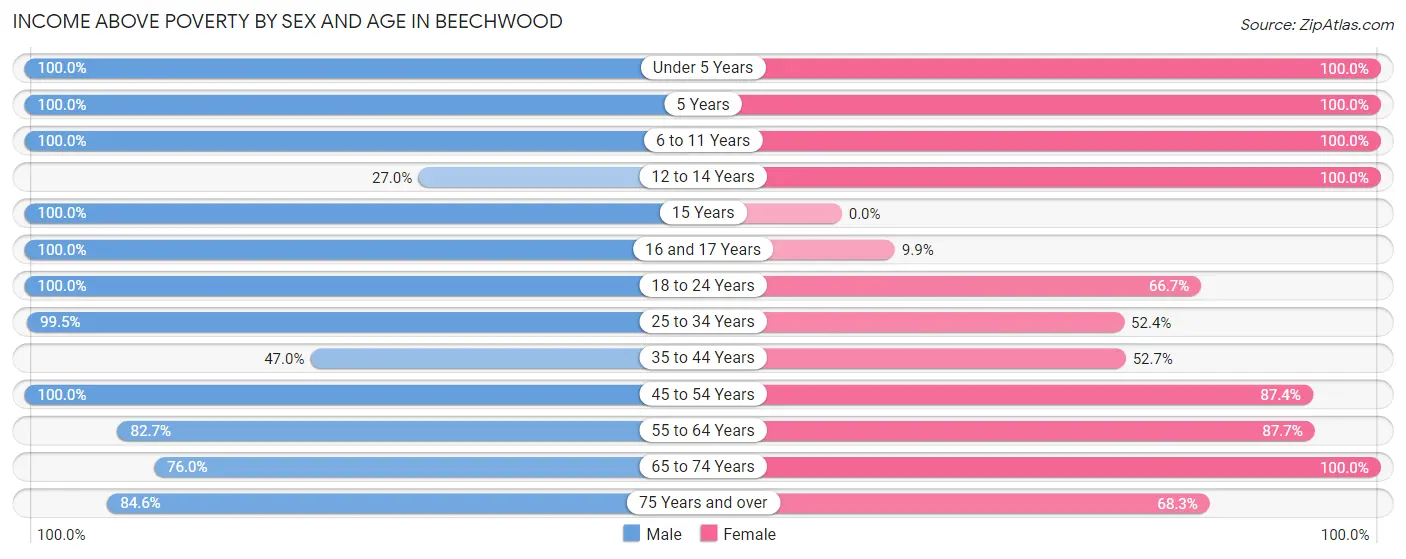
| Age Bracket | Male | Female |
| Under 5 Years | 31 (100.0%) | 88 (100.0%) |
| 5 Years | 10 (100.0%) | 12 (100.0%) |
| 6 to 11 Years | 56 (100.0%) | 34 (100.0%) |
| 12 to 14 Years | 48 (27.0%) | 74 (100.0%) |
| 15 Years | 7 (100.0%) | 0 (0.0%) |
| 16 and 17 Years | 4 (100.0%) | 14 (9.9%) |
| 18 to 24 Years | 178 (100.0%) | 88 (66.7%) |
| 25 to 34 Years | 206 (99.5%) | 76 (52.4%) |
| 35 to 44 Years | 101 (47.0%) | 127 (52.7%) |
| 45 to 54 Years | 184 (100.0%) | 201 (87.4%) |
| 55 to 64 Years | 134 (82.7%) | 93 (87.7%) |
| 65 to 74 Years | 79 (76.0%) | 50 (100.0%) |
| 75 Years and over | 88 (84.6%) | 71 (68.3%) |
| Total | 1,126 (78.2%) | 928 (68.3%) |
Income Below Poverty Among Married-Couple Families in Beechwood
The poverty statistics for married-couple families in Beechwood show that 24.4% or 114 of the total 467 families live below the poverty line. Families with 1 or 2 children have the highest poverty rate of 50.9%, comprising of 114 families. On the other hand, families with no children have the lowest poverty rate of 0.0%, which includes 0 families.
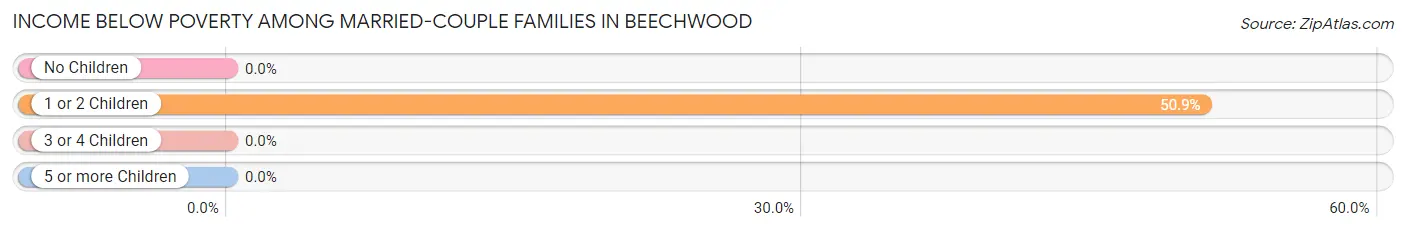
| Children | Above Poverty | Below Poverty |
| No Children | 219 (100.0%) | 0 (0.0%) |
| 1 or 2 Children | 110 (49.1%) | 114 (50.9%) |
| 3 or 4 Children | 24 (100.0%) | 0 (0.0%) |
| 5 or more Children | 0 (0.0%) | 0 (0.0%) |
| Total | 353 (75.6%) | 114 (24.4%) |
Income Below Poverty Among Single-Parent Households in Beechwood
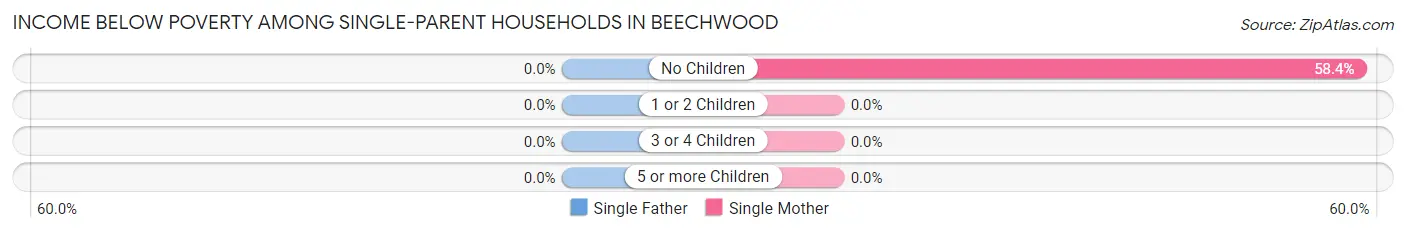
| Children | Single Father | Single Mother |
| No Children | 0 (0.0%) | 73 (58.4%) |
| 1 or 2 Children | 0 (0.0%) | 0 (0.0%) |
| 3 or 4 Children | 0 (0.0%) | 0 (0.0%) |
| 5 or more Children | 0 (0.0%) | 0 (0.0%) |
| Total | 0 (0.0%) | 73 (39.5%) |
Income Below Poverty Among Married-Couple vs Single-Parent Households in Beechwood
The poverty data for Beechwood shows that 114 of the married-couple family households (24.4%) and 73 of the single-parent households (29.7%) are living below the poverty level. Within the married-couple family households, those with 1 or 2 children have the highest poverty rate, with 114 households (50.9%) falling below the poverty line. Among the single-parent households, those with no children have the highest poverty rate, with 73 household (52.5%) living below poverty.
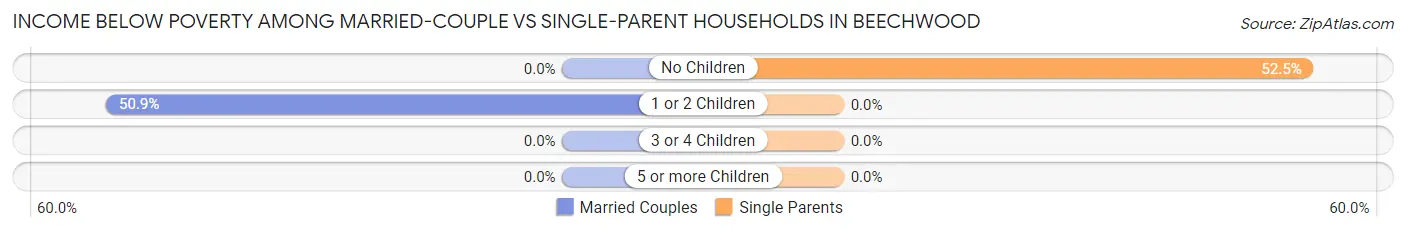
| Children | Married-Couple Families | Single-Parent Households |
| No Children | 0 (0.0%) | 73 (52.5%) |
| 1 or 2 Children | 114 (50.9%) | 0 (0.0%) |
| 3 or 4 Children | 0 (0.0%) | 0 (0.0%) |
| 5 or more Children | 0 (0.0%) | 0 (0.0%) |
| Total | 114 (24.4%) | 73 (29.7%) |
Employment Characteristics in Beechwood
Employment by Class of Employer in Beechwood
Among the 1,396 employed individuals in Beechwood, private company employees (1,171 | 83.9%), not-for-profit organizations (116 | 8.3%), and local government employees (42 | 3.0%) make up the most common classes of employment.
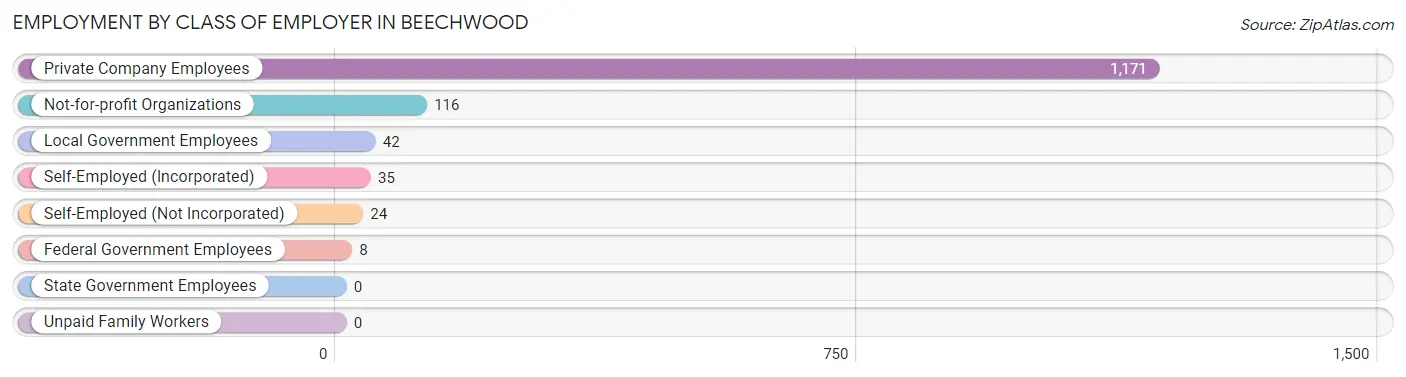
| Employer Class | # Employees | % Employees |
| Private Company Employees | 1,171 | 83.9% |
| Self-Employed (Incorporated) | 35 | 2.5% |
| Self-Employed (Not Incorporated) | 24 | 1.7% |
| Not-for-profit Organizations | 116 | 8.3% |
| Local Government Employees | 42 | 3.0% |
| State Government Employees | 0 | 0.0% |
| Federal Government Employees | 8 | 0.6% |
| Unpaid Family Workers | 0 | 0.0% |
| Total | 1,396 | 100.0% |
Employment Status by Age in Beechwood
According to the labor force statistics for Beechwood, out of the total population over 16 years of age (2,308), 74.2% or 1,713 individuals are in the labor force, with 17.9% or 307 of them unemployed. The age group with the highest labor force participation rate is 20 to 24 years, with 99.6% or 280 individuals in the labor force. Within the labor force, the 16 to 19 years age range has the highest percentage of unemployed individuals, with 78.9% or 135 of them being unemployed.
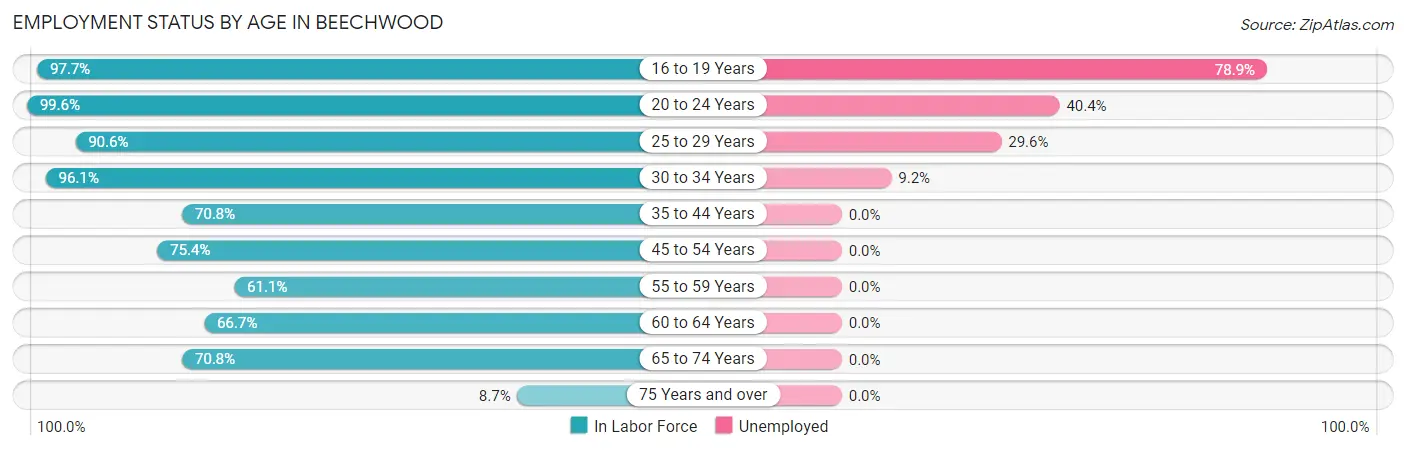
| Age Bracket | In Labor Force | Unemployed |
| 16 to 19 Years | 171 (97.7%) | 135 (78.9%) |
| 20 to 24 Years | 280 (99.6%) | 113 (40.4%) |
| 25 to 29 Years | 135 (90.6%) | 40 (29.6%) |
| 30 to 34 Years | 195 (96.1%) | 18 (9.2%) |
| 35 to 44 Years | 323 (70.8%) | 0 (0.0%) |
| 45 to 54 Years | 312 (75.4%) | 0 (0.0%) |
| 55 to 59 Years | 96 (61.1%) | 0 (0.0%) |
| 60 to 64 Years | 74 (66.7%) | 0 (0.0%) |
| 65 to 74 Years | 109 (70.8%) | 0 (0.0%) |
| 75 Years and over | 18 (8.7%) | 0 (0.0%) |
| Total | 1,713 (74.2%) | 307 (17.9%) |
Employment Status by Educational Attainment in Beechwood
According to labor force statistics for Beechwood, 76.2% of individuals (1,135) out of the total population between 25 and 64 years of age (1,490) are in the labor force, with 5.1% or 58 of them being unemployed. The group with the highest labor force participation rate are those with the educational attainment of bachelor's degree or higher, with 95.0% or 401 individuals in the labor force. Within the labor force, individuals with bachelor's degree or higher education have the highest percentage of unemployment, with 14.5% or 58 of them being unemployed.
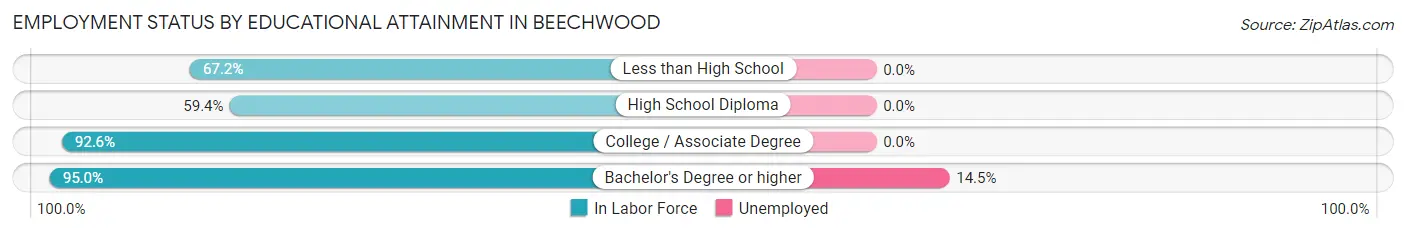
| Educational Attainment | In Labor Force | Unemployed |
| Less than High School | 160 (67.2%) | 0 (0.0%) |
| High School Diploma | 348 (59.4%) | 0 (0.0%) |
| College / Associate Degree | 226 (92.6%) | 0 (0.0%) |
| Bachelor's Degree or higher | 401 (95.0%) | 61 (14.5%) |
| Total | 1,135 (76.2%) | 76 (5.1%) |
Employment Occupations by Sex in Beechwood
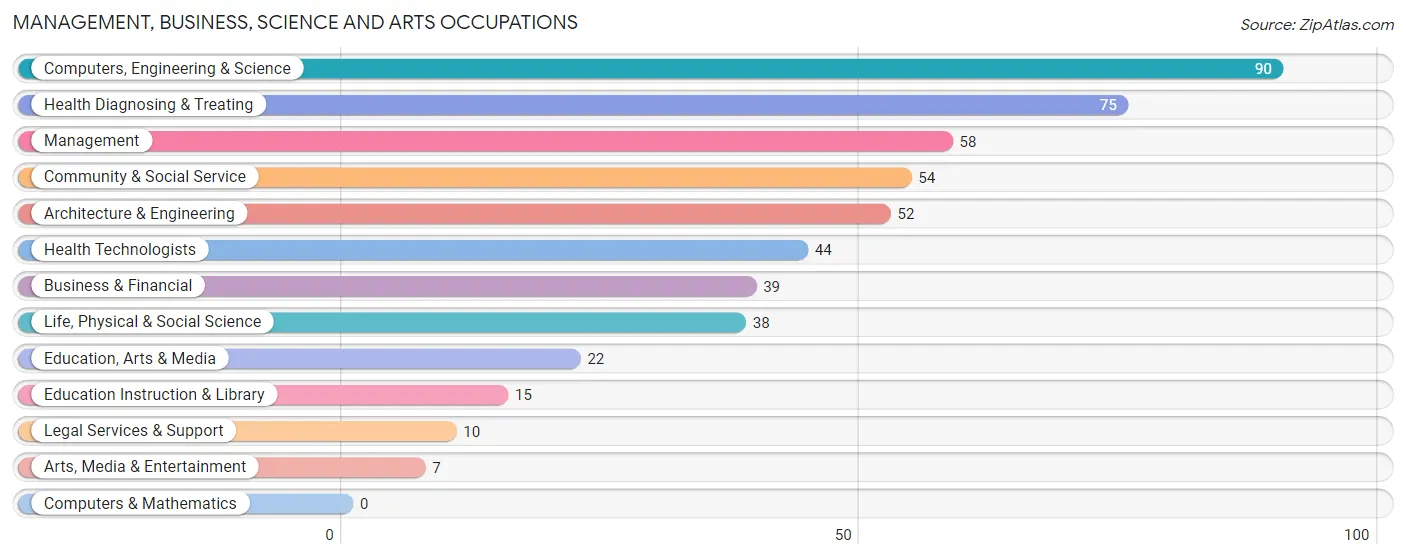
Management, Business, Science and Arts Occupations
The most common Management, Business, Science and Arts occupations in Beechwood are Computers, Engineering & Science (90 | 6.4%), Health Diagnosing & Treating (75 | 5.3%), Management (58 | 4.1%), Community & Social Service (54 | 3.8%), and Architecture & Engineering (52 | 3.7%).
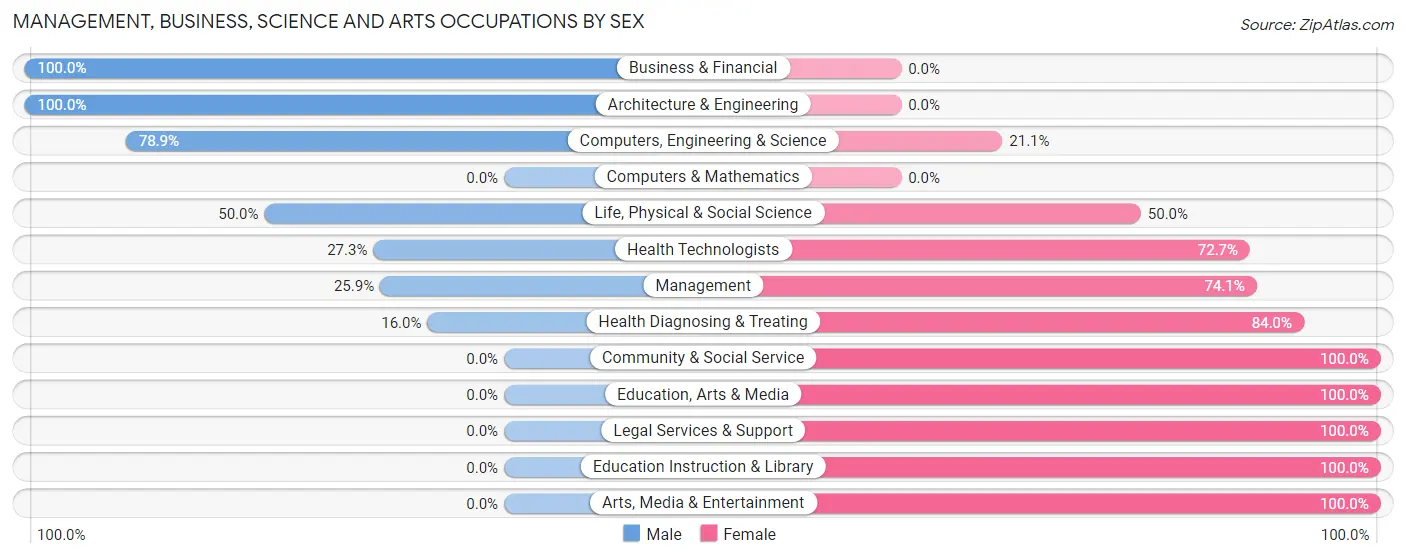
Management, Business, Science and Arts Occupations by Sex
Within the Management, Business, Science and Arts occupations in Beechwood, the most male-oriented occupations are Business & Financial (100.0%), Architecture & Engineering (100.0%), and Computers, Engineering & Science (78.9%), while the most female-oriented occupations are Community & Social Service (100.0%), Education, Arts & Media (100.0%), and Legal Services & Support (100.0%).
| Occupation | Male | Female |
| Management | 15 (25.9%) | 43 (74.1%) |
| Business & Financial | 39 (100.0%) | 0 (0.0%) |
| Computers, Engineering & Science | 71 (78.9%) | 19 (21.1%) |
| Computers & Mathematics | 0 (0.0%) | 0 (0.0%) |
| Architecture & Engineering | 52 (100.0%) | 0 (0.0%) |
| Life, Physical & Social Science | 19 (50.0%) | 19 (50.0%) |
| Community & Social Service | 0 (0.0%) | 54 (100.0%) |
| Education, Arts & Media | 0 (0.0%) | 22 (100.0%) |
| Legal Services & Support | 0 (0.0%) | 10 (100.0%) |
| Education Instruction & Library | 0 (0.0%) | 15 (100.0%) |
| Arts, Media & Entertainment | 0 (0.0%) | 7 (100.0%) |
| Health Diagnosing & Treating | 12 (16.0%) | 63 (84.0%) |
| Health Technologists | 12 (27.3%) | 32 (72.7%) |
| Total (Category) | 137 (43.3%) | 179 (56.7%) |
| Total (Overall) | 895 (63.6%) | 512 (36.4%) |
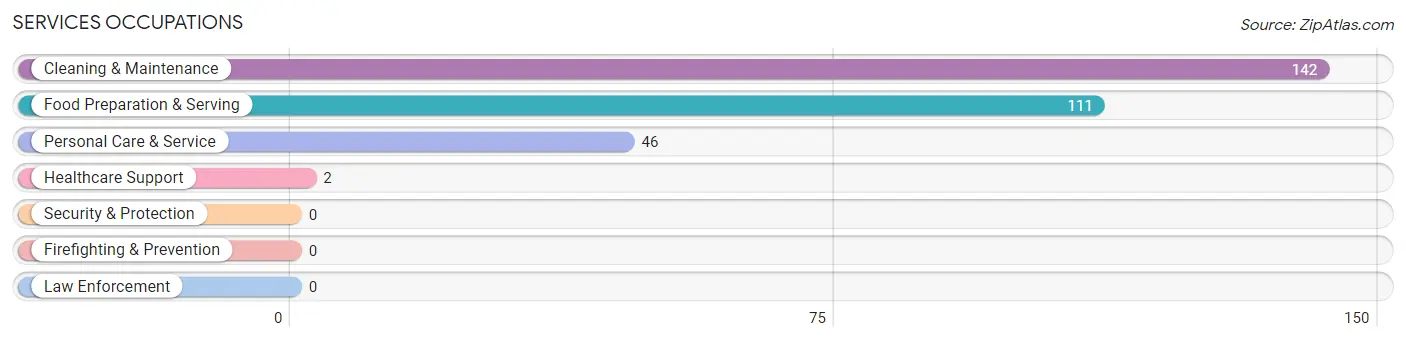
Services Occupations
The most common Services occupations in Beechwood are Cleaning & Maintenance (142 | 10.1%), Food Preparation & Serving (111 | 7.9%), Personal Care & Service (46 | 3.3%), and Healthcare Support (2 | 0.1%).
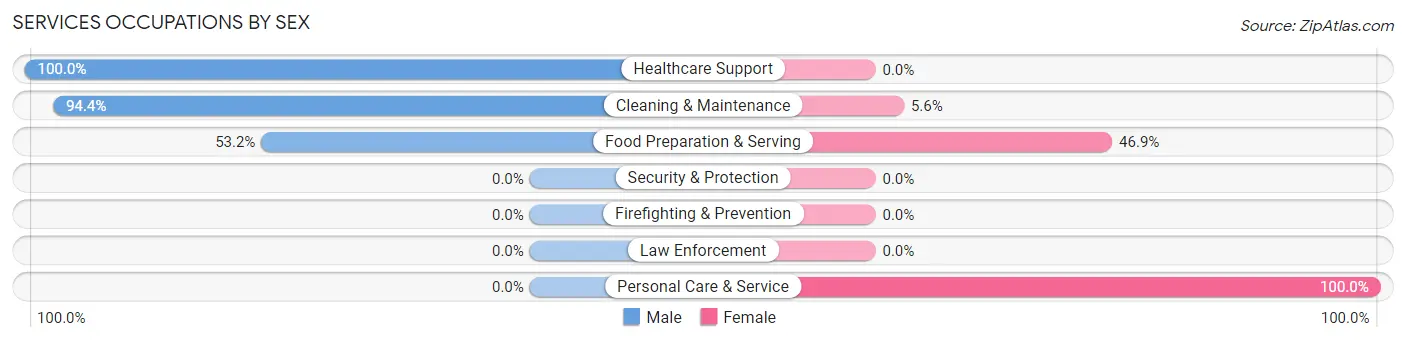
Services Occupations by Sex
Within the Services occupations in Beechwood, the most male-oriented occupations are Healthcare Support (100.0%), Cleaning & Maintenance (94.4%), and Food Preparation & Serving (53.1%), while the most female-oriented occupations are Personal Care & Service (100.0%), Food Preparation & Serving (46.9%), and Cleaning & Maintenance (5.6%).
| Occupation | Male | Female |
| Healthcare Support | 2 (100.0%) | 0 (0.0%) |
| Security & Protection | 0 (0.0%) | 0 (0.0%) |
| Firefighting & Prevention | 0 (0.0%) | 0 (0.0%) |
| Law Enforcement | 0 (0.0%) | 0 (0.0%) |
| Food Preparation & Serving | 59 (53.1%) | 52 (46.9%) |
| Cleaning & Maintenance | 134 (94.4%) | 8 (5.6%) |
| Personal Care & Service | 0 (0.0%) | 46 (100.0%) |
| Total (Category) | 195 (64.8%) | 106 (35.2%) |
| Total (Overall) | 895 (63.6%) | 512 (36.4%) |
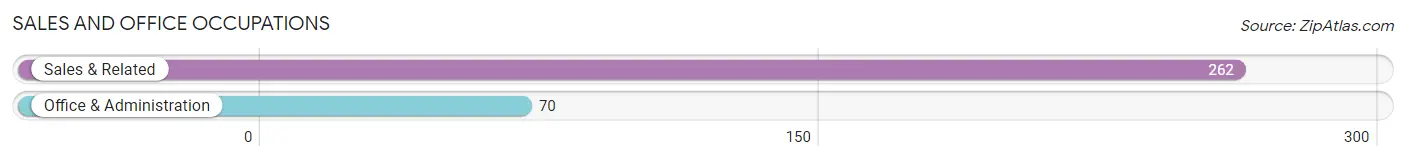
Sales and Office Occupations
The most common Sales and Office occupations in Beechwood are Sales & Related (262 | 18.6%), and Office & Administration (70 | 5.0%).
Sales and Office Occupations by Sex
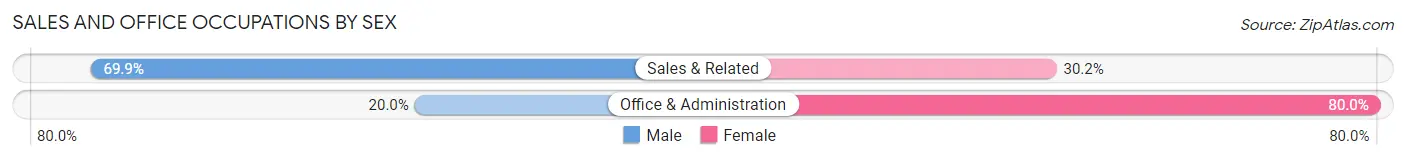
| Occupation | Male | Female |
| Sales & Related | 183 (69.9%) | 79 (30.1%) |
| Office & Administration | 14 (20.0%) | 56 (80.0%) |
| Total (Category) | 197 (59.3%) | 135 (40.7%) |
| Total (Overall) | 895 (63.6%) | 512 (36.4%) |
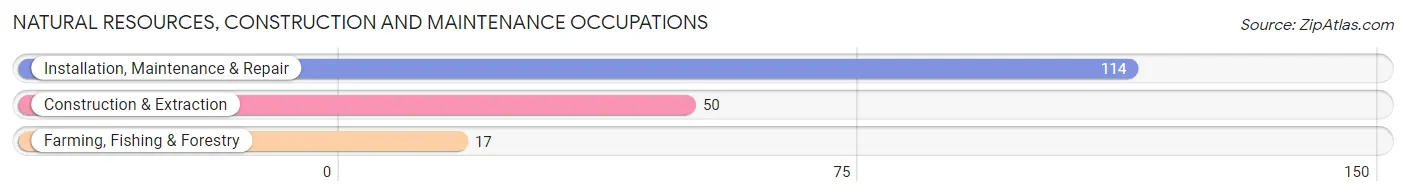
Natural Resources, Construction and Maintenance Occupations
The most common Natural Resources, Construction and Maintenance occupations in Beechwood are Installation, Maintenance & Repair (114 | 8.1%), Construction & Extraction (50 | 3.5%), and Farming, Fishing & Forestry (17 | 1.2%).
Natural Resources, Construction and Maintenance Occupations by Sex
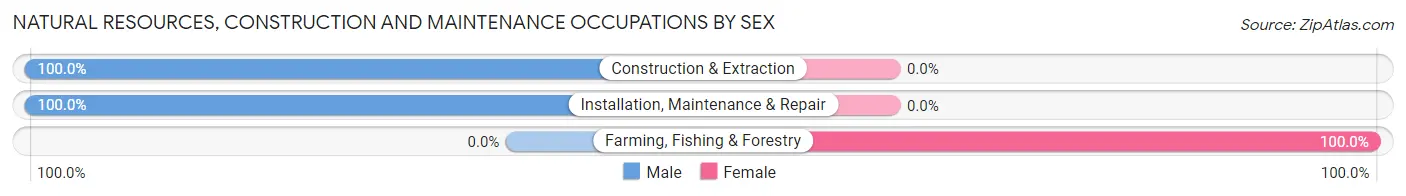
| Occupation | Male | Female |
| Farming, Fishing & Forestry | 0 (0.0%) | 17 (100.0%) |
| Construction & Extraction | 50 (100.0%) | 0 (0.0%) |
| Installation, Maintenance & Repair | 114 (100.0%) | 0 (0.0%) |
| Total (Category) | 164 (90.6%) | 17 (9.4%) |
| Total (Overall) | 895 (63.6%) | 512 (36.4%) |
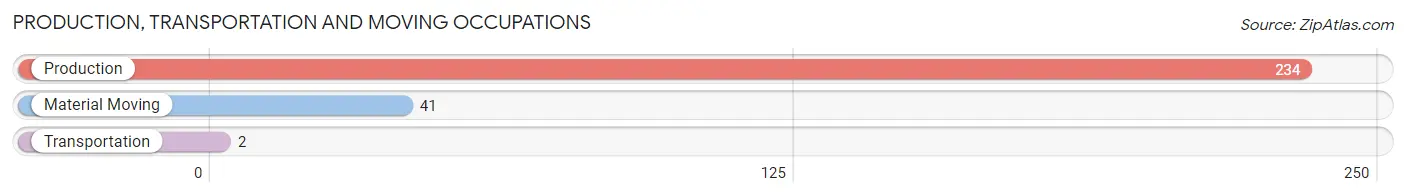
Production, Transportation and Moving Occupations
The most common Production, Transportation and Moving occupations in Beechwood are Production (234 | 16.6%), Material Moving (41 | 2.9%), and Transportation (2 | 0.1%).
Production, Transportation and Moving Occupations by Sex
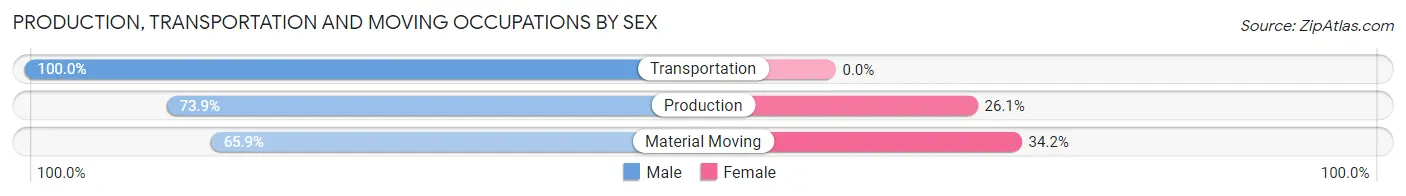
| Occupation | Male | Female |
| Production | 173 (73.9%) | 61 (26.1%) |
| Transportation | 2 (100.0%) | 0 (0.0%) |
| Material Moving | 27 (65.8%) | 14 (34.2%) |
| Total (Category) | 202 (72.9%) | 75 (27.1%) |
| Total (Overall) | 895 (63.6%) | 512 (36.4%) |
Employment Industries by Sex in Beechwood
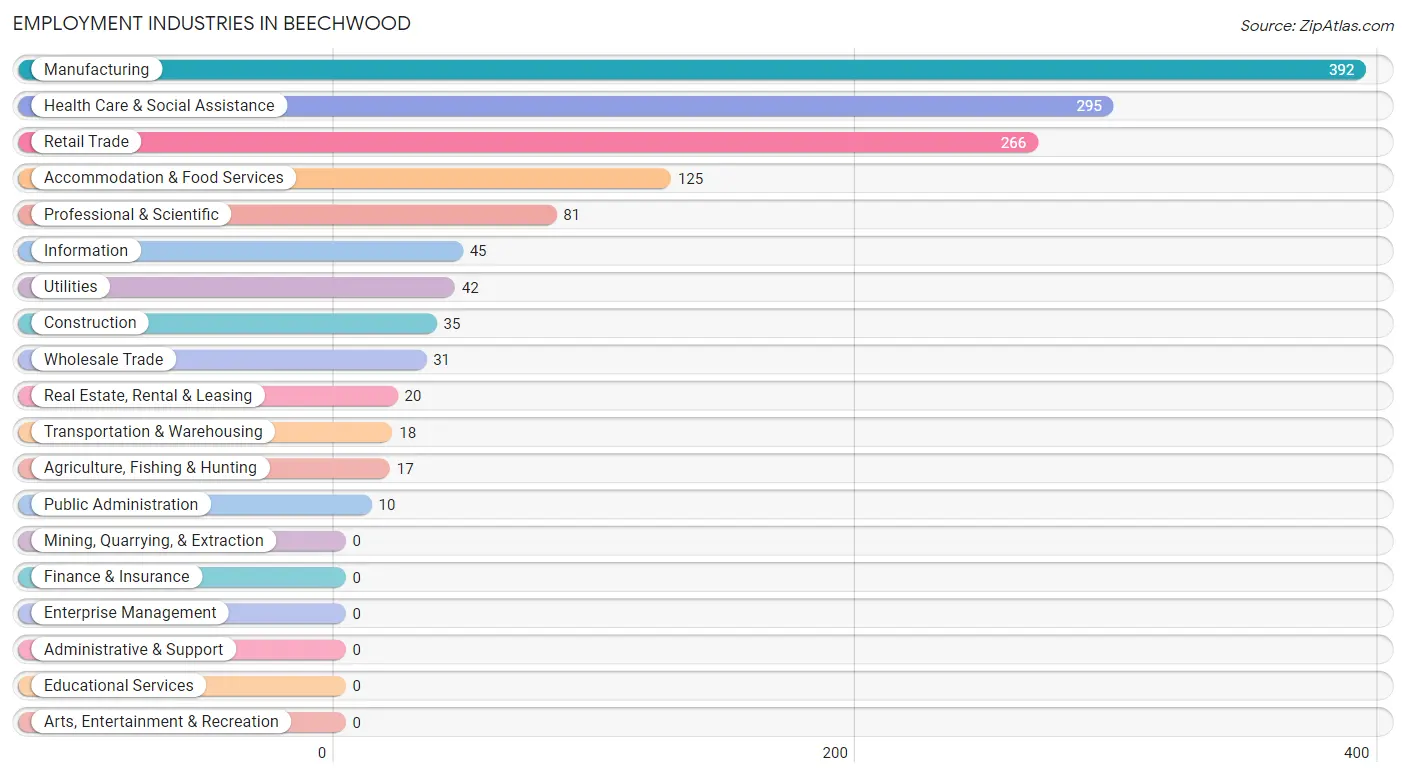
Employment Industries in Beechwood
The major employment industries in Beechwood include Manufacturing (392 | 27.9%), Health Care & Social Assistance (295 | 21.0%), Retail Trade (266 | 18.9%), Accommodation & Food Services (125 | 8.9%), and Professional & Scientific (81 | 5.8%).
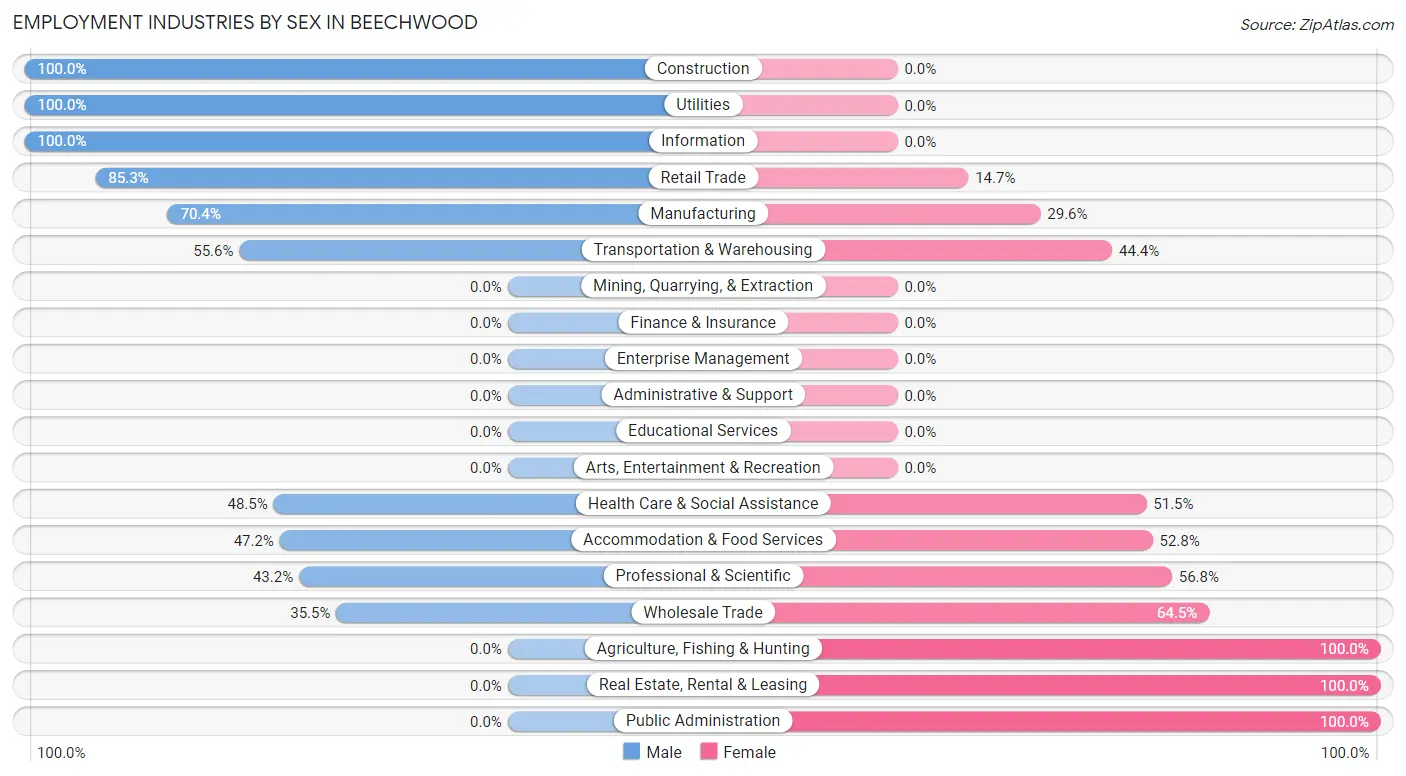
Employment Industries by Sex in Beechwood
The Beechwood industries that see more men than women are Construction (100.0%), Utilities (100.0%), and Information (100.0%), whereas the industries that tend to have a higher number of women are Agriculture, Fishing & Hunting (100.0%), Real Estate, Rental & Leasing (100.0%), and Public Administration (100.0%).
| Industry | Male | Female |
| Agriculture, Fishing & Hunting | 0 (0.0%) | 17 (100.0%) |
| Mining, Quarrying, & Extraction | 0 (0.0%) | 0 (0.0%) |
| Construction | 35 (100.0%) | 0 (0.0%) |
| Manufacturing | 276 (70.4%) | 116 (29.6%) |
| Wholesale Trade | 11 (35.5%) | 20 (64.5%) |
| Retail Trade | 227 (85.3%) | 39 (14.7%) |
| Transportation & Warehousing | 10 (55.6%) | 8 (44.4%) |
| Utilities | 42 (100.0%) | 0 (0.0%) |
| Information | 45 (100.0%) | 0 (0.0%) |
| Finance & Insurance | 0 (0.0%) | 0 (0.0%) |
| Real Estate, Rental & Leasing | 0 (0.0%) | 20 (100.0%) |
| Professional & Scientific | 35 (43.2%) | 46 (56.8%) |
| Enterprise Management | 0 (0.0%) | 0 (0.0%) |
| Administrative & Support | 0 (0.0%) | 0 (0.0%) |
| Educational Services | 0 (0.0%) | 0 (0.0%) |
| Health Care & Social Assistance | 143 (48.5%) | 152 (51.5%) |
| Arts, Entertainment & Recreation | 0 (0.0%) | 0 (0.0%) |
| Accommodation & Food Services | 59 (47.2%) | 66 (52.8%) |
| Public Administration | 0 (0.0%) | 10 (100.0%) |
| Total | 895 (63.6%) | 512 (36.4%) |
Education in Beechwood
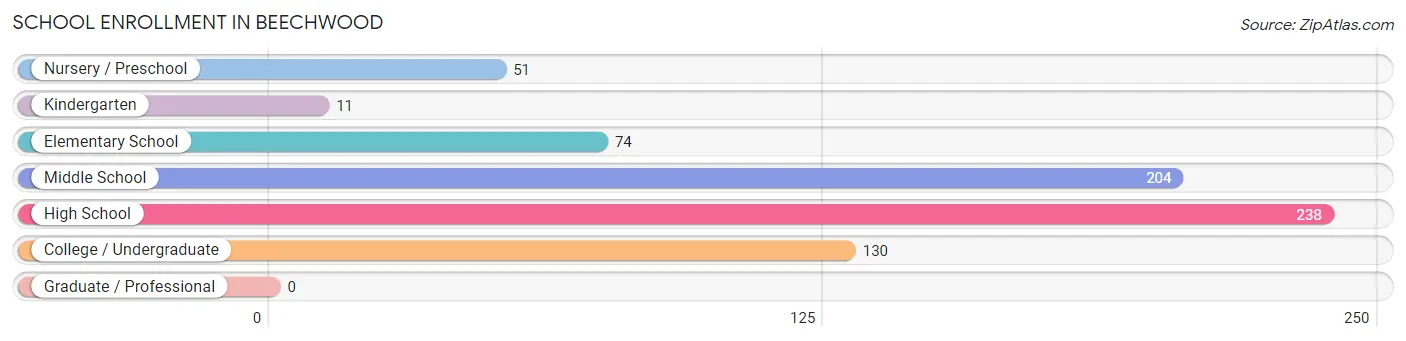
School Enrollment in Beechwood
The most common levels of schooling among the 708 students in Beechwood are high school (238 | 33.6%), middle school (204 | 28.8%), and college / undergraduate (130 | 18.4%).
| School Level | # Students | % Students |
| Nursery / Preschool | 51 | 7.2% |
| Kindergarten | 11 | 1.5% |
| Elementary School | 74 | 10.4% |
| Middle School | 204 | 28.8% |
| High School | 238 | 33.6% |
| College / Undergraduate | 130 | 18.4% |
| Graduate / Professional | 0 | 0.0% |
| Total | 708 | 100.0% |
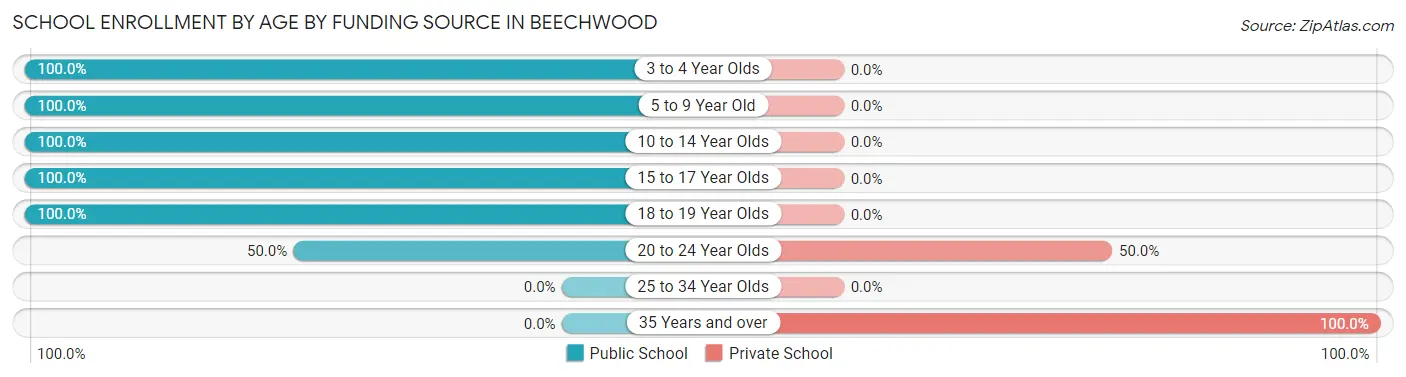
School Enrollment by Age by Funding Source in Beechwood
Out of a total of 708 students who are enrolled in schools in Beechwood, 80 (11.3%) attend a private institution, while the remaining 628 (88.7%) are enrolled in public schools. The age group of 35 years and over has the highest likelihood of being enrolled in private schools, with 10 (100.0% in the age bracket) enrolled. Conversely, the age group of 3 to 4 year olds has the lowest likelihood of being enrolled in a private school, with 29 (100.0% in the age bracket) attending a public institution.
| Age Bracket | Public School | Private School |
| 3 to 4 Year Olds | 29 (100.0%) | 0 (0.0%) |
| 5 to 9 Year Old | 107 (100.0%) | 0 (0.0%) |
| 10 to 14 Year Olds | 262 (100.0%) | 0 (0.0%) |
| 15 to 17 Year Olds | 153 (100.0%) | 0 (0.0%) |
| 18 to 19 Year Olds | 7 (100.0%) | 0 (0.0%) |
| 20 to 24 Year Olds | 70 (50.0%) | 70 (50.0%) |
| 25 to 34 Year Olds | 0 (0.0%) | 0 (0.0%) |
| 35 Years and over | 0 (0.0%) | 10 (100.0%) |
| Total | 628 (88.7%) | 80 (11.3%) |
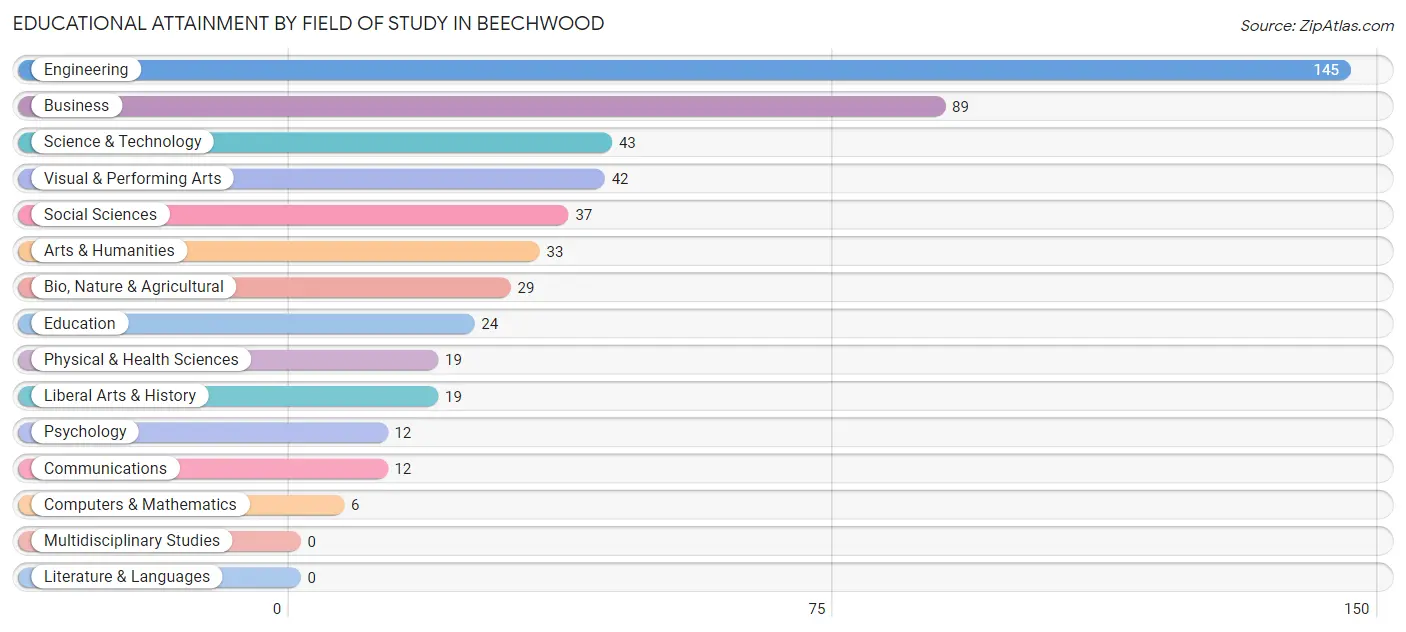
Educational Attainment by Field of Study in Beechwood
Engineering (145 | 28.4%), business (89 | 17.4%), science & technology (43 | 8.4%), visual & performing arts (42 | 8.2%), and social sciences (37 | 7.2%) are the most common fields of study among 510 individuals in Beechwood who have obtained a bachelor's degree or higher.
| Field of Study | # Graduates | % Graduates |
| Computers & Mathematics | 6 | 1.2% |
| Bio, Nature & Agricultural | 29 | 5.7% |
| Physical & Health Sciences | 19 | 3.7% |
| Psychology | 12 | 2.4% |
| Social Sciences | 37 | 7.2% |
| Engineering | 145 | 28.4% |
| Multidisciplinary Studies | 0 | 0.0% |
| Science & Technology | 43 | 8.4% |
| Business | 89 | 17.4% |
| Education | 24 | 4.7% |
| Literature & Languages | 0 | 0.0% |
| Liberal Arts & History | 19 | 3.7% |
| Visual & Performing Arts | 42 | 8.2% |
| Communications | 12 | 2.4% |
| Arts & Humanities | 33 | 6.5% |
| Total | 510 | 100.0% |
Transportation & Commute in Beechwood
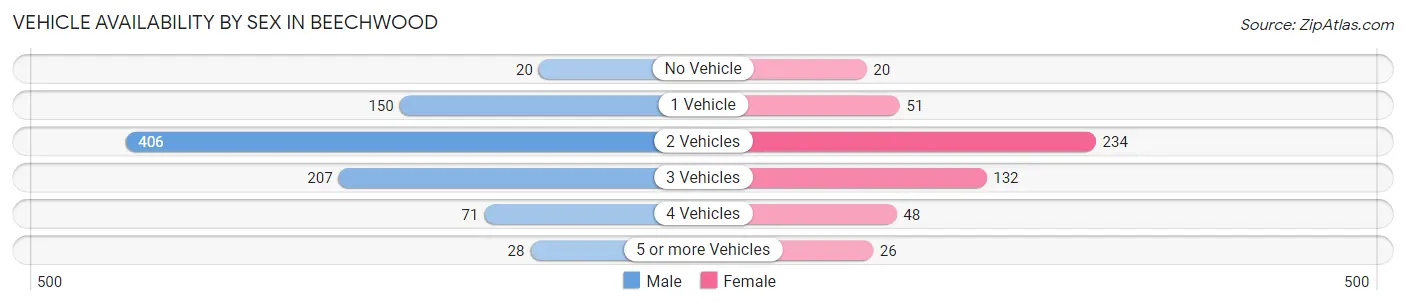
Vehicle Availability by Sex in Beechwood
The most prevalent vehicle ownership categories in Beechwood are males with 2 vehicles (406, accounting for 46.0%) and females with 2 vehicles (234, making up 79.4%).
| Vehicles Available | Male | Female |
| No Vehicle | 20 (2.3%) | 20 (3.9%) |
| 1 Vehicle | 150 (17.0%) | 51 (10.0%) |
| 2 Vehicles | 406 (46.0%) | 234 (45.8%) |
| 3 Vehicles | 207 (23.5%) | 132 (25.8%) |
| 4 Vehicles | 71 (8.1%) | 48 (9.4%) |
| 5 or more Vehicles | 28 (3.2%) | 26 (5.1%) |
| Total | 882 (100.0%) | 511 (100.0%) |
Commute Time in Beechwood
The most frequently occuring commute durations in Beechwood are 5 to 9 minutes (361 commuters, 26.4%), 15 to 19 minutes (289 commuters, 21.1%), and 10 to 14 minutes (254 commuters, 18.6%).
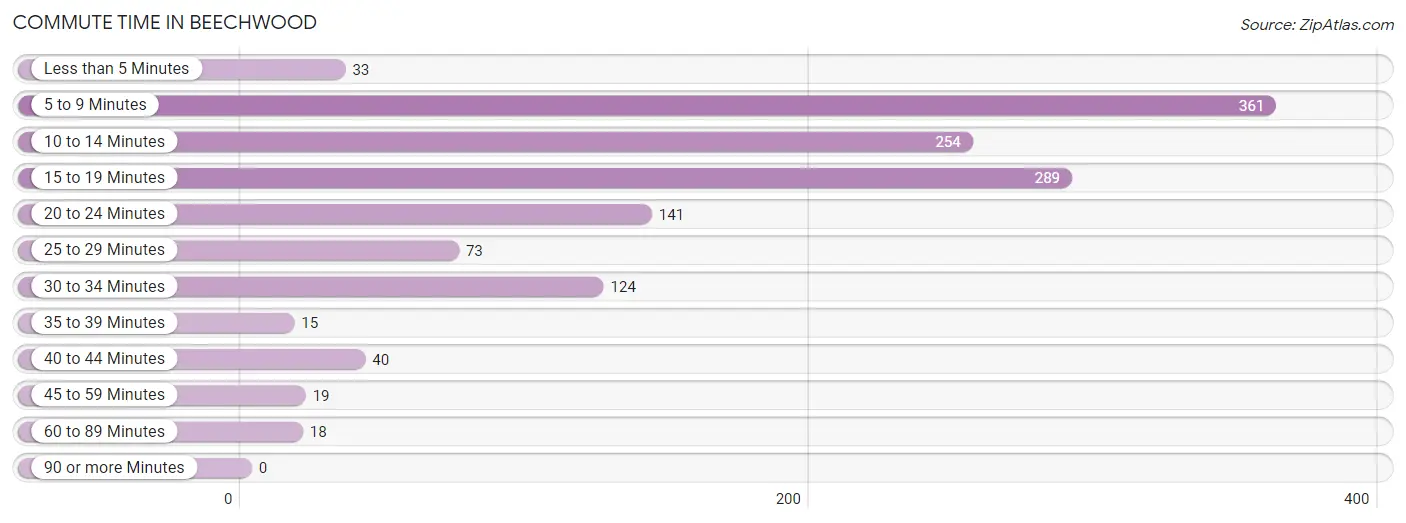
| Commute Time | # Commuters | % Commuters |
| Less than 5 Minutes | 33 | 2.4% |
| 5 to 9 Minutes | 361 | 26.4% |
| 10 to 14 Minutes | 254 | 18.6% |
| 15 to 19 Minutes | 289 | 21.1% |
| 20 to 24 Minutes | 141 | 10.3% |
| 25 to 29 Minutes | 73 | 5.3% |
| 30 to 34 Minutes | 124 | 9.1% |
| 35 to 39 Minutes | 15 | 1.1% |
| 40 to 44 Minutes | 40 | 2.9% |
| 45 to 59 Minutes | 19 | 1.4% |
| 60 to 89 Minutes | 18 | 1.3% |
| 90 or more Minutes | 0 | 0.0% |
Commute Time by Sex in Beechwood
The most common commute times in Beechwood are 15 to 19 minutes (206 commuters, 23.8%) for males and 5 to 9 minutes (179 commuters, 35.8%) for females.
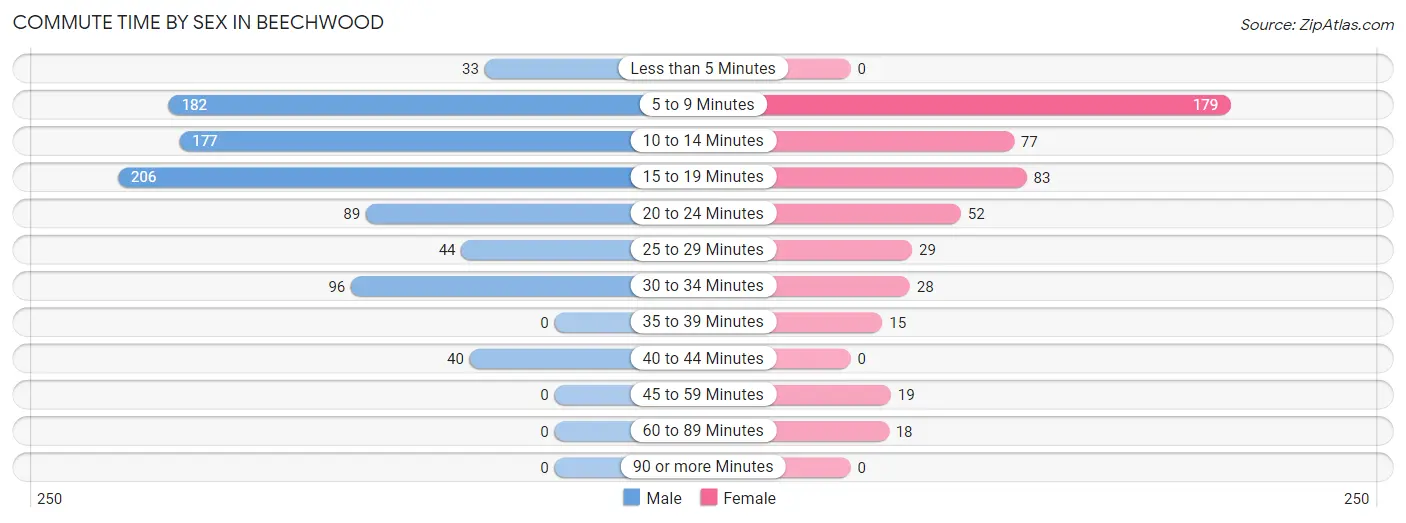
| Commute Time | Male | Female |
| Less than 5 Minutes | 33 (3.8%) | 0 (0.0%) |
| 5 to 9 Minutes | 182 (21.0%) | 179 (35.8%) |
| 10 to 14 Minutes | 177 (20.4%) | 77 (15.4%) |
| 15 to 19 Minutes | 206 (23.8%) | 83 (16.6%) |
| 20 to 24 Minutes | 89 (10.3%) | 52 (10.4%) |
| 25 to 29 Minutes | 44 (5.1%) | 29 (5.8%) |
| 30 to 34 Minutes | 96 (11.1%) | 28 (5.6%) |
| 35 to 39 Minutes | 0 (0.0%) | 15 (3.0%) |
| 40 to 44 Minutes | 40 (4.6%) | 0 (0.0%) |
| 45 to 59 Minutes | 0 (0.0%) | 19 (3.8%) |
| 60 to 89 Minutes | 0 (0.0%) | 18 (3.6%) |
| 90 or more Minutes | 0 (0.0%) | 0 (0.0%) |
Time of Departure to Work by Sex in Beechwood
The most frequent times of departure to work in Beechwood are 5:30 AM to 5:59 AM (200, 23.1%) for males and 4:00 PM to 11:59 PM (119, 23.8%) for females.
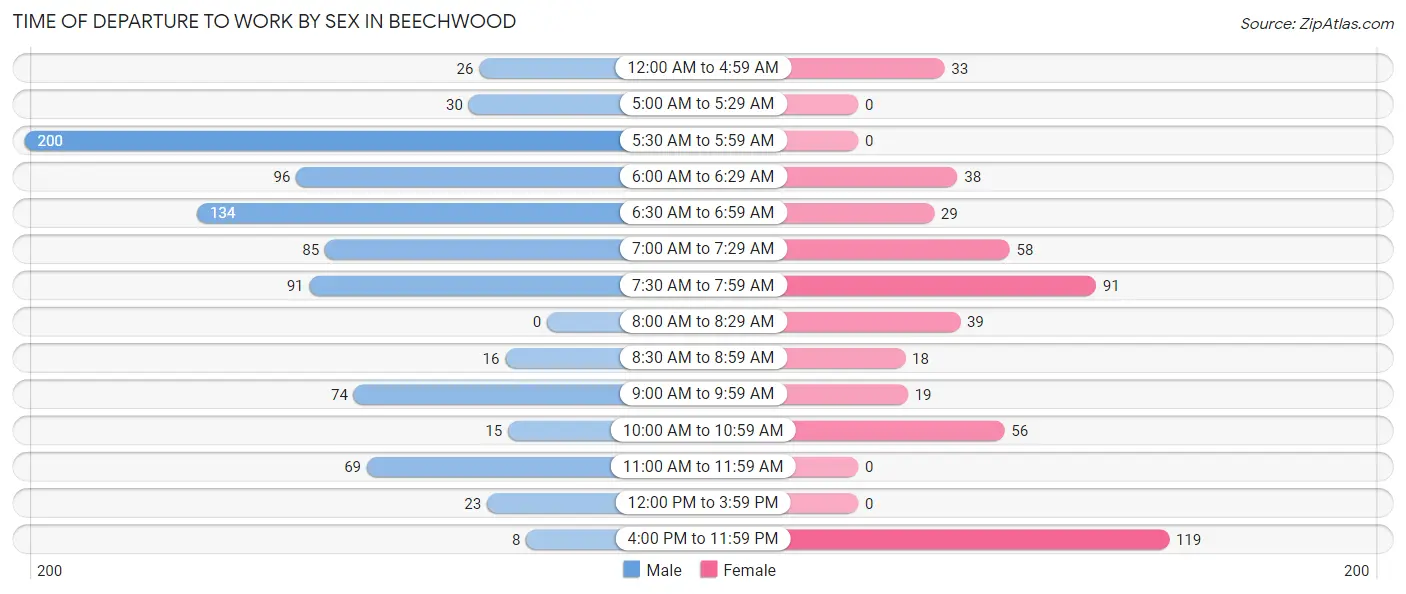
| Time of Departure | Male | Female |
| 12:00 AM to 4:59 AM | 26 (3.0%) | 33 (6.6%) |
| 5:00 AM to 5:29 AM | 30 (3.5%) | 0 (0.0%) |
| 5:30 AM to 5:59 AM | 200 (23.1%) | 0 (0.0%) |
| 6:00 AM to 6:29 AM | 96 (11.1%) | 38 (7.6%) |
| 6:30 AM to 6:59 AM | 134 (15.5%) | 29 (5.8%) |
| 7:00 AM to 7:29 AM | 85 (9.8%) | 58 (11.6%) |
| 7:30 AM to 7:59 AM | 91 (10.5%) | 91 (18.2%) |
| 8:00 AM to 8:29 AM | 0 (0.0%) | 39 (7.8%) |
| 8:30 AM to 8:59 AM | 16 (1.8%) | 18 (3.6%) |
| 9:00 AM to 9:59 AM | 74 (8.5%) | 19 (3.8%) |
| 10:00 AM to 10:59 AM | 15 (1.7%) | 56 (11.2%) |
| 11:00 AM to 11:59 AM | 69 (8.0%) | 0 (0.0%) |
| 12:00 PM to 3:59 PM | 23 (2.6%) | 0 (0.0%) |
| 4:00 PM to 11:59 PM | 8 (0.9%) | 119 (23.8%) |
| Total | 867 (100.0%) | 500 (100.0%) |
Housing Occupancy in Beechwood
Occupancy by Ownership in Beechwood
Of the total 1,012 dwellings in Beechwood, owner-occupied units account for 665 (65.7%), while renter-occupied units make up 347 (34.3%).
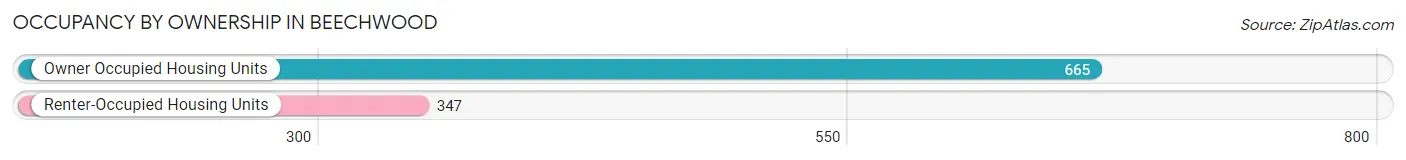
| Occupancy | # Housing Units | % Housing Units |
| Owner Occupied Housing Units | 665 | 65.7% |
| Renter-Occupied Housing Units | 347 | 34.3% |
| Total Occupied Housing Units | 1,012 | 100.0% |
Occupancy by Household Size in Beechwood
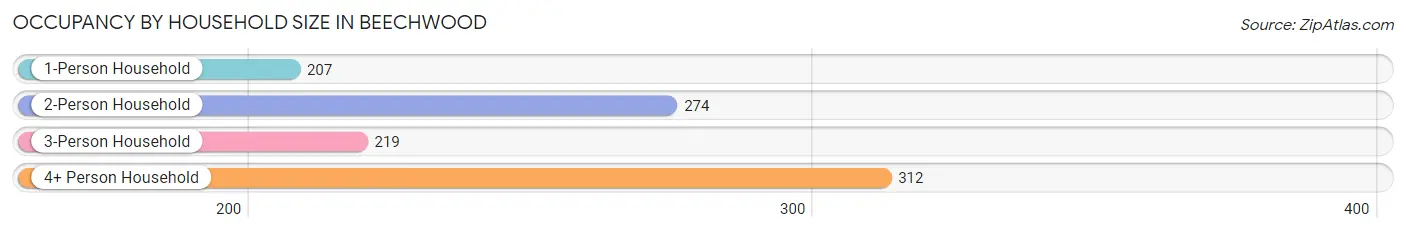
| Household Size | # Housing Units | % Housing Units |
| 1-Person Household | 207 | 20.4% |
| 2-Person Household | 274 | 27.1% |
| 3-Person Household | 219 | 21.6% |
| 4+ Person Household | 312 | 30.8% |
| Total Housing Units | 1,012 | 100.0% |
Occupancy by Ownership by Household Size in Beechwood
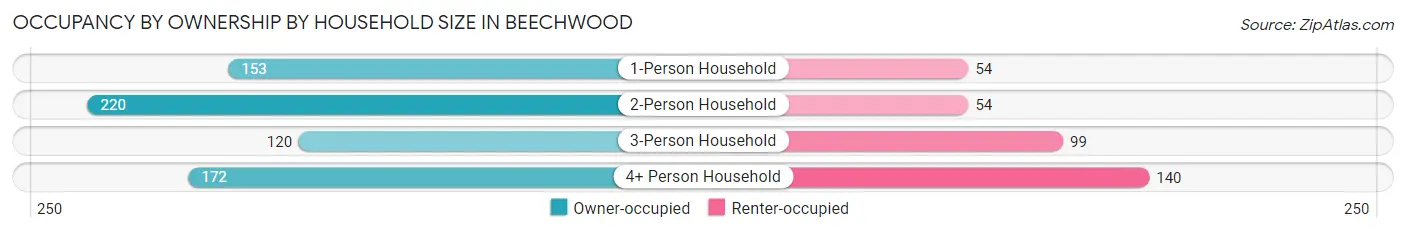
| Household Size | Owner-occupied | Renter-occupied |
| 1-Person Household | 153 (73.9%) | 54 (26.1%) |
| 2-Person Household | 220 (80.3%) | 54 (19.7%) |
| 3-Person Household | 120 (54.8%) | 99 (45.2%) |
| 4+ Person Household | 172 (55.1%) | 140 (44.9%) |
| Total Housing Units | 665 (65.7%) | 347 (34.3%) |
Occupancy by Educational Attainment in Beechwood
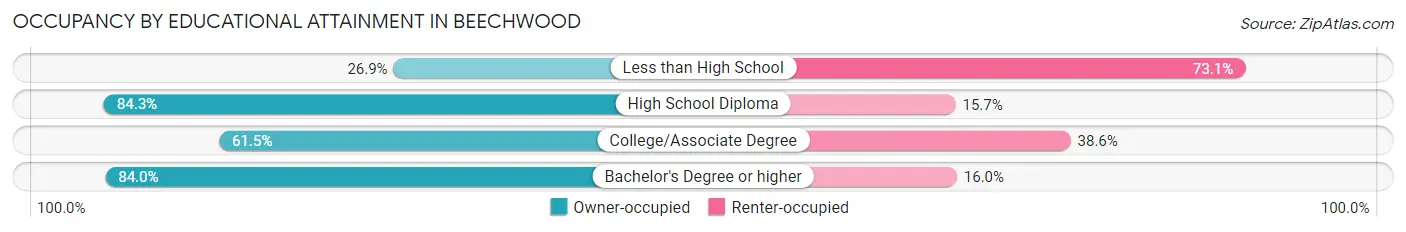
| Household Size | Owner-occupied | Renter-occupied |
| Less than High School | 61 (26.9%) | 166 (73.1%) |
| High School Diploma | 241 (84.3%) | 45 (15.7%) |
| College/Associate Degree | 153 (61.5%) | 96 (38.6%) |
| Bachelor's Degree or higher | 210 (84.0%) | 40 (16.0%) |
Occupancy by Age of Householder in Beechwood
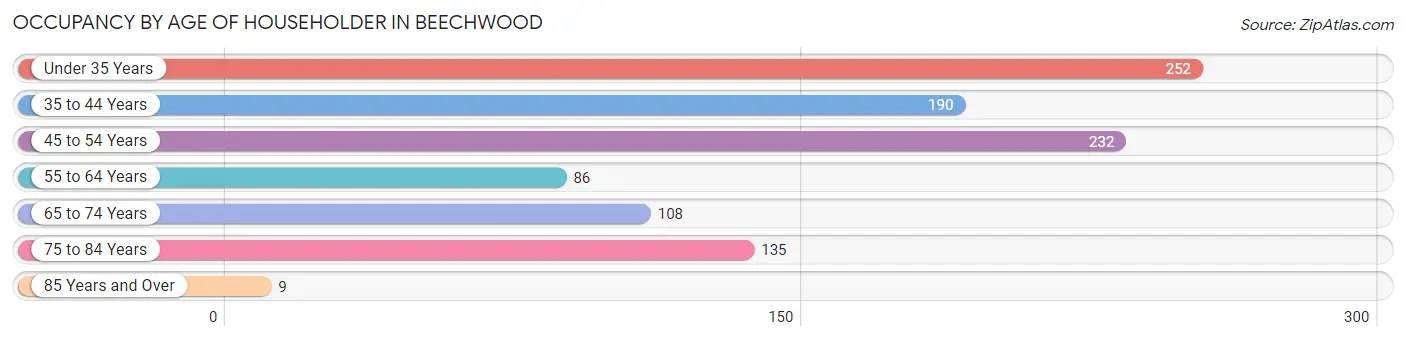
| Age Bracket | # Households | % Households |
| Under 35 Years | 252 | 24.9% |
| 35 to 44 Years | 190 | 18.8% |
| 45 to 54 Years | 232 | 22.9% |
| 55 to 64 Years | 86 | 8.5% |
| 65 to 74 Years | 108 | 10.7% |
| 75 to 84 Years | 135 | 13.3% |
| 85 Years and Over | 9 | 0.9% |
| Total | 1,012 | 100.0% |
Housing Finances in Beechwood
Median Income by Occupancy in Beechwood
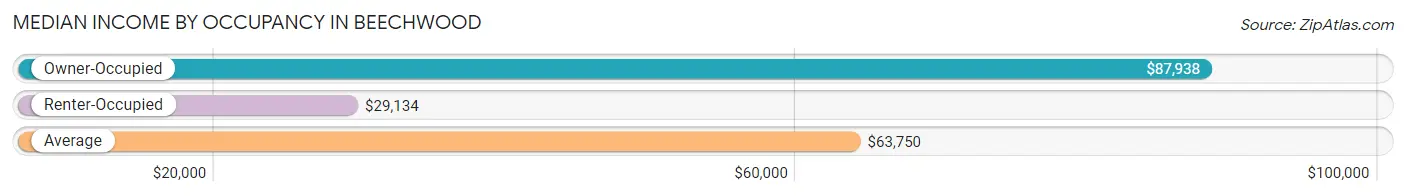
| Occupancy Type | # Households | Median Income |
| Owner-Occupied | 665 (65.7%) | $87,938 |
| Renter-Occupied | 347 (34.3%) | $29,134 |
| Average | 1,012 (100.0%) | $63,750 |
Occupancy by Householder Income Bracket in Beechwood
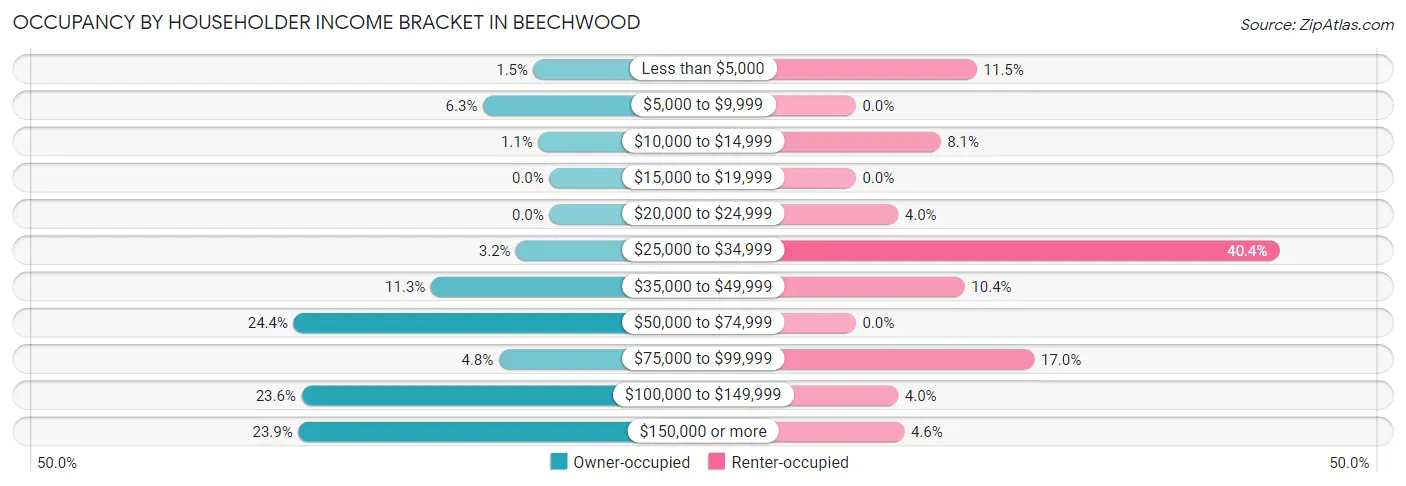
| Income Bracket | Owner-occupied | Renter-occupied |
| Less than $5,000 | 10 (1.5%) | 40 (11.5%) |
| $5,000 to $9,999 | 42 (6.3%) | 0 (0.0%) |
| $10,000 to $14,999 | 7 (1.1%) | 28 (8.1%) |
| $15,000 to $19,999 | 0 (0.0%) | 0 (0.0%) |
| $20,000 to $24,999 | 0 (0.0%) | 14 (4.0%) |
| $25,000 to $34,999 | 21 (3.2%) | 140 (40.4%) |
| $35,000 to $49,999 | 75 (11.3%) | 36 (10.4%) |
| $50,000 to $74,999 | 162 (24.4%) | 0 (0.0%) |
| $75,000 to $99,999 | 32 (4.8%) | 59 (17.0%) |
| $100,000 to $149,999 | 157 (23.6%) | 14 (4.0%) |
| $150,000 or more | 159 (23.9%) | 16 (4.6%) |
| Total | 665 (100.0%) | 347 (100.0%) |
Monthly Housing Cost Tiers in Beechwood
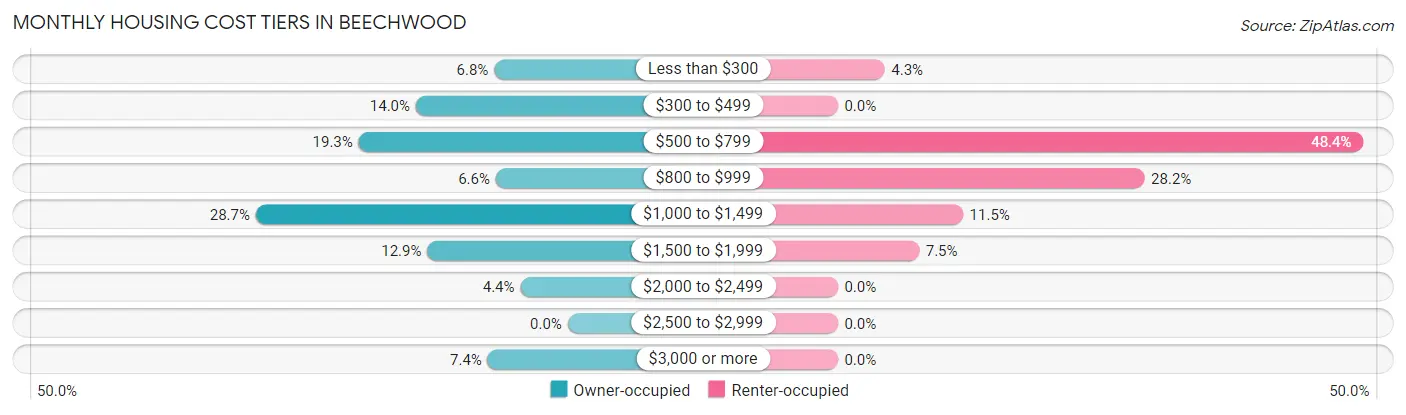
| Monthly Cost | Owner-occupied | Renter-occupied |
| Less than $300 | 45 (6.8%) | 15 (4.3%) |
| $300 to $499 | 93 (14.0%) | 0 (0.0%) |
| $500 to $799 | 128 (19.3%) | 168 (48.4%) |
| $800 to $999 | 44 (6.6%) | 98 (28.2%) |
| $1,000 to $1,499 | 191 (28.7%) | 40 (11.5%) |
| $1,500 to $1,999 | 86 (12.9%) | 26 (7.5%) |
| $2,000 to $2,499 | 29 (4.4%) | 0 (0.0%) |
| $2,500 to $2,999 | 0 (0.0%) | 0 (0.0%) |
| $3,000 or more | 49 (7.4%) | 0 (0.0%) |
| Total | 665 (100.0%) | 347 (100.0%) |
Physical Housing Characteristics in Beechwood
Housing Structures in Beechwood
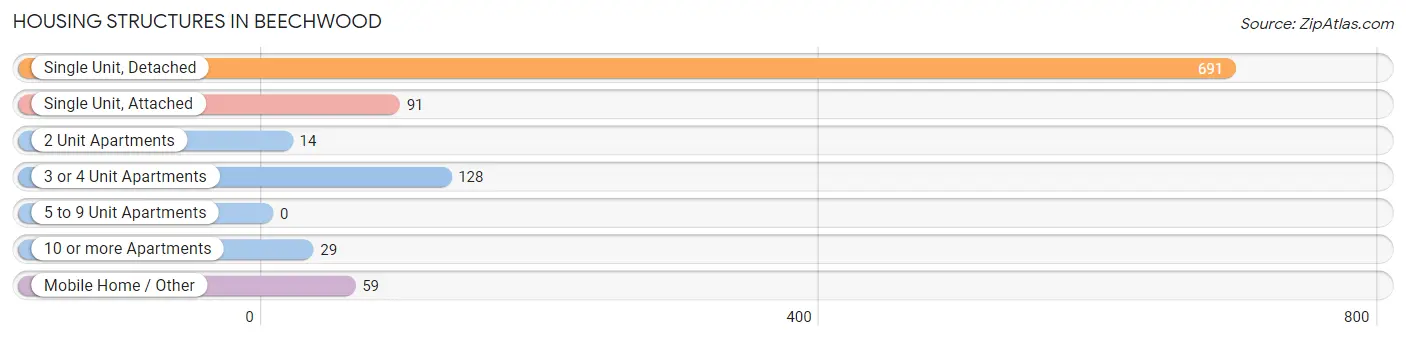
| Structure Type | # Housing Units | % Housing Units |
| Single Unit, Detached | 691 | 68.3% |
| Single Unit, Attached | 91 | 9.0% |
| 2 Unit Apartments | 14 | 1.4% |
| 3 or 4 Unit Apartments | 128 | 12.7% |
| 5 to 9 Unit Apartments | 0 | 0.0% |
| 10 or more Apartments | 29 | 2.9% |
| Mobile Home / Other | 59 | 5.8% |
| Total | 1,012 | 100.0% |
Housing Structures by Occupancy in Beechwood
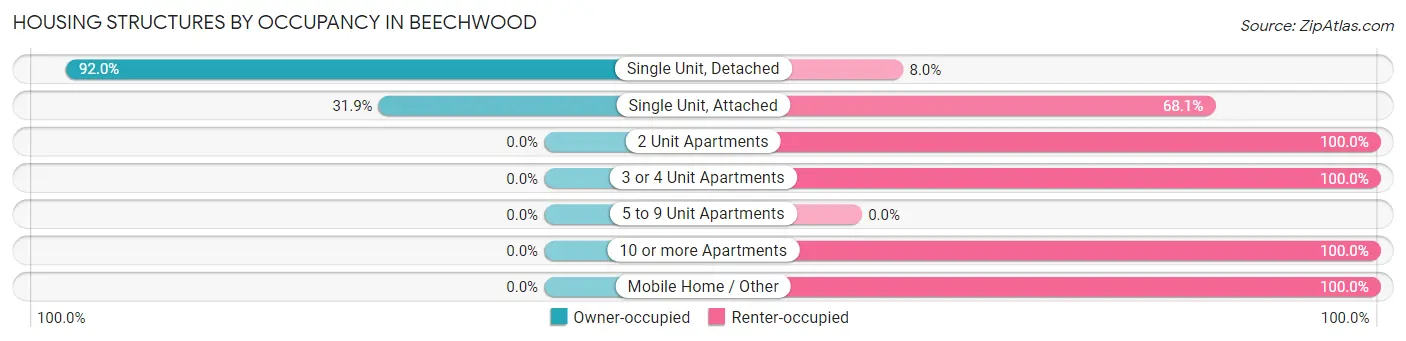
| Structure Type | Owner-occupied | Renter-occupied |
| Single Unit, Detached | 636 (92.0%) | 55 (8.0%) |
| Single Unit, Attached | 29 (31.9%) | 62 (68.1%) |
| 2 Unit Apartments | 0 (0.0%) | 14 (100.0%) |
| 3 or 4 Unit Apartments | 0 (0.0%) | 128 (100.0%) |
| 5 to 9 Unit Apartments | 0 (0.0%) | 0 (0.0%) |
| 10 or more Apartments | 0 (0.0%) | 29 (100.0%) |
| Mobile Home / Other | 0 (0.0%) | 59 (100.0%) |
| Total | 665 (65.7%) | 347 (34.3%) |
Housing Structures by Number of Rooms in Beechwood
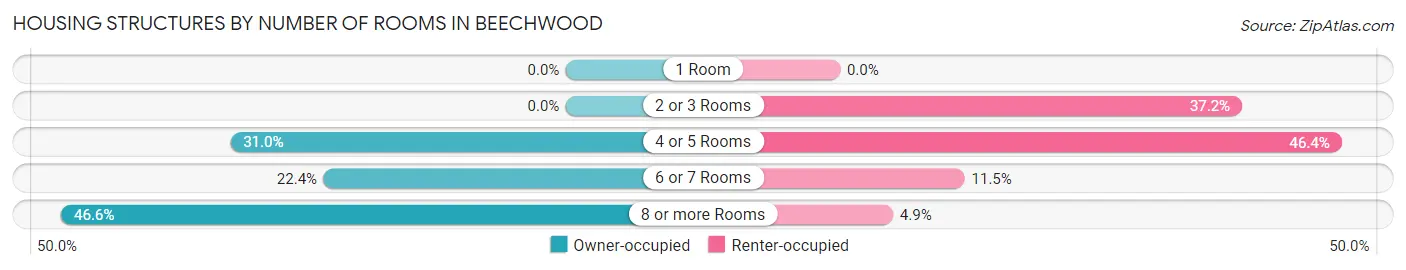
| Number of Rooms | Owner-occupied | Renter-occupied |
| 1 Room | 0 (0.0%) | 0 (0.0%) |
| 2 or 3 Rooms | 0 (0.0%) | 129 (37.2%) |
| 4 or 5 Rooms | 206 (31.0%) | 161 (46.4%) |
| 6 or 7 Rooms | 149 (22.4%) | 40 (11.5%) |
| 8 or more Rooms | 310 (46.6%) | 17 (4.9%) |
| Total | 665 (100.0%) | 347 (100.0%) |
Housing Structure by Heating Type in Beechwood
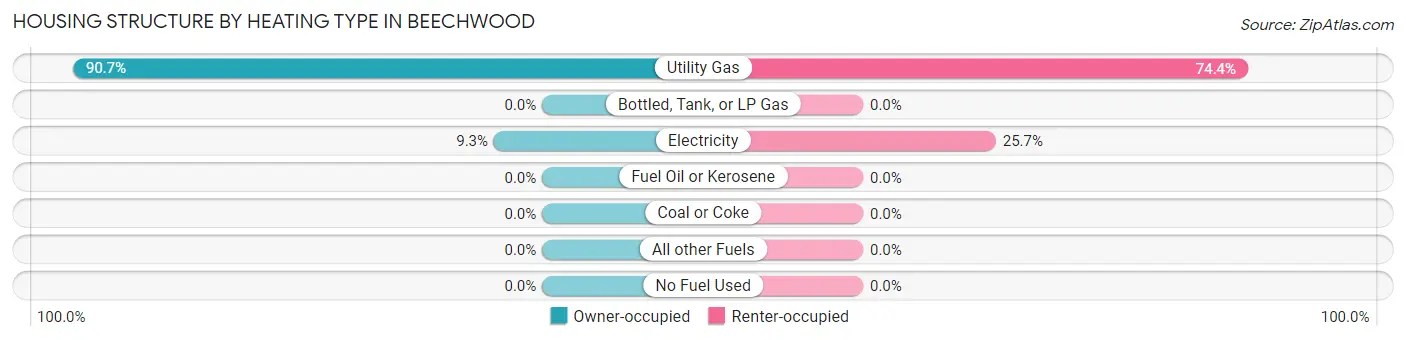
| Heating Type | Owner-occupied | Renter-occupied |
| Utility Gas | 603 (90.7%) | 258 (74.4%) |
| Bottled, Tank, or LP Gas | 0 (0.0%) | 0 (0.0%) |
| Electricity | 62 (9.3%) | 89 (25.7%) |
| Fuel Oil or Kerosene | 0 (0.0%) | 0 (0.0%) |
| Coal or Coke | 0 (0.0%) | 0 (0.0%) |
| All other Fuels | 0 (0.0%) | 0 (0.0%) |
| No Fuel Used | 0 (0.0%) | 0 (0.0%) |
| Total | 665 (100.0%) | 347 (100.0%) |
Household Vehicle Usage in Beechwood
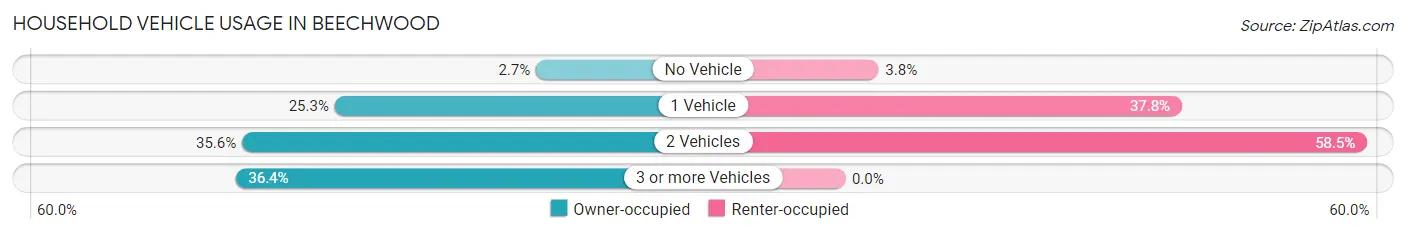
| Vehicles per Household | Owner-occupied | Renter-occupied |
| No Vehicle | 18 (2.7%) | 13 (3.7%) |
| 1 Vehicle | 168 (25.3%) | 131 (37.8%) |
| 2 Vehicles | 237 (35.6%) | 203 (58.5%) |
| 3 or more Vehicles | 242 (36.4%) | 0 (0.0%) |
| Total | 665 (100.0%) | 347 (100.0%) |
Real Estate & Mortgages in Beechwood
Real Estate and Mortgage Overview in Beechwood
| Characteristic | Without Mortgage | With Mortgage |
| Housing Units | 265 | 400 |
| Median Property Value | $195,500 | $205,600 |
| Median Household Income | $58,967 | $128 |
| Monthly Housing Costs | $488 | $38 |
| Real Estate Taxes | $2,442 | $0 |
Property Value by Mortgage Status in Beechwood
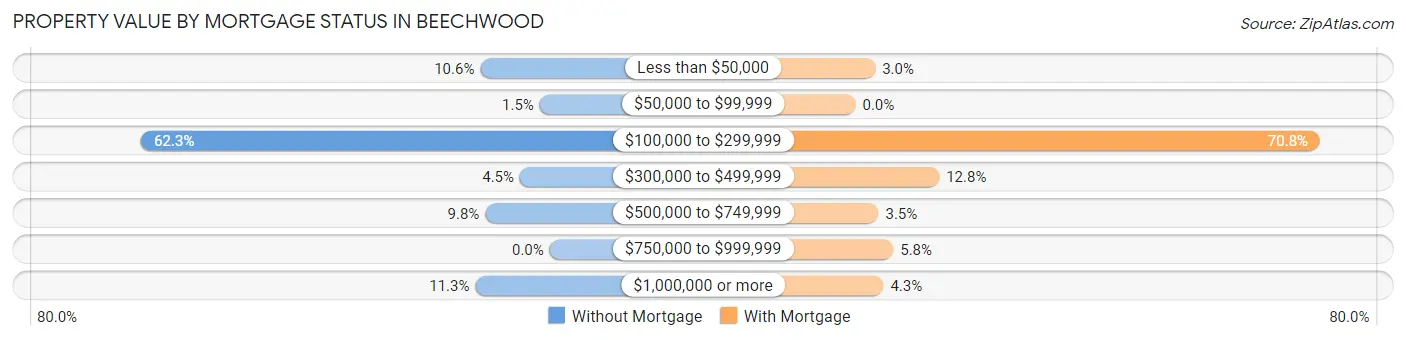
| Property Value | Without Mortgage | With Mortgage |
| Less than $50,000 | 28 (10.6%) | 12 (3.0%) |
| $50,000 to $99,999 | 4 (1.5%) | 0 (0.0%) |
| $100,000 to $299,999 | 165 (62.3%) | 283 (70.8%) |
| $300,000 to $499,999 | 12 (4.5%) | 51 (12.8%) |
| $500,000 to $749,999 | 26 (9.8%) | 14 (3.5%) |
| $750,000 to $999,999 | 0 (0.0%) | 23 (5.8%) |
| $1,000,000 or more | 30 (11.3%) | 17 (4.3%) |
| Total | 265 (100.0%) | 400 (100.0%) |
Household Income by Mortgage Status in Beechwood
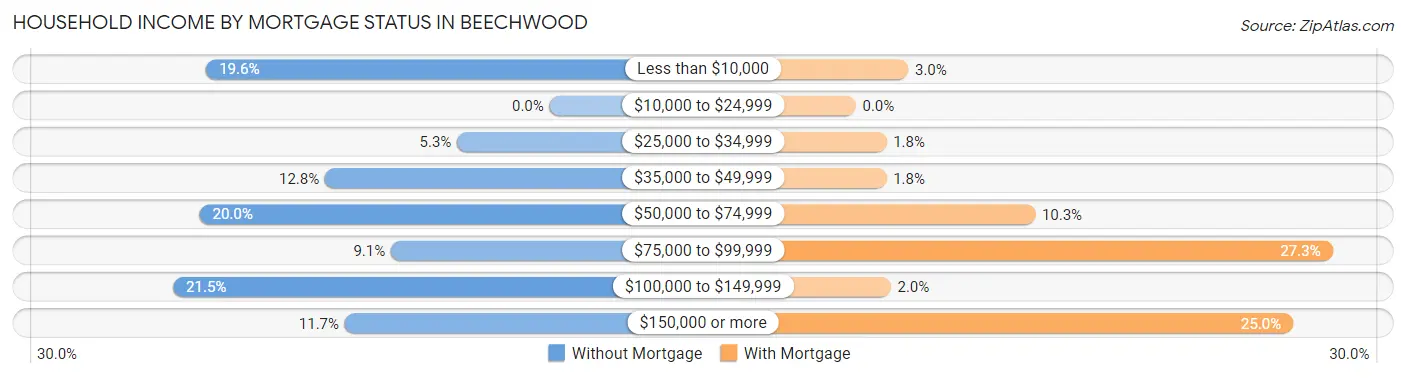
| Household Income | Without Mortgage | With Mortgage |
| Less than $10,000 | 52 (19.6%) | 12 (3.0%) |
| $10,000 to $24,999 | 0 (0.0%) | 0 (0.0%) |
| $25,000 to $34,999 | 14 (5.3%) | 7 (1.8%) |
| $35,000 to $49,999 | 34 (12.8%) | 7 (1.8%) |
| $50,000 to $74,999 | 53 (20.0%) | 41 (10.2%) |
| $75,000 to $99,999 | 24 (9.1%) | 109 (27.3%) |
| $100,000 to $149,999 | 57 (21.5%) | 8 (2.0%) |
| $150,000 or more | 31 (11.7%) | 100 (25.0%) |
| Total | 265 (100.0%) | 400 (100.0%) |
Property Value to Household Income Ratio in Beechwood
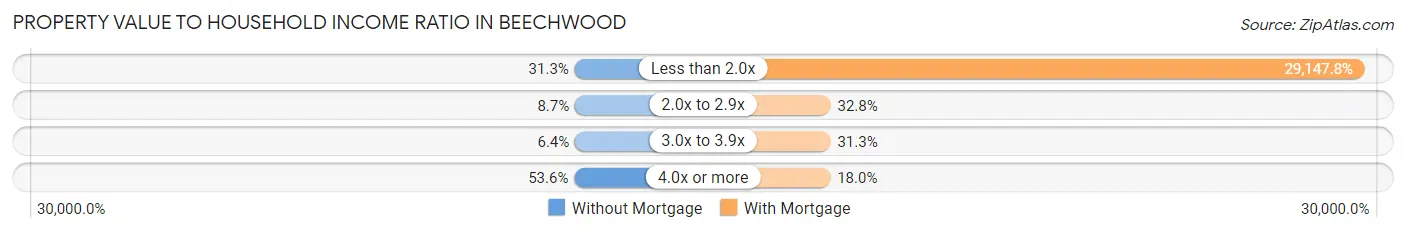
| Value-to-Income Ratio | Without Mortgage | With Mortgage |
| Less than 2.0x | 83 (31.3%) | 116,591 (29,147.8%) |
| 2.0x to 2.9x | 23 (8.7%) | 131 (32.8%) |
| 3.0x to 3.9x | 17 (6.4%) | 125 (31.2%) |
| 4.0x or more | 142 (53.6%) | 72 (18.0%) |
| Total | 265 (100.0%) | 400 (100.0%) |
Real Estate Taxes by Mortgage Status in Beechwood
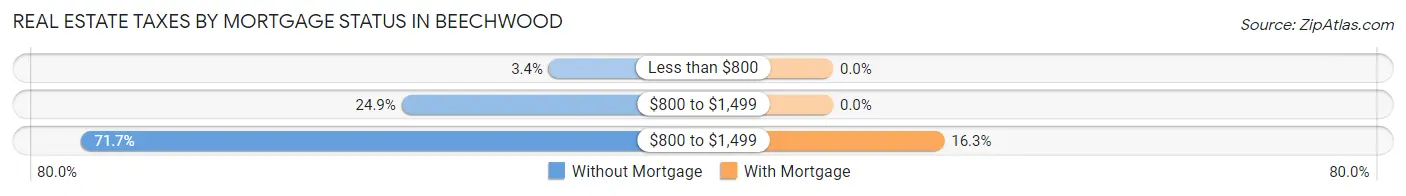
| Property Taxes | Without Mortgage | With Mortgage |
| Less than $800 | 9 (3.4%) | 0 (0.0%) |
| $800 to $1,499 | 66 (24.9%) | 0 (0.0%) |
| $800 to $1,499 | 190 (71.7%) | 65 (16.3%) |
| Total | 265 (100.0%) | 400 (100.0%) |
Health & Disability in Beechwood
Health Insurance Coverage by Age in Beechwood
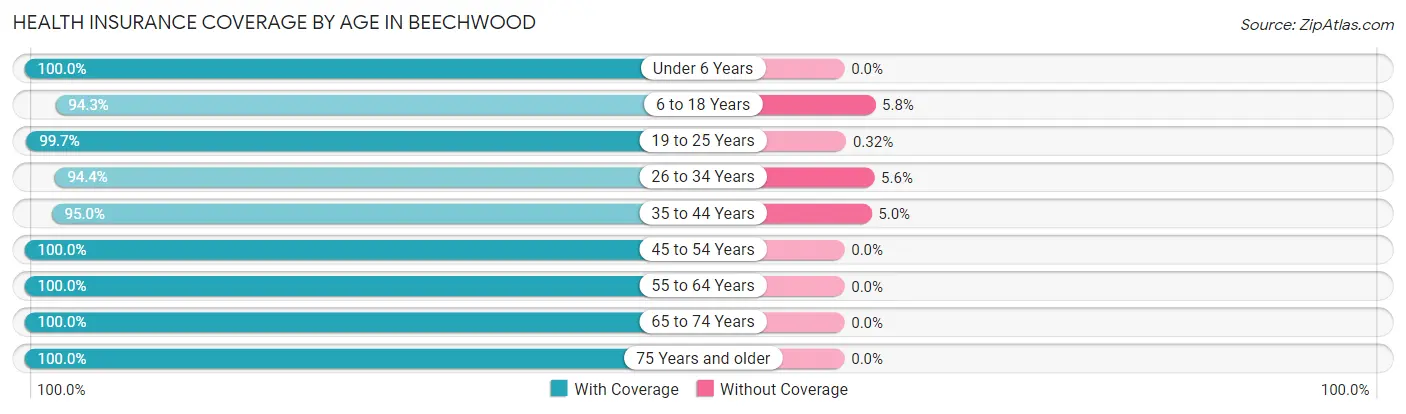
| Age Bracket | With Coverage | Without Coverage |
| Under 6 Years | 141 (100.0%) | 0 (0.0%) |
| 6 to 18 Years | 492 (94.3%) | 30 (5.8%) |
| 19 to 25 Years | 316 (99.7%) | 1 (0.3%) |
| 26 to 34 Years | 305 (94.4%) | 18 (5.6%) |
| 35 to 44 Years | 433 (95.0%) | 23 (5.0%) |
| 45 to 54 Years | 414 (100.0%) | 0 (0.0%) |
| 55 to 64 Years | 268 (100.0%) | 0 (0.0%) |
| 65 to 74 Years | 154 (100.0%) | 0 (0.0%) |
| 75 Years and older | 208 (100.0%) | 0 (0.0%) |
| Total | 2,731 (97.4%) | 72 (2.6%) |
Health Insurance Coverage by Citizenship Status in Beechwood
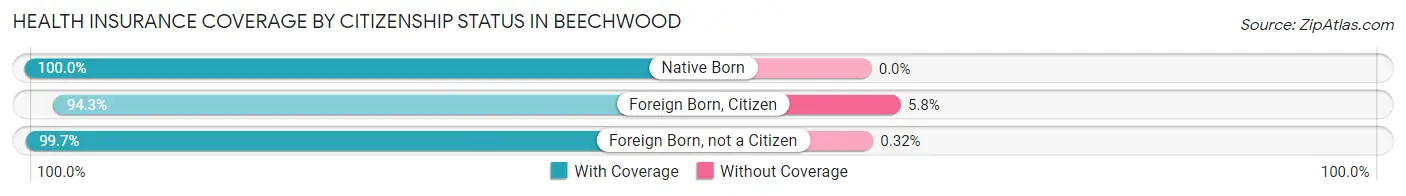
| Citizenship Status | With Coverage | Without Coverage |
| Native Born | 141 (100.0%) | 0 (0.0%) |
| Foreign Born, Citizen | 492 (94.3%) | 30 (5.8%) |
| Foreign Born, not a Citizen | 316 (99.7%) | 1 (0.3%) |
Health Insurance Coverage by Household Income in Beechwood
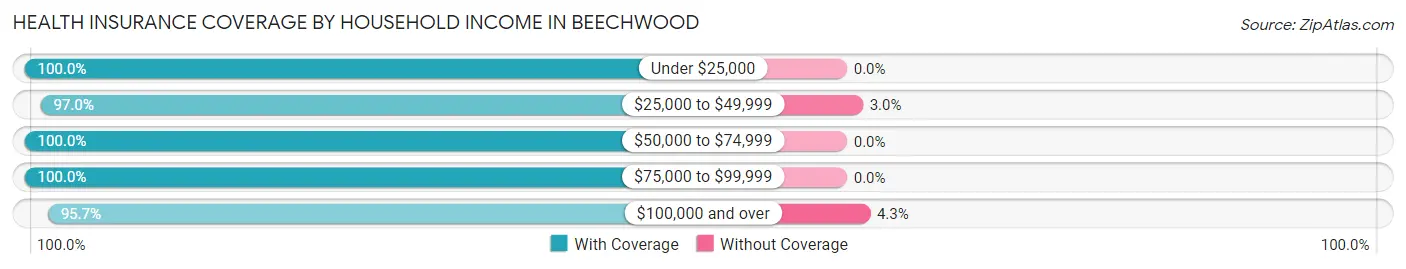
| Household Income | With Coverage | Without Coverage |
| Under $25,000 | 250 (100.0%) | 0 (0.0%) |
| $25,000 to $49,999 | 749 (97.0%) | 23 (3.0%) |
| $50,000 to $74,999 | 377 (100.0%) | 0 (0.0%) |
| $75,000 to $99,999 | 274 (100.0%) | 0 (0.0%) |
| $100,000 and over | 1,059 (95.7%) | 48 (4.3%) |
Public vs Private Health Insurance Coverage by Age in Beechwood
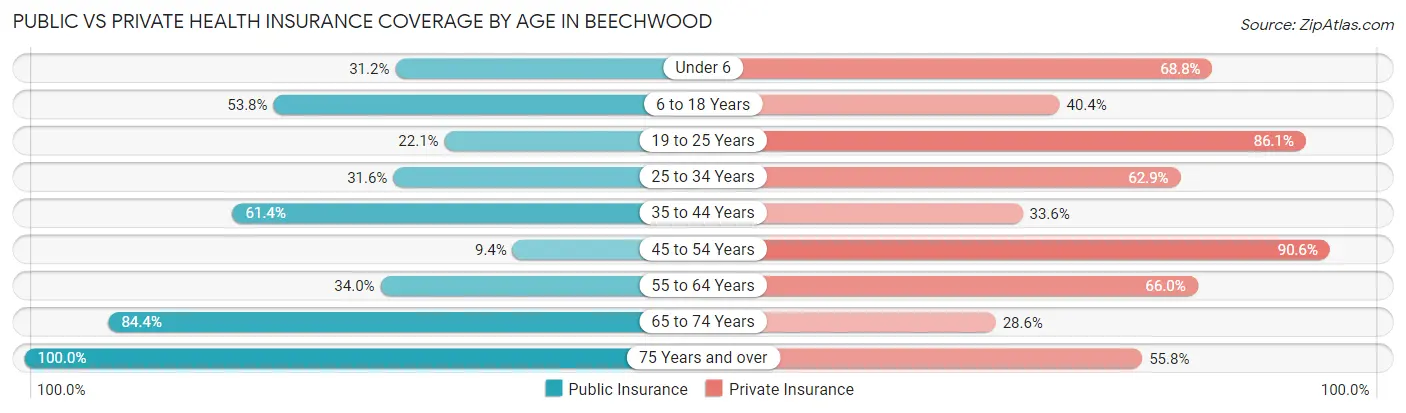
| Age Bracket | Public Insurance | Private Insurance |
| Under 6 | 44 (31.2%) | 97 (68.8%) |
| 6 to 18 Years | 281 (53.8%) | 211 (40.4%) |
| 19 to 25 Years | 70 (22.1%) | 273 (86.1%) |
| 25 to 34 Years | 102 (31.6%) | 203 (62.8%) |
| 35 to 44 Years | 280 (61.4%) | 153 (33.6%) |
| 45 to 54 Years | 39 (9.4%) | 375 (90.6%) |
| 55 to 64 Years | 91 (34.0%) | 177 (66.0%) |
| 65 to 74 Years | 130 (84.4%) | 44 (28.6%) |
| 75 Years and over | 208 (100.0%) | 116 (55.8%) |
| Total | 1,245 (44.4%) | 1,649 (58.8%) |
Disability Status by Sex by Age in Beechwood
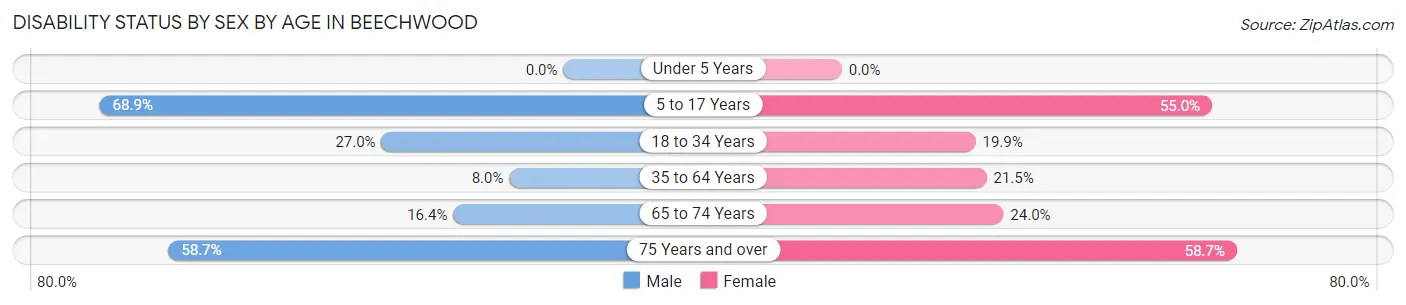
| Age Bracket | Male | Female |
| Under 5 Years | 0 (0.0%) | 0 (0.0%) |
| 5 to 17 Years | 179 (68.9%) | 144 (55.0%) |
| 18 to 34 Years | 104 (27.0%) | 55 (19.9%) |
| 35 to 64 Years | 45 (8.0%) | 124 (21.5%) |
| 65 to 74 Years | 17 (16.4%) | 12 (24.0%) |
| 75 Years and over | 61 (58.7%) | 61 (58.7%) |
Disability Class by Sex by Age in Beechwood
Disability Class: Hearing Difficulty
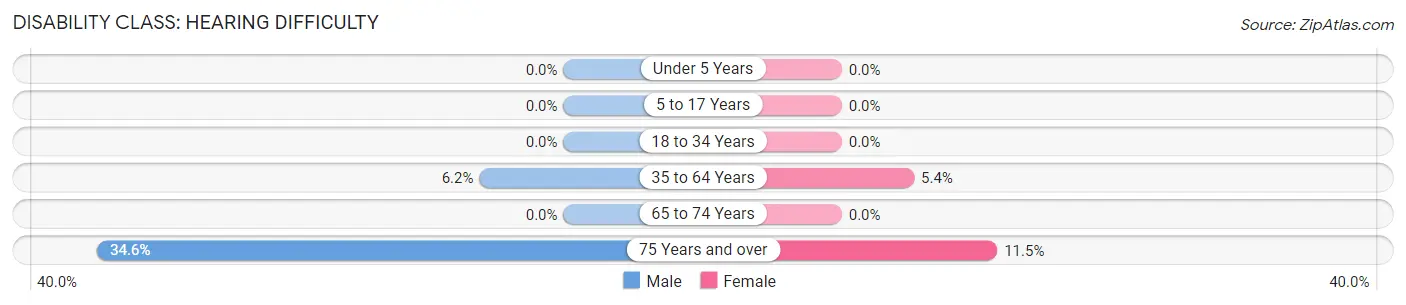
| Age Bracket | Male | Female |
| Under 5 Years | 0 (0.0%) | 0 (0.0%) |
| 5 to 17 Years | 0 (0.0%) | 0 (0.0%) |
| 18 to 34 Years | 0 (0.0%) | 0 (0.0%) |
| 35 to 64 Years | 35 (6.2%) | 31 (5.4%) |
| 65 to 74 Years | 0 (0.0%) | 0 (0.0%) |
| 75 Years and over | 36 (34.6%) | 12 (11.5%) |
Disability Class: Vision Difficulty
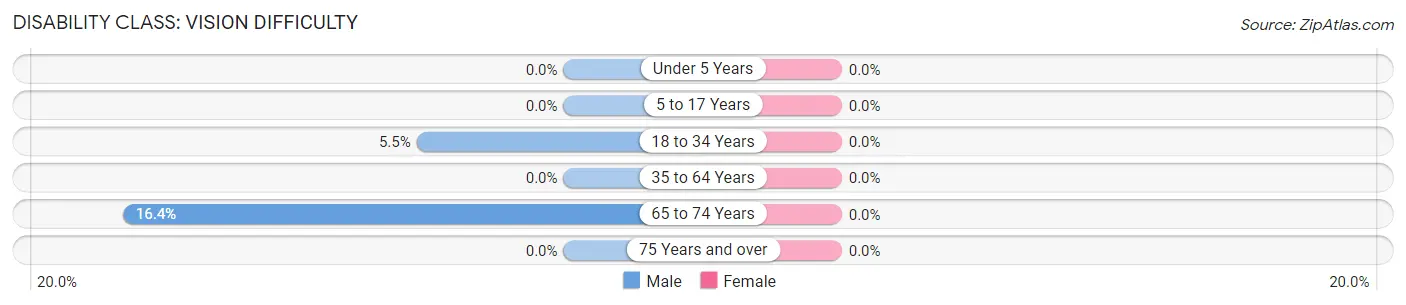
| Age Bracket | Male | Female |
| Under 5 Years | 0 (0.0%) | 0 (0.0%) |
| 5 to 17 Years | 0 (0.0%) | 0 (0.0%) |
| 18 to 34 Years | 21 (5.4%) | 0 (0.0%) |
| 35 to 64 Years | 0 (0.0%) | 0 (0.0%) |
| 65 to 74 Years | 17 (16.4%) | 0 (0.0%) |
| 75 Years and over | 0 (0.0%) | 0 (0.0%) |
Disability Class: Cognitive Difficulty
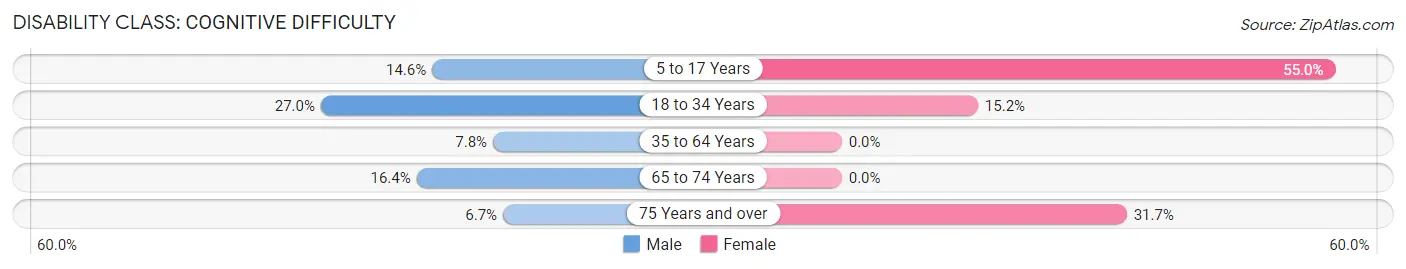
| Age Bracket | Male | Female |
| 5 to 17 Years | 38 (14.6%) | 144 (55.0%) |
| 18 to 34 Years | 104 (27.0%) | 42 (15.2%) |
| 35 to 64 Years | 44 (7.8%) | 0 (0.0%) |
| 65 to 74 Years | 17 (16.4%) | 0 (0.0%) |
| 75 Years and over | 7 (6.7%) | 33 (31.7%) |
Disability Class: Ambulatory Difficulty
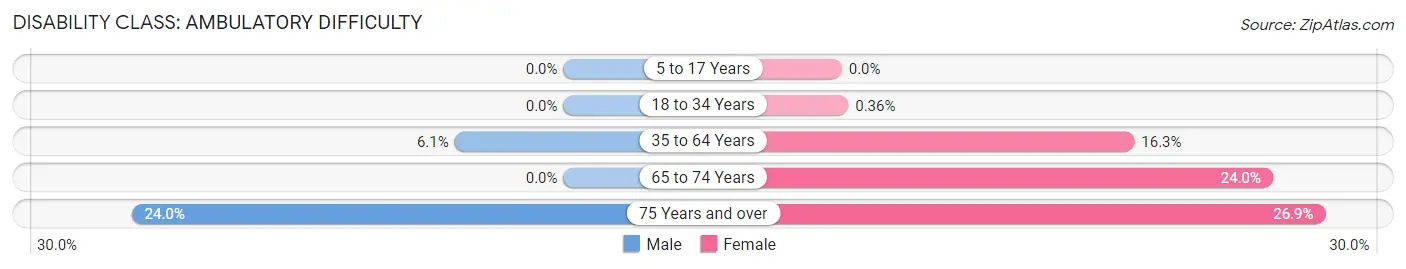
| Age Bracket | Male | Female |
| 5 to 17 Years | 0 (0.0%) | 0 (0.0%) |
| 18 to 34 Years | 0 (0.0%) | 1 (0.4%) |
| 35 to 64 Years | 34 (6.1%) | 94 (16.3%) |
| 65 to 74 Years | 0 (0.0%) | 12 (24.0%) |
| 75 Years and over | 25 (24.0%) | 28 (26.9%) |
Disability Class: Self-Care Difficulty
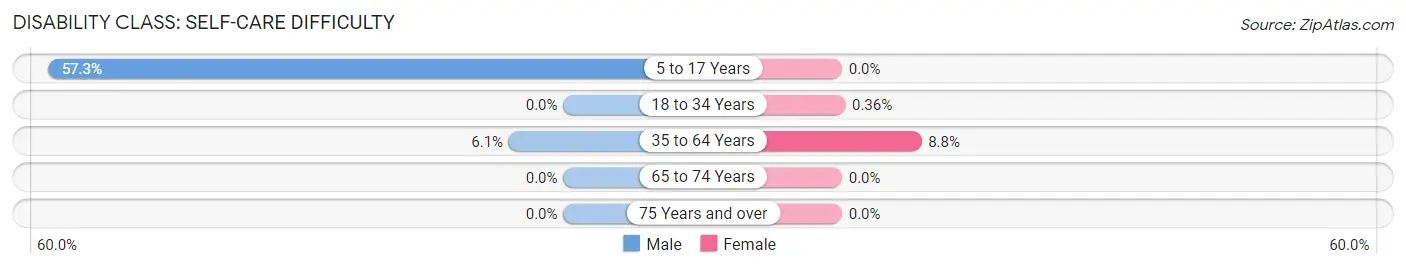
| Age Bracket | Male | Female |
| 5 to 17 Years | 149 (57.3%) | 0 (0.0%) |
| 18 to 34 Years | 0 (0.0%) | 1 (0.4%) |
| 35 to 64 Years | 34 (6.1%) | 51 (8.8%) |
| 65 to 74 Years | 0 (0.0%) | 0 (0.0%) |
| 75 Years and over | 0 (0.0%) | 0 (0.0%) |
Technology Access in Beechwood
Computing Device Access in Beechwood
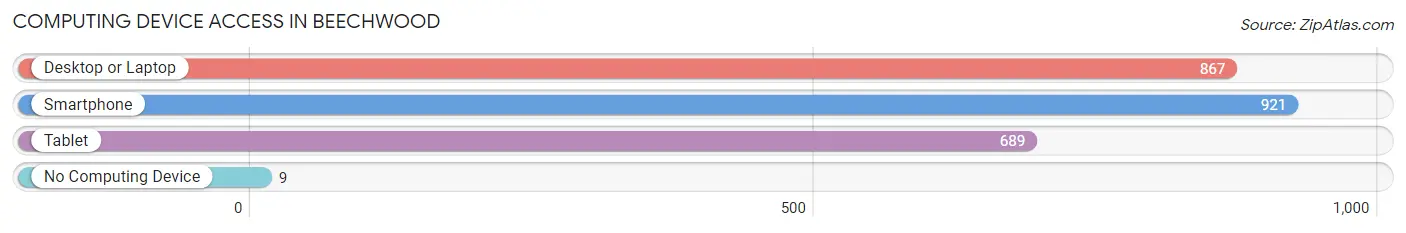
| Device Type | # Households | % Households |
| Desktop or Laptop | 867 | 85.7% |
| Smartphone | 921 | 91.0% |
| Tablet | 689 | 68.1% |
| No Computing Device | 9 | 0.9% |
| Total | 1,012 | 100.0% |
Internet Access in Beechwood
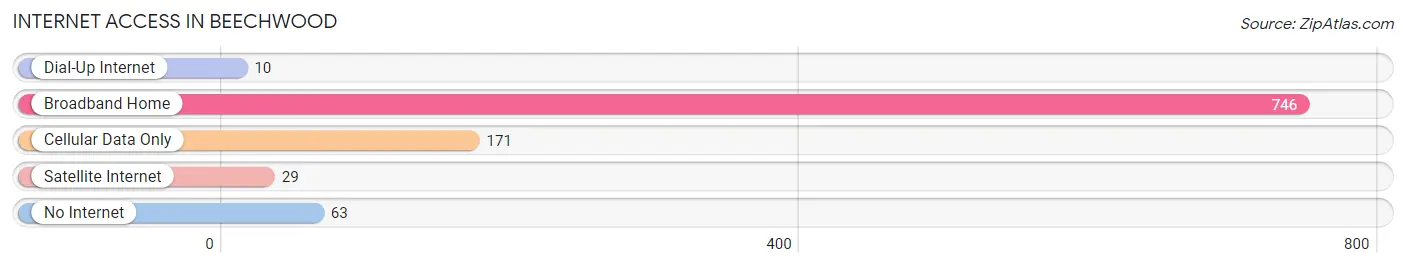
| Internet Type | # Households | % Households |
| Dial-Up Internet | 10 | 1.0% |
| Broadband Home | 746 | 73.7% |
| Cellular Data Only | 171 | 16.9% |
| Satellite Internet | 29 | 2.9% |
| No Internet | 63 | 6.2% |
| Total | 1,012 | 100.0% |
Beechwood Summary
Beechwood, Michigan is a small village located in the northern part of the state, in the county of Grand Traverse. It is situated on the shores of Lake Michigan, and is home to a population of just over 1,000 people. The village is known for its picturesque views of the lake, and its quaint downtown area.
Geography
Beechwood is located in the northern part of Michigan, in Grand Traverse County. It is situated on the shores of Lake Michigan, and is bordered by the towns of Traverse City, Kingsley, and Fife Lake. The village is located at an elevation of 645 feet above sea level, and covers an area of 1.2 square miles. The terrain is mostly flat, with some rolling hills in the surrounding area.
Climate
Beechwood has a humid continental climate, with warm summers and cold winters. The average temperature in the summer months is around 70 degrees Fahrenheit, while in the winter months it is around 30 degrees Fahrenheit. The area receives an average of 33 inches of precipitation per year, with most of it falling in the form of snow.
Demographics
As of the 2010 census, the population of Beechwood was 1,072. The racial makeup of the village was 97.2% White, 0.7% African American, 0.3% Native American, 0.2% Asian, 0.1% Pacific Islander, 0.3% from other races, and 1.2% from two or more races. Hispanic or Latino of any race were 1.2% of the population.
Economy
Beechwood’s economy is largely based on tourism and agriculture. The village is home to several small businesses, including restaurants, shops, and galleries. The area is also home to several wineries, and is a popular destination for wine tasting. The village is also home to a number of farms, which produce a variety of fruits and vegetables.
History
Beechwood was first settled in the early 1800s by a group of settlers from New York. The village was originally known as “Beechwood Station”, and was a stop on the Grand Rapids and Indiana Railroad. The village was officially incorporated in 1891, and the name was changed to Beechwood. The village grew steadily throughout the 20th century, and today is a popular tourist destination.
Conclusion
Beechwood, Michigan is a small village located in the northern part of the state, in the county of Grand Traverse. It is situated on the shores of Lake Michigan, and is home to a population of just over 1,000 people. The village is known for its picturesque views of the lake, and its quaint downtown area. The economy of Beechwood is largely based on tourism and agriculture, and the village is home to several small businesses, wineries, and farms. Beechwood was first settled in the early 1800s, and was officially incorporated in 1891. Today, the village is a popular tourist destination, and is known for its beautiful views of Lake Michigan.
Common Questions
What is the Total Population of Beechwood?
Total Population of Beechwood is 2,803.
What is the Total Male Population of Beechwood?
Total Male Population of Beechwood is 1,445.
What is the Total Female Population of Beechwood?
Total Female Population of Beechwood is 1,358.
What is the Ratio of Males per 100 Females in Beechwood?
There are 106.41 Males per 100 Females in Beechwood.
What is the Ratio of Females per 100 Males in Beechwood?
There are 93.98 Females per 100 Males in Beechwood.
What is the Median Population Age in Beechwood?
Median Population Age in Beechwood is 36.2 Years.
What is the Average Family Size in Beechwood
Average Family Size in Beechwood is 3.2 People.
What is the Average Household Size in Beechwood
Average Household Size in Beechwood is 2.8 People.
What is Per Capita Income in Beechwood?
Per Capita income in Beechwood is $34,997.
What is the Median Family Income in Beechwood?
Median Family Income in Beechwood is $60,592.
What is the Median Household income in Beechwood?
Median Household Income in Beechwood is $63,750.
What is Income or Wage Gap in Beechwood?
Income or Wage Gap in Beechwood is 26.1%.
Women in Beechwood earn 73.9 cents for every dollar earned by a man.
What is Inequality or Gini Index in Beechwood?
Inequality or Gini Index in Beechwood is 0.50.
How Large is the Labor Force in Beechwood?
There are 1,713 People in the Labor Forcein in Beechwood.
What is the Percentage of People in the Labor Force in Beechwood?
74.2% of People are in the Labor Force in Beechwood.
What is the Unemployment Rate in Beechwood?
Unemployment Rate in Beechwood is 17.9%.