Woodhaven, MI
Woodhaven Map
Woodhaven Overview
12,867
TOTAL POPULATION
5,962
MALE POPULATION
6,905
FEMALE POPULATION
86.34
MALES / 100 FEMALES
115.82
FEMALES / 100 MALES
45.8
MEDIAN AGE
3.0
AVG FAMILY SIZE
2.4
AVG HOUSEHOLD SIZE
$38,013
PER CAPITA INCOME
$96,667
AVG FAMILY INCOME
$77,725
AVG HOUSEHOLD INCOME
31.8%
WAGE / INCOME GAP [ % ]
68.2¢/ $1
WAGE / INCOME GAP [ $ ]
0.36
INEQUALITY / GINI INDEX
6,192
LABOR FORCE [ PEOPLE ]
57.8%
PERCENT IN LABOR FORCE
5.0%
UNEMPLOYMENT RATE
Woodhaven Area Codes
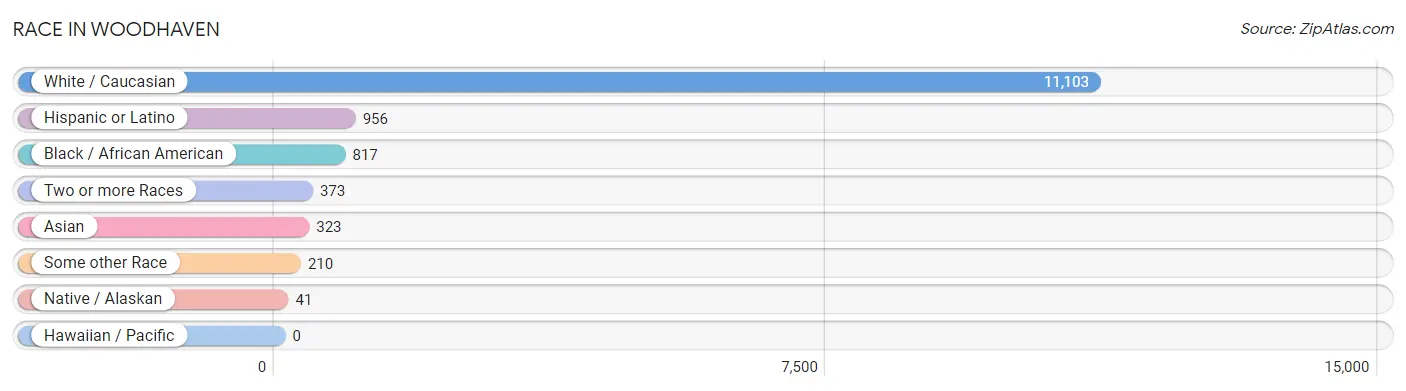
Race in Woodhaven
The most populous races in Woodhaven are White / Caucasian (11,103 | 86.3%), Hispanic or Latino (956 | 7.4%), and Black / African American (817 | 6.4%).
| Race | # Population | % Population |
| Asian | 323 | 2.5% |
| Black / African American | 817 | 6.4% |
| Hawaiian / Pacific | 0 | 0.0% |
| Hispanic or Latino | 956 | 7.4% |
| Native / Alaskan | 41 | 0.3% |
| White / Caucasian | 11,103 | 86.3% |
| Two or more Races | 373 | 2.9% |
| Some other Race | 210 | 1.6% |
| Total | 12,867 | 100.0% |
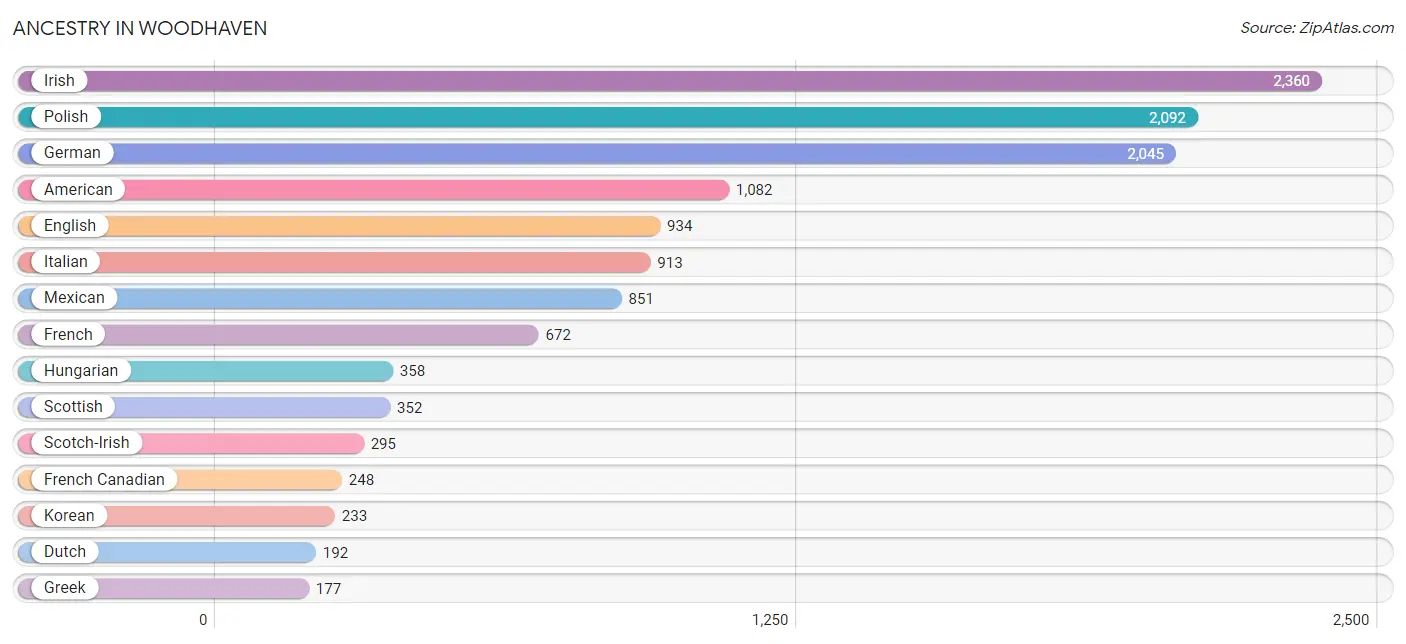
Ancestry in Woodhaven
The most populous ancestries reported in Woodhaven are Irish (2,360 | 18.3%), Polish (2,092 | 16.3%), German (2,045 | 15.9%), American (1,082 | 8.4%), and English (934 | 7.3%), together accounting for 66.2% of all Woodhaven residents.
| Ancestry | # Population | % Population |
| Albanian | 15 | 0.1% |
| American | 1,082 | 8.4% |
| Arab | 34 | 0.3% |
| Armenian | 23 | 0.2% |
| Austrian | 7 | 0.1% |
| Belgian | 93 | 0.7% |
| Bhutanese | 1 | 0.0% |
| Blackfeet | 5 | 0.0% |
| British | 30 | 0.2% |
| Burmese | 10 | 0.1% |
| Canadian | 10 | 0.1% |
| Cherokee | 59 | 0.5% |
| Chippewa | 9 | 0.1% |
| Croatian | 51 | 0.4% |
| Czech | 53 | 0.4% |
| Danish | 17 | 0.1% |
| Dutch | 192 | 1.5% |
| Eastern European | 21 | 0.2% |
| English | 934 | 7.3% |
| European | 75 | 0.6% |
| Finnish | 75 | 0.6% |
| French | 672 | 5.2% |
| French Canadian | 248 | 1.9% |
| German | 2,045 | 15.9% |
| Greek | 177 | 1.4% |
| Guyanese | 7 | 0.1% |
| Hungarian | 358 | 2.8% |
| Indian (Asian) | 19 | 0.2% |
| Irish | 2,360 | 18.3% |
| Iroquois | 9 | 0.1% |
| Italian | 913 | 7.1% |
| Jamaican | 19 | 0.2% |
| Korean | 233 | 1.8% |
| Lebanese | 34 | 0.3% |
| Lithuanian | 21 | 0.2% |
| Macedonian | 27 | 0.2% |
| Maltese | 150 | 1.2% |
| Menominee | 21 | 0.2% |
| Mexican | 851 | 6.6% |
| Native Hawaiian | 51 | 0.4% |
| Northern European | 13 | 0.1% |
| Norwegian | 92 | 0.7% |
| Polish | 2,092 | 16.3% |
| Portuguese | 30 | 0.2% |
| Puerto Rican | 72 | 0.6% |
| Russian | 32 | 0.3% |
| Scandinavian | 64 | 0.5% |
| Scotch-Irish | 295 | 2.3% |
| Scottish | 352 | 2.7% |
| Serbian | 33 | 0.3% |
| Slavic | 9 | 0.1% |
| Slovak | 51 | 0.4% |
| Slovene | 10 | 0.1% |
| Spaniard | 17 | 0.1% |
| Spanish | 11 | 0.1% |
| Swedish | 142 | 1.1% |
| Thai | 67 | 0.5% |
| Ukrainian | 102 | 0.8% |
| Welsh | 11 | 0.1% |
| Yugoslavian | 12 | 0.1% | View All 60 Rows |
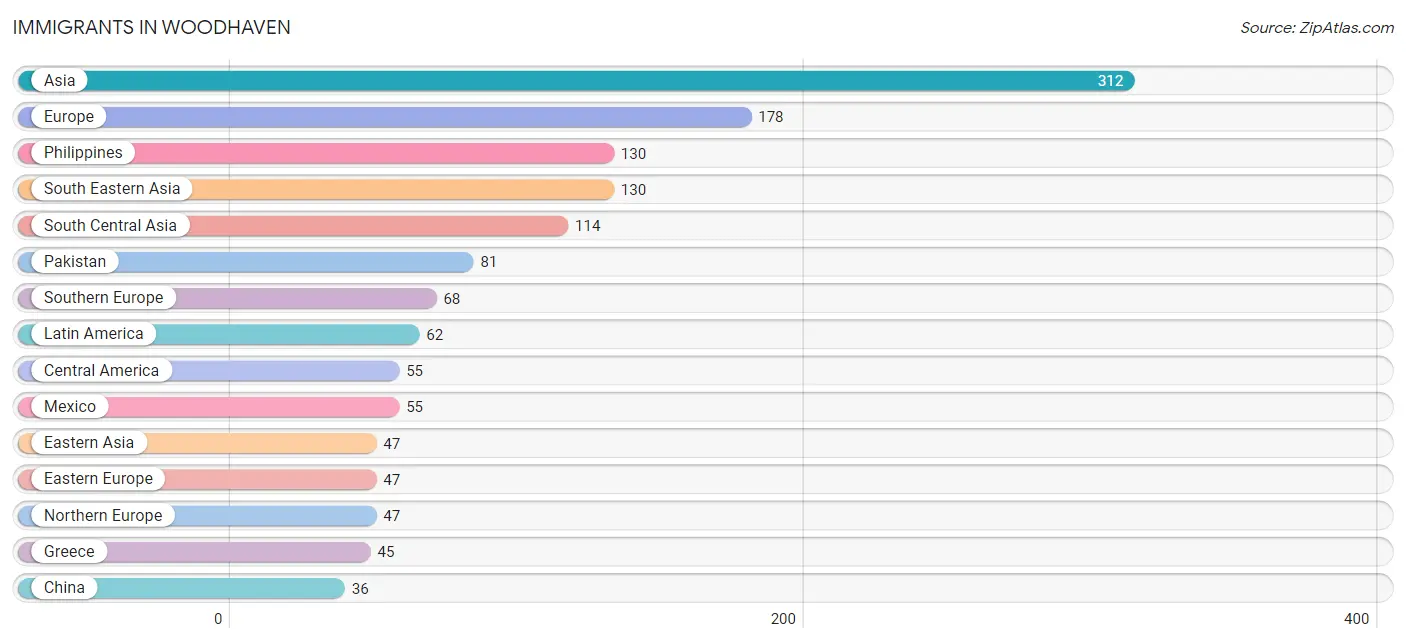
Immigrants in Woodhaven
The most numerous immigrant groups reported in Woodhaven came from Asia (312 | 2.4%), Europe (178 | 1.4%), Philippines (130 | 1.0%), South Eastern Asia (130 | 1.0%), and South Central Asia (114 | 0.9%), together accounting for 6.7% of all Woodhaven residents.
| Immigration Origin | # Population | % Population |
| Albania | 7 | 0.1% |
| Asia | 312 | 2.4% |
| Canada | 24 | 0.2% |
| Central America | 55 | 0.4% |
| China | 36 | 0.3% |
| Eastern Asia | 47 | 0.4% |
| Eastern Europe | 47 | 0.4% |
| Europe | 178 | 1.4% |
| Germany | 8 | 0.1% |
| Greece | 45 | 0.4% |
| Guyana | 7 | 0.1% |
| Hong Kong | 19 | 0.2% |
| Hungary | 5 | 0.0% |
| India | 33 | 0.3% |
| Italy | 11 | 0.1% |
| Japan | 1 | 0.0% |
| Korea | 10 | 0.1% |
| Latin America | 62 | 0.5% |
| Mexico | 55 | 0.4% |
| Netherlands | 8 | 0.1% |
| Northern Europe | 47 | 0.4% |
| Pakistan | 81 | 0.6% |
| Philippines | 130 | 1.0% |
| Poland | 10 | 0.1% |
| Russia | 15 | 0.1% |
| Saudi Arabia | 21 | 0.2% |
| South America | 7 | 0.1% |
| South Central Asia | 114 | 0.9% |
| South Eastern Asia | 130 | 1.0% |
| Southern Europe | 68 | 0.5% |
| Western Asia | 21 | 0.2% |
| Western Europe | 16 | 0.1% | View All 32 Rows |
Sex and Age in Woodhaven
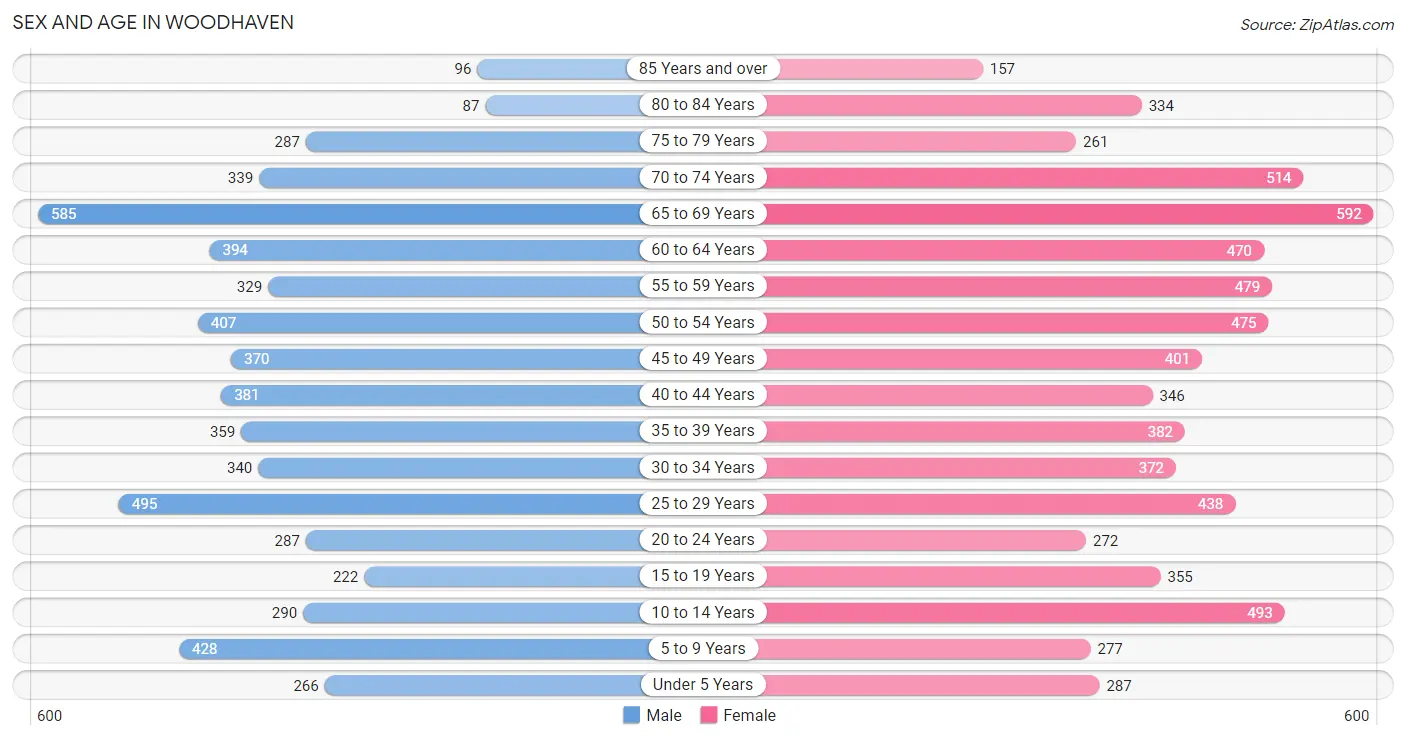
Sex and Age in Woodhaven
The most populous age groups in Woodhaven are 65 to 69 Years (585 | 9.8%) for men and 65 to 69 Years (592 | 8.6%) for women.
| Age Bracket | Male | Female |
| Under 5 Years | 266 (4.5%) | 287 (4.2%) |
| 5 to 9 Years | 428 (7.2%) | 277 (4.0%) |
| 10 to 14 Years | 290 (4.9%) | 493 (7.1%) |
| 15 to 19 Years | 222 (3.7%) | 355 (5.1%) |
| 20 to 24 Years | 287 (4.8%) | 272 (3.9%) |
| 25 to 29 Years | 495 (8.3%) | 438 (6.3%) |
| 30 to 34 Years | 340 (5.7%) | 372 (5.4%) |
| 35 to 39 Years | 359 (6.0%) | 382 (5.5%) |
| 40 to 44 Years | 381 (6.4%) | 346 (5.0%) |
| 45 to 49 Years | 370 (6.2%) | 401 (5.8%) |
| 50 to 54 Years | 407 (6.8%) | 475 (6.9%) |
| 55 to 59 Years | 329 (5.5%) | 479 (6.9%) |
| 60 to 64 Years | 394 (6.6%) | 470 (6.8%) |
| 65 to 69 Years | 585 (9.8%) | 592 (8.6%) |
| 70 to 74 Years | 339 (5.7%) | 514 (7.4%) |
| 75 to 79 Years | 287 (4.8%) | 261 (3.8%) |
| 80 to 84 Years | 87 (1.5%) | 334 (4.8%) |
| 85 Years and over | 96 (1.6%) | 157 (2.3%) |
| Total | 5,962 (100.0%) | 6,905 (100.0%) |
Families and Households in Woodhaven
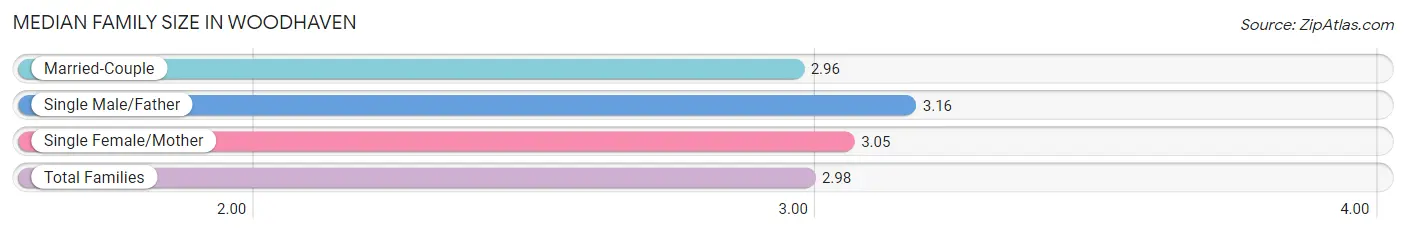
Median Family Size in Woodhaven
The median family size in Woodhaven is 2.98 persons per family, with single male/father families (194 | 5.6%) accounting for the largest median family size of 3.16 persons per family. On the other hand, married-couple families (2,743 | 79.1%) represent the smallest median family size with 2.96 persons per family.
| Family Type | # Families | Family Size |
| Married-Couple | 2,743 (79.1%) | 2.96 |
| Single Male/Father | 194 (5.6%) | 3.16 |
| Single Female/Mother | 529 (15.3%) | 3.05 |
| Total Families | 3,466 (100.0%) | 2.98 |
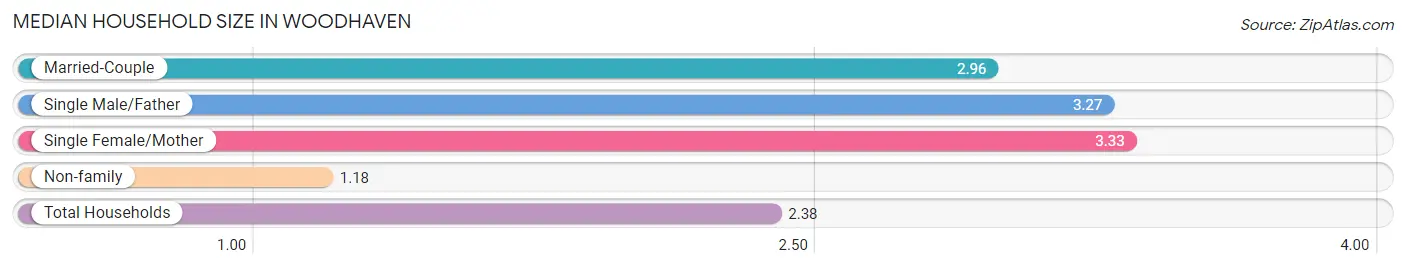
Median Household Size in Woodhaven
The median household size in Woodhaven is 2.38 persons per household, with single female/mother households (529 | 9.9%) accounting for the largest median household size of 3.33 persons per household. non-family households (1,878 | 35.1%) represent the smallest median household size with 1.18 persons per household.
| Household Type | # Households | Household Size |
| Married-Couple | 2,743 (51.3%) | 2.96 |
| Single Male/Father | 194 (3.6%) | 3.27 |
| Single Female/Mother | 529 (9.9%) | 3.33 |
| Non-family | 1,878 (35.1%) | 1.18 |
| Total Households | 5,344 (100.0%) | 2.38 |
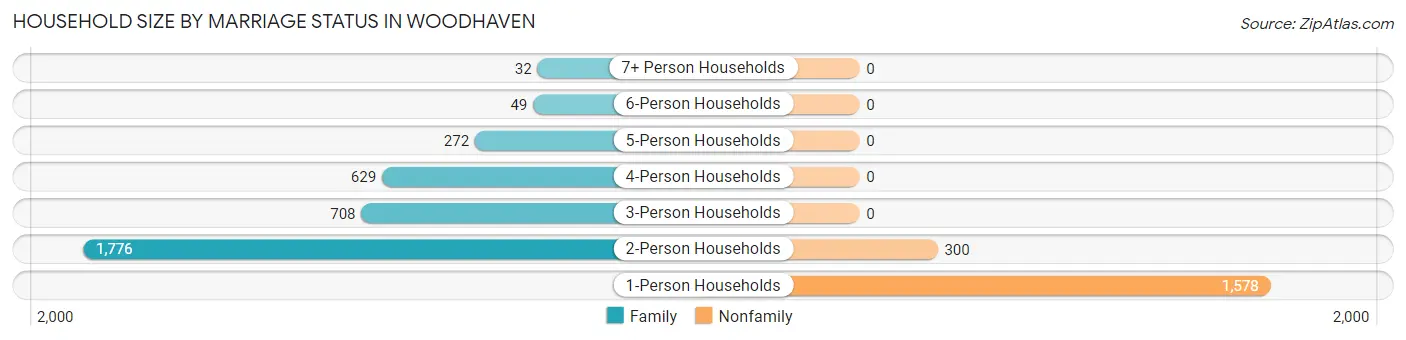
Household Size by Marriage Status in Woodhaven
Out of a total of 5,344 households in Woodhaven, 3,466 (64.9%) are family households, while 1,878 (35.1%) are nonfamily households. The most numerous type of family households are 2-person households, comprising 1,776, and the most common type of nonfamily households are 1-person households, comprising 1,578.
| Household Size | Family Households | Nonfamily Households |
| 1-Person Households | - | 1,578 (29.5%) |
| 2-Person Households | 1,776 (33.2%) | 300 (5.6%) |
| 3-Person Households | 708 (13.3%) | 0 (0.0%) |
| 4-Person Households | 629 (11.8%) | 0 (0.0%) |
| 5-Person Households | 272 (5.1%) | 0 (0.0%) |
| 6-Person Households | 49 (0.9%) | 0 (0.0%) |
| 7+ Person Households | 32 (0.6%) | 0 (0.0%) |
| Total | 3,466 (64.9%) | 1,878 (35.1%) |
Female Fertility in Woodhaven
Fertility by Age in Woodhaven
Average fertility rate in Woodhaven is 48.0 births per 1,000 women. Women in the age bracket of 20 to 34 years have the highest fertility rate with 91.0 births per 1,000 women. Women in the age bracket of 20 to 34 years acount for 77.2% of all women with births.
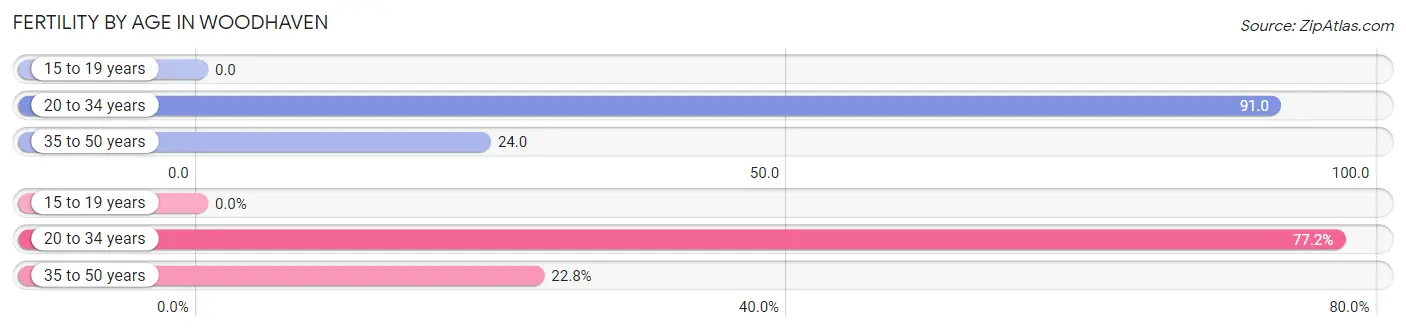
| Age Bracket | Women with Births | Births / 1,000 Women |
| 15 to 19 years | 0 (0.0%) | 0.0 |
| 20 to 34 years | 98 (77.2%) | 91.0 |
| 35 to 50 years | 29 (22.8%) | 24.0 |
| Total | 127 (100.0%) | 48.0 |
Fertility by Age by Marriage Status in Woodhaven
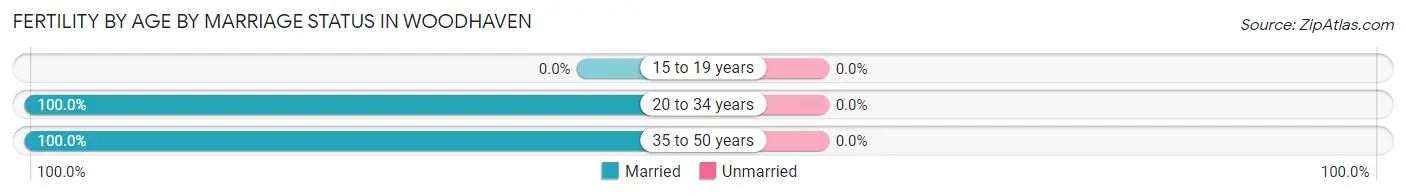
| Age Bracket | Married | Unmarried |
| 15 to 19 years | 0 (0.0%) | 0 (0.0%) |
| 20 to 34 years | 98 (100.0%) | 0 (0.0%) |
| 35 to 50 years | 29 (100.0%) | 0 (0.0%) |
| Total | 127 (100.0%) | 0 (0.0%) |
Fertility by Education in Woodhaven
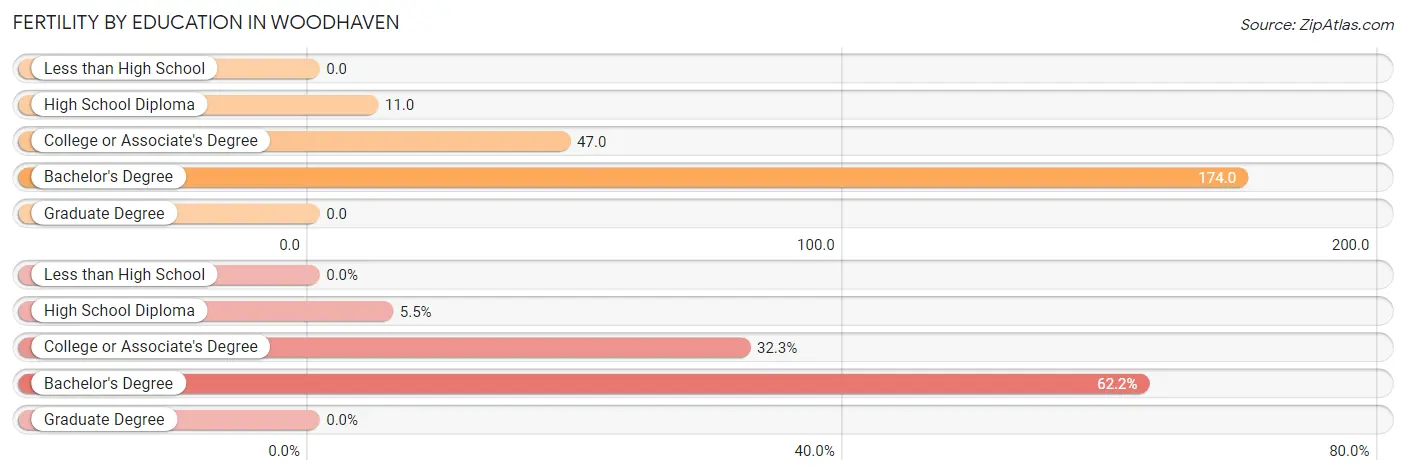
| Educational Attainment | Women with Births | Births / 1,000 Women |
| Less than High School | 0 (0.0%) | 0.0 |
| High School Diploma | 7 (5.5%) | 11.0 |
| College or Associate's Degree | 41 (32.3%) | 47.0 |
| Bachelor's Degree | 79 (62.2%) | 174.0 |
| Graduate Degree | 0 (0.0%) | 0.0 |
| Total | 127 (100.0%) | 48.0 |
Fertility by Education by Marriage Status in Woodhaven
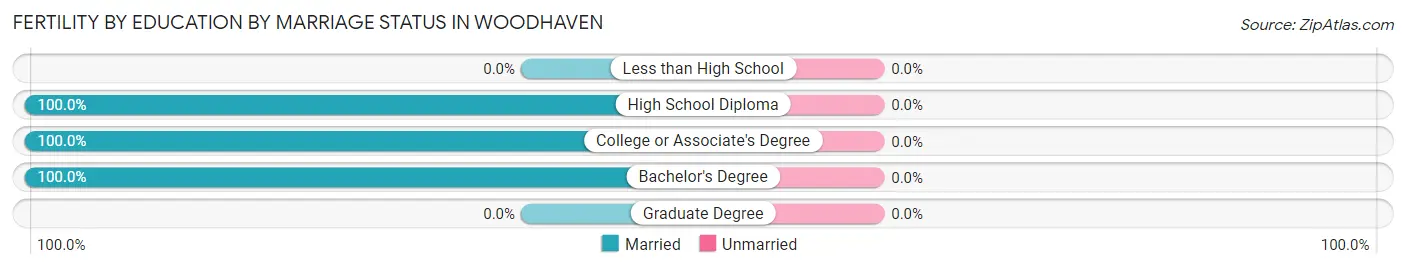
| Educational Attainment | Married | Unmarried |
| Less than High School | 0 (0.0%) | 0 (0.0%) |
| High School Diploma | 7 (100.0%) | 0 (0.0%) |
| College or Associate's Degree | 41 (100.0%) | 0 (0.0%) |
| Bachelor's Degree | 79 (100.0%) | 0 (0.0%) |
| Graduate Degree | 0 (0.0%) | 0 (0.0%) |
| Total | 127 (100.0%) | 0 (0.0%) |
Income in Woodhaven
Income Overview in Woodhaven
Per Capita Income in Woodhaven is $38,013, while median incomes of families and households are $96,667 and $77,725 respectively.
| Characteristic | Number | Measure |
| Per Capita Income | 12,867 | $38,013 |
| Median Family Income | 3,466 | $96,667 |
| Mean Family Income | 3,466 | $105,674 |
| Median Household Income | 5,344 | $77,725 |
| Mean Household Income | 5,344 | $89,529 |
| Income Deficit | 3,466 | $0 |
| Wage / Income Gap (%) | 12,867 | 31.75% |
| Wage / Income Gap ($) | 12,867 | 68.25¢ per $1 |
| Gini / Inequality Index | 12,867 | 0.36 |
Earnings by Sex in Woodhaven
Average Earnings in Woodhaven are $50,620, $58,073 for men and $39,633 for women, a difference of 31.8%.
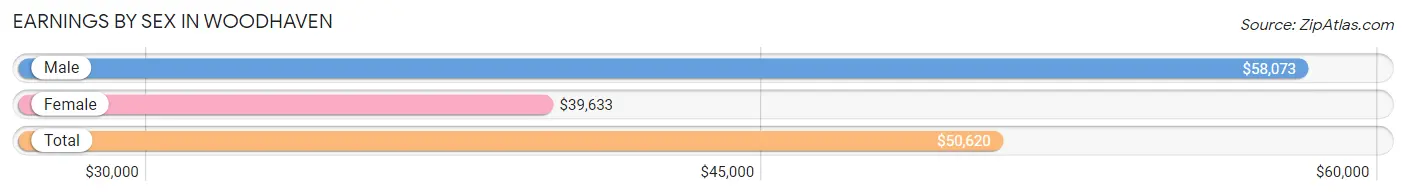
| Sex | Number | Average Earnings |
| Male | 3,374 (52.9%) | $58,073 |
| Female | 2,998 (47.0%) | $39,633 |
| Total | 6,372 (100.0%) | $50,620 |
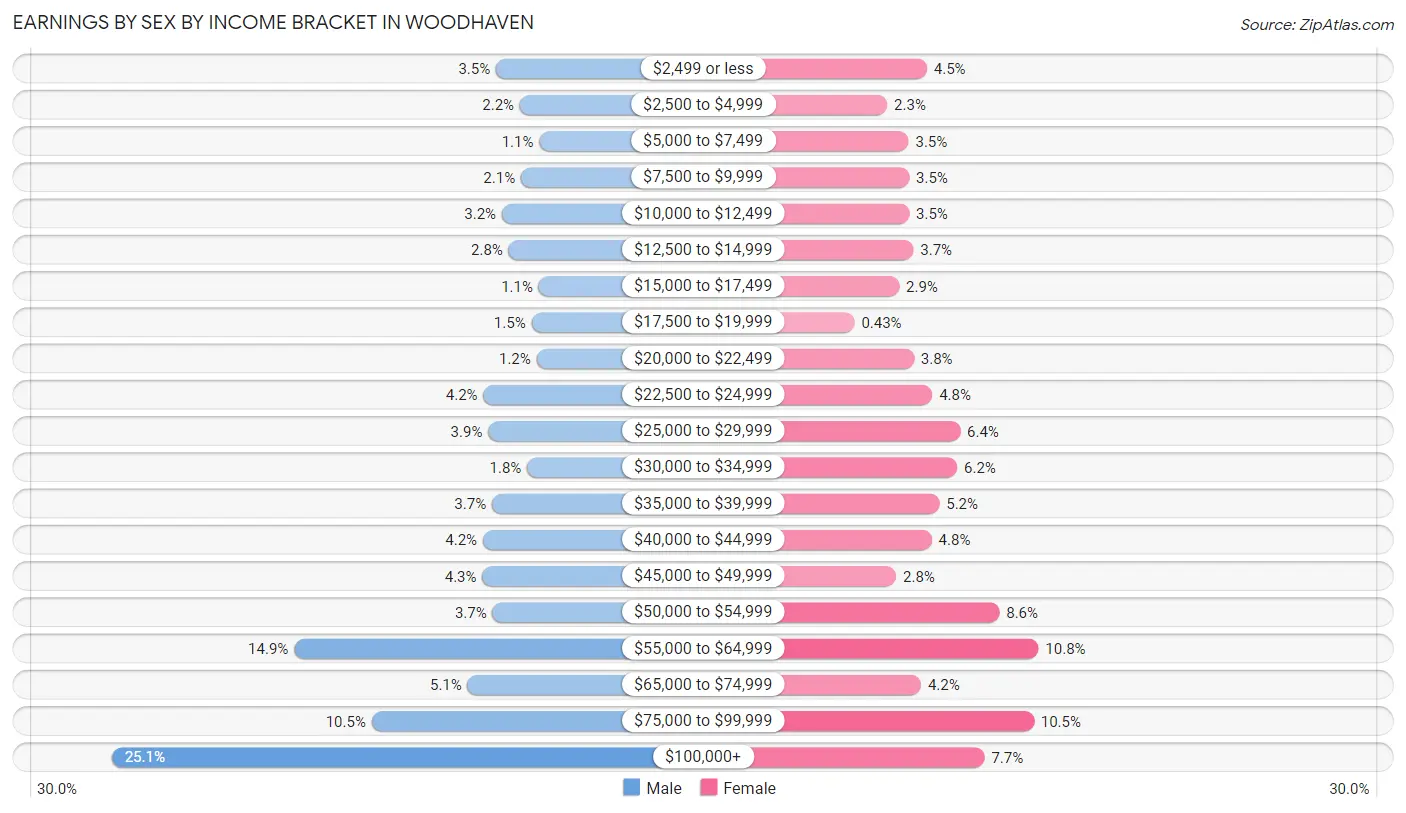
Earnings by Sex by Income Bracket in Woodhaven
The most common earnings brackets in Woodhaven are $100,000+ for men (847 | 25.1%) and $55,000 to $64,999 for women (323 | 10.8%).
| Income | Male | Female |
| $2,499 or less | 118 (3.5%) | 135 (4.5%) |
| $2,500 to $4,999 | 73 (2.2%) | 68 (2.3%) |
| $5,000 to $7,499 | 36 (1.1%) | 104 (3.5%) |
| $7,500 to $9,999 | 71 (2.1%) | 105 (3.5%) |
| $10,000 to $12,499 | 107 (3.2%) | 105 (3.5%) |
| $12,500 to $14,999 | 94 (2.8%) | 112 (3.7%) |
| $15,000 to $17,499 | 37 (1.1%) | 88 (2.9%) |
| $17,500 to $19,999 | 51 (1.5%) | 13 (0.4%) |
| $20,000 to $22,499 | 41 (1.2%) | 113 (3.8%) |
| $22,500 to $24,999 | 142 (4.2%) | 144 (4.8%) |
| $25,000 to $29,999 | 133 (3.9%) | 191 (6.4%) |
| $30,000 to $34,999 | 59 (1.8%) | 186 (6.2%) |
| $35,000 to $39,999 | 126 (3.7%) | 156 (5.2%) |
| $40,000 to $44,999 | 143 (4.2%) | 143 (4.8%) |
| $45,000 to $49,999 | 144 (4.3%) | 83 (2.8%) |
| $50,000 to $54,999 | 125 (3.7%) | 257 (8.6%) |
| $55,000 to $64,999 | 501 (14.8%) | 323 (10.8%) |
| $65,000 to $74,999 | 172 (5.1%) | 125 (4.2%) |
| $75,000 to $99,999 | 354 (10.5%) | 315 (10.5%) |
| $100,000+ | 847 (25.1%) | 232 (7.7%) |
| Total | 3,374 (100.0%) | 2,998 (100.0%) |
Earnings by Sex by Educational Attainment in Woodhaven
Average earnings in Woodhaven are $62,148 for men and $45,556 for women, a difference of 26.7%. Men with an educational attainment of graduate degree enjoy the highest average annual earnings of $109,135, while those with less than high school education earn the least with $24,856. Women with an educational attainment of graduate degree earn the most with the average annual earnings of $56,042, while those with high school diploma education have the smallest earnings of $29,328.
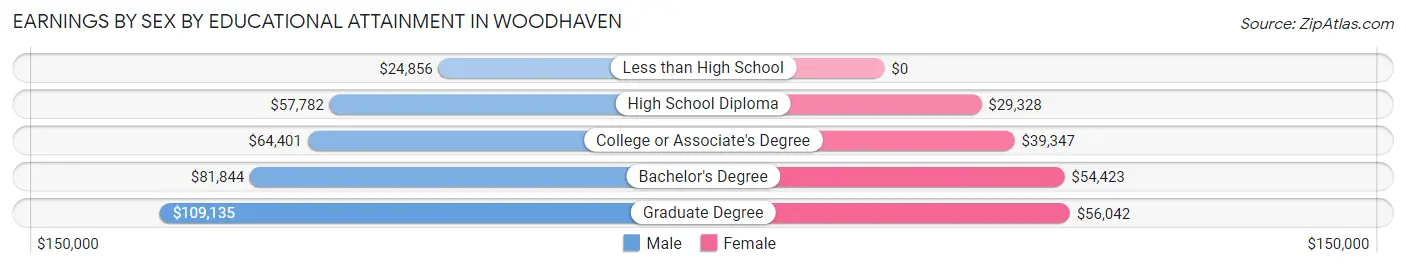
| Educational Attainment | Male Income | Female Income |
| Less than High School | $24,856 | $0 |
| High School Diploma | $57,782 | $29,328 |
| College or Associate's Degree | $64,401 | $39,347 |
| Bachelor's Degree | $81,844 | $54,423 |
| Graduate Degree | $109,135 | $56,042 |
| Total | $62,148 | $45,556 |
Family Income in Woodhaven
Family Income Brackets in Woodhaven
According to the Woodhaven family income data, there are 905 families falling into the $100,000 to $149,999 income range, which is the most common income bracket and makes up 26.1% of all families. Conversely, the $10,000 to $14,999 income bracket is the least frequent group with only 42 families (1.2%) belonging to this category.
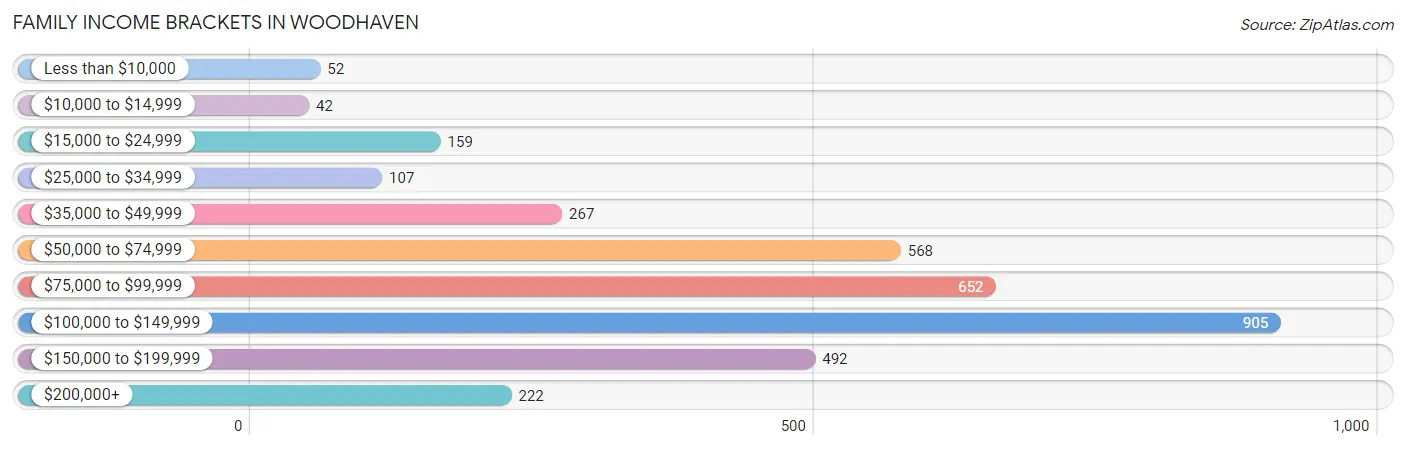
| Income Bracket | # Families | % Families |
| Less than $10,000 | 52 | 1.5% |
| $10,000 to $14,999 | 42 | 1.2% |
| $15,000 to $24,999 | 159 | 4.6% |
| $25,000 to $34,999 | 107 | 3.1% |
| $35,000 to $49,999 | 267 | 7.7% |
| $50,000 to $74,999 | 568 | 16.4% |
| $75,000 to $99,999 | 652 | 18.8% |
| $100,000 to $149,999 | 905 | 26.1% |
| $150,000 to $199,999 | 492 | 14.2% |
| $200,000+ | 222 | 6.4% |
Family Income by Famaliy Size in Woodhaven
4-person families (591 | 17.1%) account for the highest median family income in Woodhaven with $129,236 per family, while 2-person families (1,797 | 51.8%) have the highest median income of $41,214 per family member.
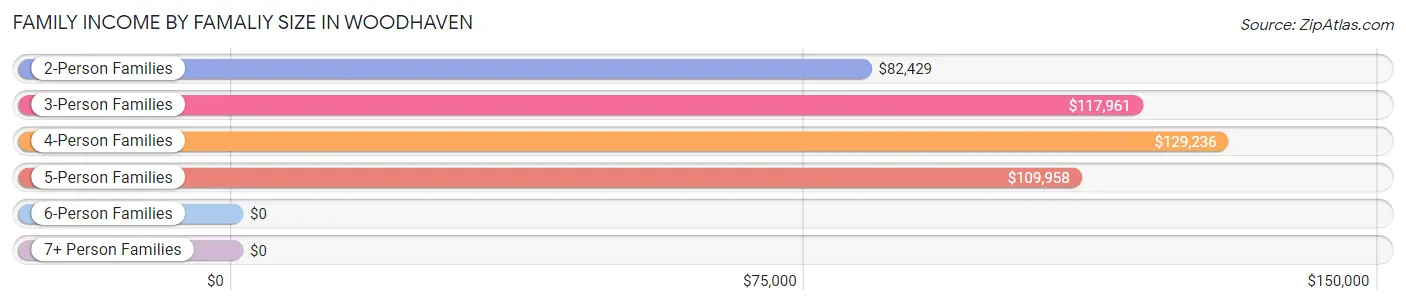
| Income Bracket | # Families | Median Income |
| 2-Person Families | 1,797 (51.8%) | $82,429 |
| 3-Person Families | 725 (20.9%) | $117,961 |
| 4-Person Families | 591 (17.1%) | $129,236 |
| 5-Person Families | 281 (8.1%) | $109,958 |
| 6-Person Families | 51 (1.5%) | $0 |
| 7+ Person Families | 21 (0.6%) | $0 |
| Total | 3,466 (100.0%) | $96,667 |
Family Income by Number of Earners in Woodhaven
The median family income in Woodhaven is $96,667, with families comprising 3+ earners (436) having the highest median family income of $167,667, while families with no earners (806) have the lowest median family income of $65,962, accounting for 12.6% and 23.3% of families, respectively.
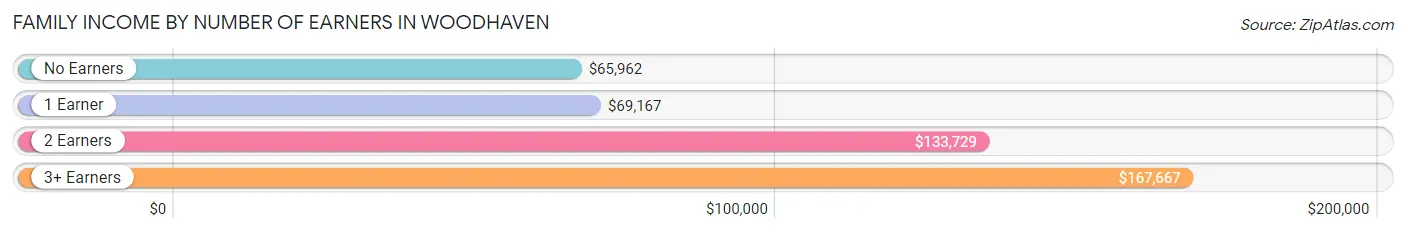
| Number of Earners | # Families | Median Income |
| No Earners | 806 (23.3%) | $65,962 |
| 1 Earner | 1,120 (32.3%) | $69,167 |
| 2 Earners | 1,104 (31.9%) | $133,729 |
| 3+ Earners | 436 (12.6%) | $167,667 |
| Total | 3,466 (100.0%) | $96,667 |
Household Income in Woodhaven
Household Income Brackets in Woodhaven
With 1,192 households falling in the category, the $100,000 to $149,999 income range is the most frequent in Woodhaven, accounting for 22.3% of all households. In contrast, only 48 households (0.9%) fall into the $10,000 to $14,999 income bracket, making it the least populous group.
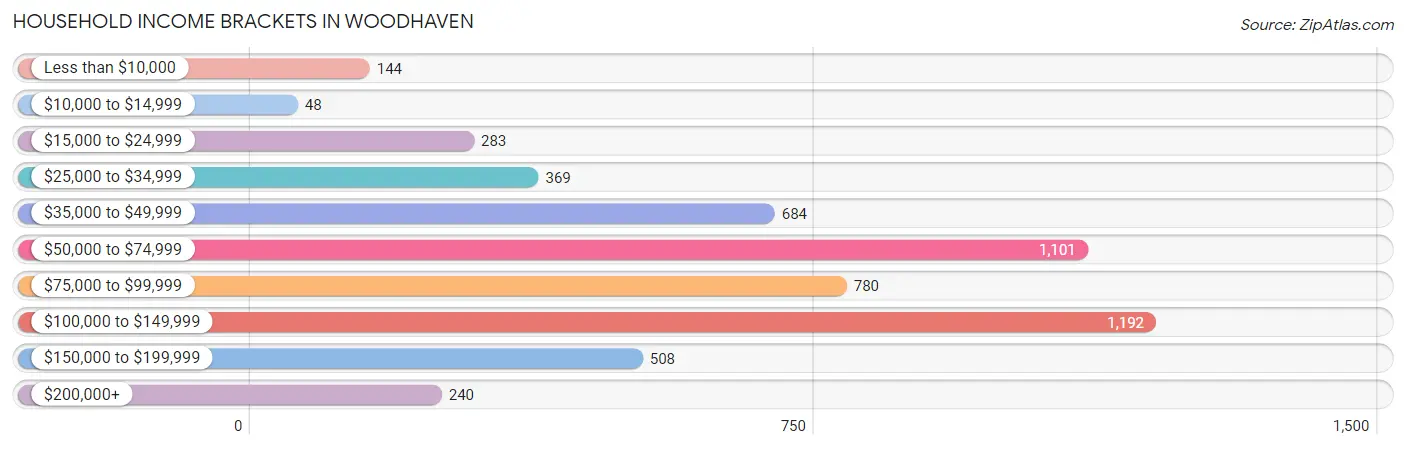
| Income Bracket | # Households | % Households |
| Less than $10,000 | 144 | 2.7% |
| $10,000 to $14,999 | 48 | 0.9% |
| $15,000 to $24,999 | 283 | 5.3% |
| $25,000 to $34,999 | 369 | 6.9% |
| $35,000 to $49,999 | 684 | 12.8% |
| $50,000 to $74,999 | 1,101 | 20.6% |
| $75,000 to $99,999 | 780 | 14.6% |
| $100,000 to $149,999 | 1,192 | 22.3% |
| $150,000 to $199,999 | 508 | 9.5% |
| $200,000+ | 240 | 4.5% |
Household Income by Householder Age in Woodhaven
The median household income in Woodhaven is $77,725, with the highest median household income of $108,685 found in the 45 to 64 years age bracket for the primary householder. A total of 1,753 households (32.8%) fall into this category. Meanwhile, the 15 to 24 years age bracket for the primary householder has the lowest median household income of $26,923, with 60 households (1.1%) in this group.
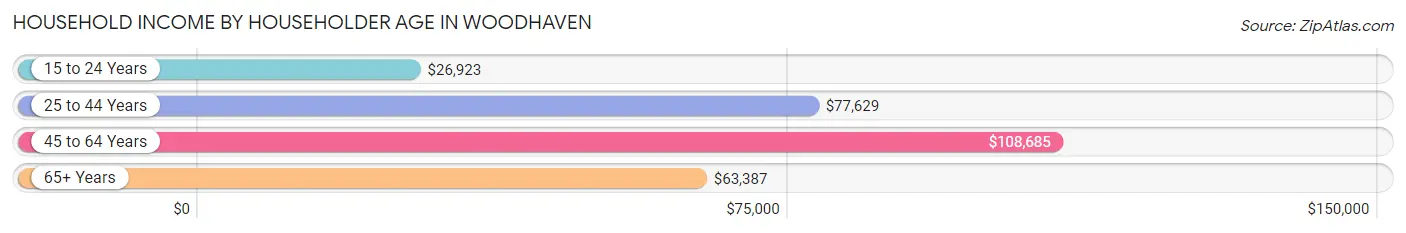
| Income Bracket | # Households | Median Income |
| 15 to 24 Years | 60 (1.1%) | $26,923 |
| 25 to 44 Years | 1,593 (29.8%) | $77,629 |
| 45 to 64 Years | 1,753 (32.8%) | $108,685 |
| 65+ Years | 1,938 (36.3%) | $63,387 |
| Total | 5,344 (100.0%) | $77,725 |
Poverty in Woodhaven
Income Below Poverty by Sex and Age in Woodhaven
With 10.5% poverty level for males and 10.4% for females among the residents of Woodhaven, 6 to 11 year old males and 5 year old females are the most vulnerable to poverty, with 132 males (32.9%) and 47 females (61.8%) in their respective age groups living below the poverty level.
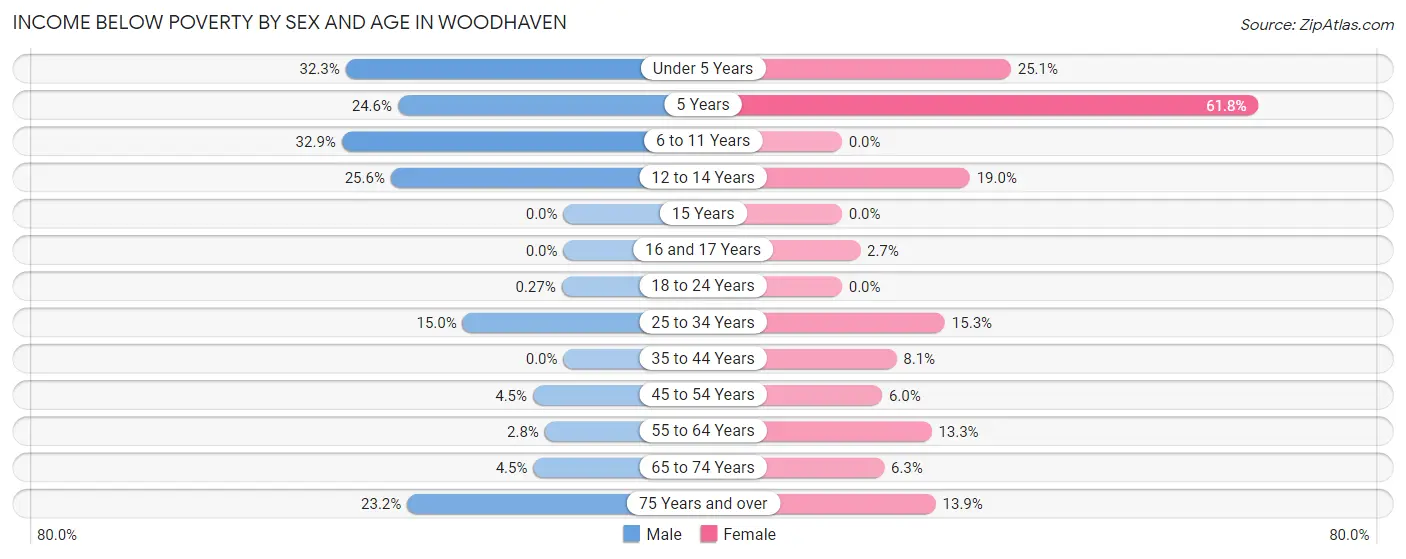
| Age Bracket | Male | Female |
| Under 5 Years | 86 (32.3%) | 72 (25.1%) |
| 5 Years | 29 (24.6%) | 47 (61.8%) |
| 6 to 11 Years | 132 (32.9%) | 0 (0.0%) |
| 12 to 14 Years | 51 (25.6%) | 61 (19.0%) |
| 15 Years | 0 (0.0%) | 0 (0.0%) |
| 16 and 17 Years | 0 (0.0%) | 6 (2.7%) |
| 18 to 24 Years | 1 (0.3%) | 0 (0.0%) |
| 25 to 34 Years | 125 (15.0%) | 124 (15.3%) |
| 35 to 44 Years | 0 (0.0%) | 59 (8.1%) |
| 45 to 54 Years | 35 (4.5%) | 52 (6.0%) |
| 55 to 64 Years | 20 (2.8%) | 125 (13.3%) |
| 65 to 74 Years | 41 (4.5%) | 68 (6.3%) |
| 75 Years and over | 103 (23.2%) | 96 (13.9%) |
| Total | 623 (10.5%) | 710 (10.4%) |
Income Above Poverty by Sex and Age in Woodhaven
According to the poverty statistics in Woodhaven, males aged 15 years and females aged 6 to 11 years are the age groups that are most secure financially, with 100.0% of males and 100.0% of females in these age groups living above the poverty line.
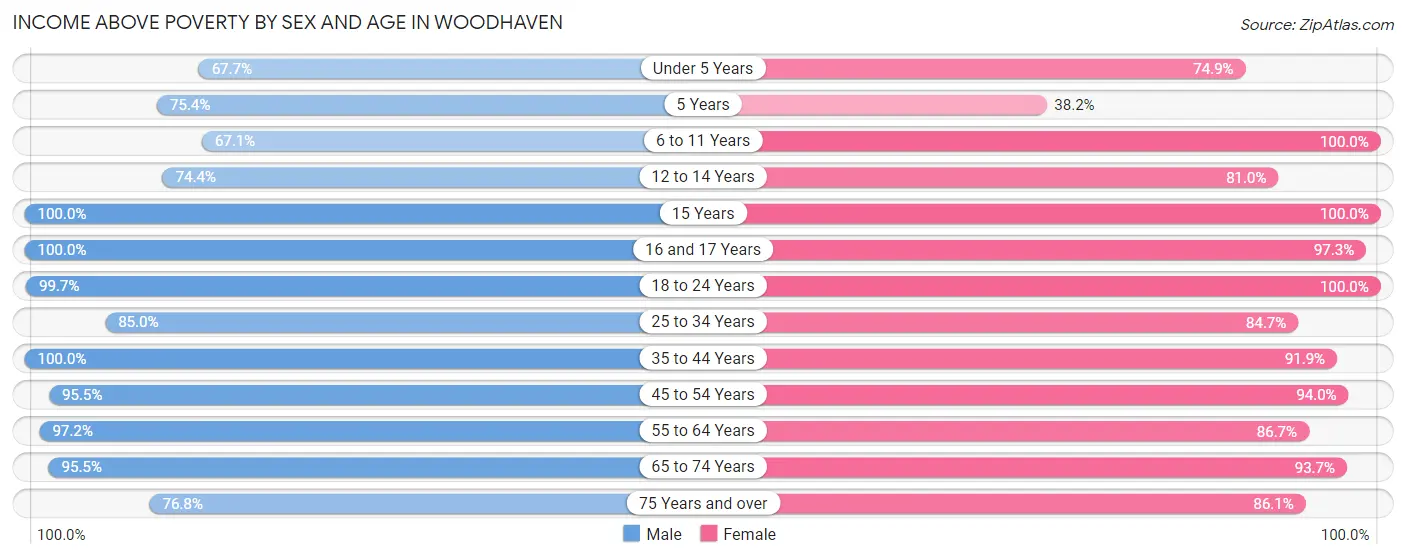
| Age Bracket | Male | Female |
| Under 5 Years | 180 (67.7%) | 215 (74.9%) |
| 5 Years | 89 (75.4%) | 29 (38.2%) |
| 6 to 11 Years | 269 (67.1%) | 373 (100.0%) |
| 12 to 14 Years | 148 (74.4%) | 260 (81.0%) |
| 15 Years | 68 (100.0%) | 46 (100.0%) |
| 16 and 17 Years | 69 (100.0%) | 215 (97.3%) |
| 18 to 24 Years | 371 (99.7%) | 360 (100.0%) |
| 25 to 34 Years | 710 (85.0%) | 686 (84.7%) |
| 35 to 44 Years | 740 (100.0%) | 669 (91.9%) |
| 45 to 54 Years | 737 (95.5%) | 820 (94.0%) |
| 55 to 64 Years | 703 (97.2%) | 814 (86.7%) |
| 65 to 74 Years | 879 (95.5%) | 1,016 (93.7%) |
| 75 Years and over | 341 (76.8%) | 593 (86.1%) |
| Total | 5,304 (89.5%) | 6,096 (89.6%) |
Income Below Poverty Among Married-Couple Families in Woodhaven
The poverty statistics for married-couple families in Woodhaven show that 3.1% or 86 of the total 2,743 families live below the poverty line. Families with 3 or 4 children have the highest poverty rate of 17.2%, comprising of 25 families. On the other hand, families with no children have the lowest poverty rate of 1.9%, which includes 36 families.
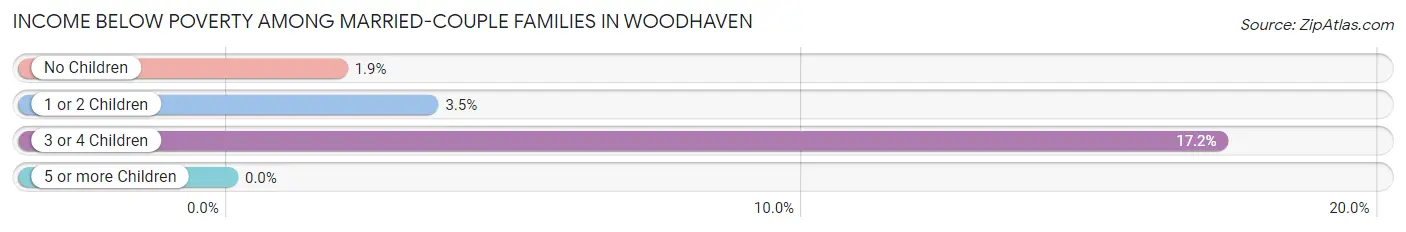
| Children | Above Poverty | Below Poverty |
| No Children | 1,846 (98.1%) | 36 (1.9%) |
| 1 or 2 Children | 691 (96.5%) | 25 (3.5%) |
| 3 or 4 Children | 120 (82.8%) | 25 (17.2%) |
| 5 or more Children | 0 (0.0%) | 0 (0.0%) |
| Total | 2,657 (96.9%) | 86 (3.1%) |
Income Below Poverty Among Single-Parent Households in Woodhaven
According to the poverty data in Woodhaven, 27.8% or 54 single-father households and 20.8% or 110 single-mother households are living below the poverty line. Among single-father households, those with 3 or 4 children have the highest poverty rate, with 41 households (100.0%) experiencing poverty. Likewise, among single-mother households, those with 3 or 4 children have the highest poverty rate, with 32 households (62.7%) falling below the poverty line.
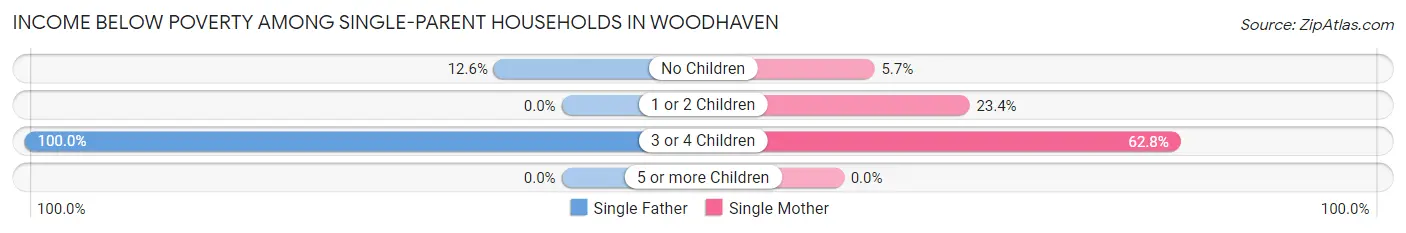
| Children | Single Father | Single Mother |
| No Children | 13 (12.6%) | 11 (5.7%) |
| 1 or 2 Children | 0 (0.0%) | 67 (23.4%) |
| 3 or 4 Children | 41 (100.0%) | 32 (62.7%) |
| 5 or more Children | 0 (0.0%) | 0 (0.0%) |
| Total | 54 (27.8%) | 110 (20.8%) |
Income Below Poverty Among Married-Couple vs Single-Parent Households in Woodhaven
The poverty data for Woodhaven shows that 86 of the married-couple family households (3.1%) and 164 of the single-parent households (22.7%) are living below the poverty level. Within the married-couple family households, those with 3 or 4 children have the highest poverty rate, with 25 households (17.2%) falling below the poverty line. Among the single-parent households, those with 3 or 4 children have the highest poverty rate, with 73 household (79.3%) living below poverty.
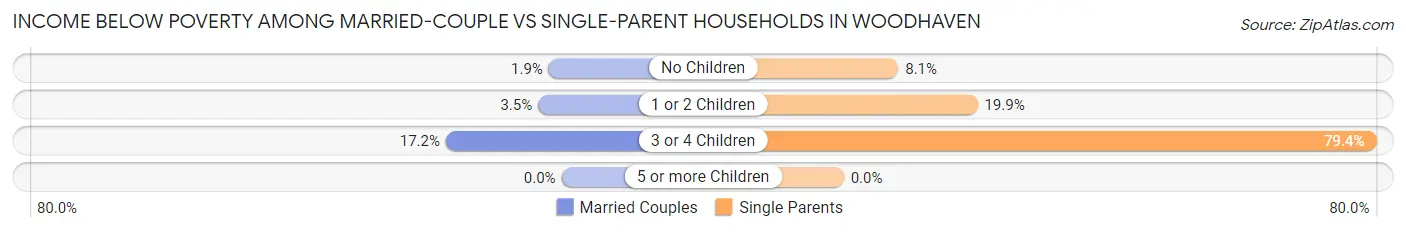
| Children | Married-Couple Families | Single-Parent Households |
| No Children | 36 (1.9%) | 24 (8.1%) |
| 1 or 2 Children | 25 (3.5%) | 67 (19.9%) |
| 3 or 4 Children | 25 (17.2%) | 73 (79.3%) |
| 5 or more Children | 0 (0.0%) | 0 (0.0%) |
| Total | 86 (3.1%) | 164 (22.7%) |
Employment Characteristics in Woodhaven
Employment by Class of Employer in Woodhaven
Among the 5,828 employed individuals in Woodhaven, private company employees (4,377 | 75.1%), local government employees (509 | 8.7%), and not-for-profit organizations (462 | 7.9%) make up the most common classes of employment.
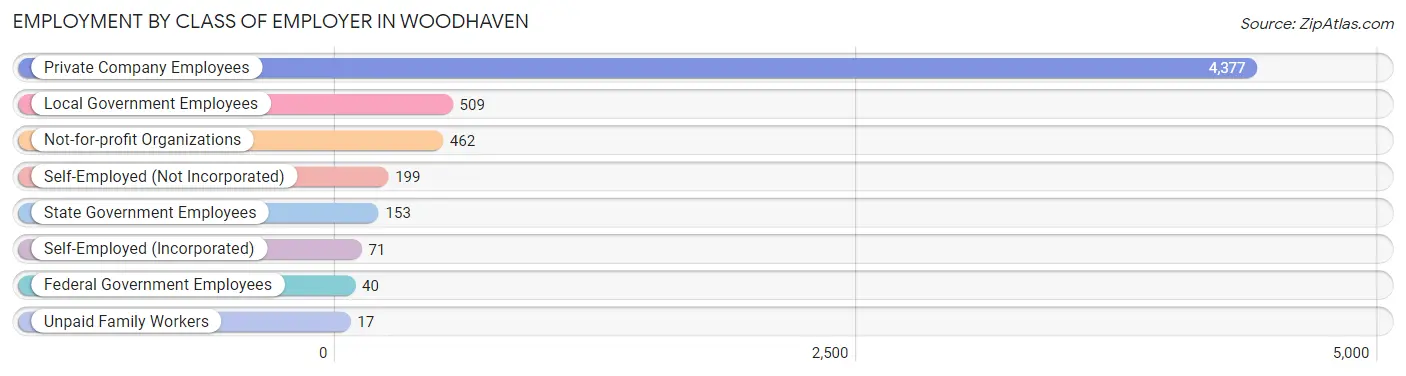
| Employer Class | # Employees | % Employees |
| Private Company Employees | 4,377 | 75.1% |
| Self-Employed (Incorporated) | 71 | 1.2% |
| Self-Employed (Not Incorporated) | 199 | 3.4% |
| Not-for-profit Organizations | 462 | 7.9% |
| Local Government Employees | 509 | 8.7% |
| State Government Employees | 153 | 2.6% |
| Federal Government Employees | 40 | 0.7% |
| Unpaid Family Workers | 17 | 0.3% |
| Total | 5,828 | 100.0% |
Employment Status by Age in Woodhaven
According to the labor force statistics for Woodhaven, out of the total population over 16 years of age (10,712), 57.8% or 6,192 individuals are in the labor force, with 5.0% or 310 of them unemployed. The age group with the highest labor force participation rate is 20 to 24 years, with 97.1% or 543 individuals in the labor force. Within the labor force, the 16 to 19 years age range has the highest percentage of unemployed individuals, with 21.4% or 28 of them being unemployed.
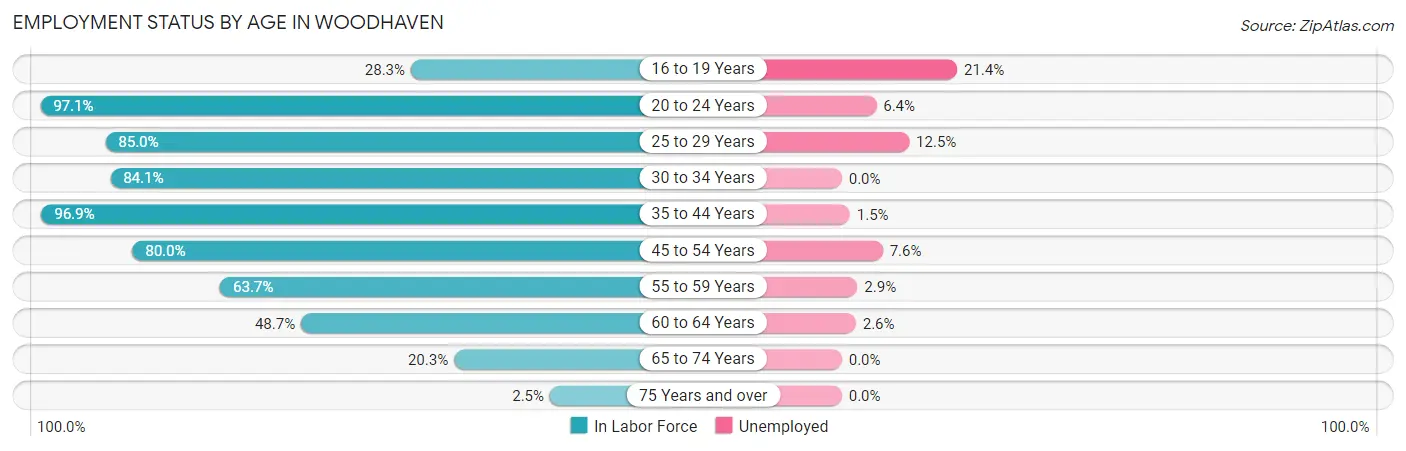
| Age Bracket | In Labor Force | Unemployed |
| 16 to 19 Years | 131 (28.3%) | 28 (21.4%) |
| 20 to 24 Years | 543 (97.1%) | 35 (6.4%) |
| 25 to 29 Years | 793 (85.0%) | 99 (12.5%) |
| 30 to 34 Years | 599 (84.1%) | 0 (0.0%) |
| 35 to 44 Years | 1,422 (96.9%) | 21 (1.5%) |
| 45 to 54 Years | 1,322 (80.0%) | 100 (7.6%) |
| 55 to 59 Years | 515 (63.7%) | 15 (2.9%) |
| 60 to 64 Years | 421 (48.7%) | 11 (2.6%) |
| 65 to 74 Years | 412 (20.3%) | 0 (0.0%) |
| 75 Years and over | 31 (2.5%) | 0 (0.0%) |
| Total | 6,192 (57.8%) | 310 (5.0%) |
Employment Status by Educational Attainment in Woodhaven
According to labor force statistics for Woodhaven, 78.8% of individuals (5,073) out of the total population between 25 and 64 years of age (6,438) are in the labor force, with 4.9% or 249 of them being unemployed. The group with the highest labor force participation rate are those with the educational attainment of bachelor's degree or higher, with 86.6% or 1,598 individuals in the labor force. Within the labor force, individuals with high school diploma education have the highest percentage of unemployment, with 7.6% or 128 of them being unemployed.
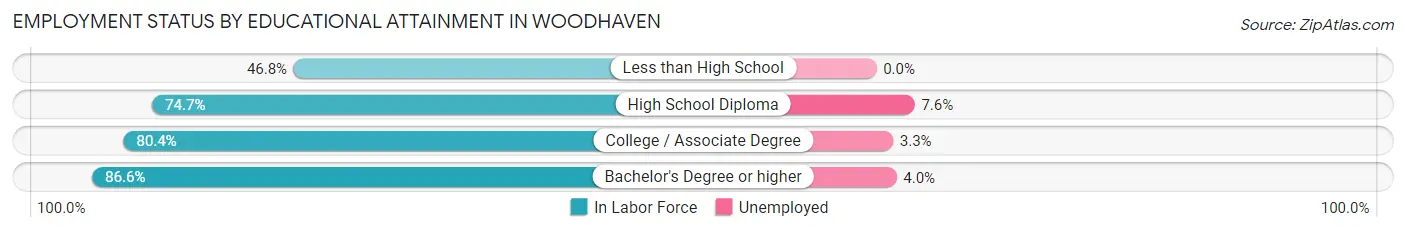
| Educational Attainment | In Labor Force | Unemployed |
| Less than High School | 123 (46.8%) | 0 (0.0%) |
| High School Diploma | 1,687 (74.7%) | 172 (7.6%) |
| College / Associate Degree | 1,665 (80.4%) | 68 (3.3%) |
| Bachelor's Degree or higher | 1,598 (86.6%) | 74 (4.0%) |
| Total | 5,073 (78.8%) | 315 (4.9%) |
Employment Occupations by Sex in Woodhaven
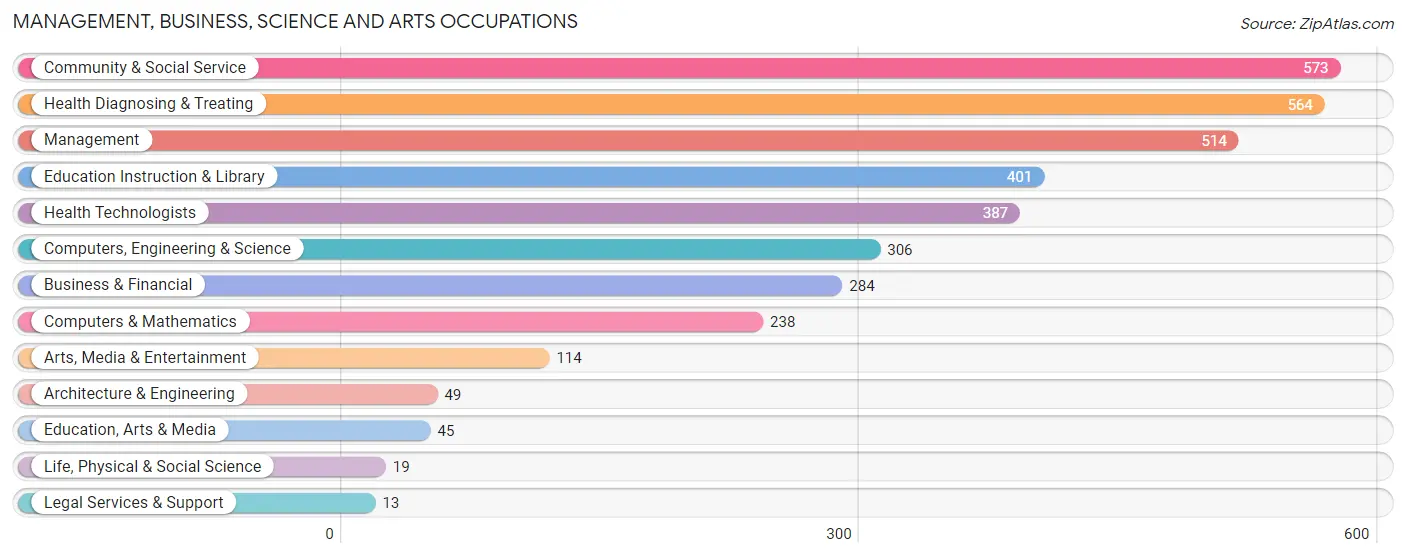
Management, Business, Science and Arts Occupations
The most common Management, Business, Science and Arts occupations in Woodhaven are Community & Social Service (573 | 9.8%), Health Diagnosing & Treating (564 | 9.6%), Management (514 | 8.7%), Education Instruction & Library (401 | 6.8%), and Health Technologists (387 | 6.6%).
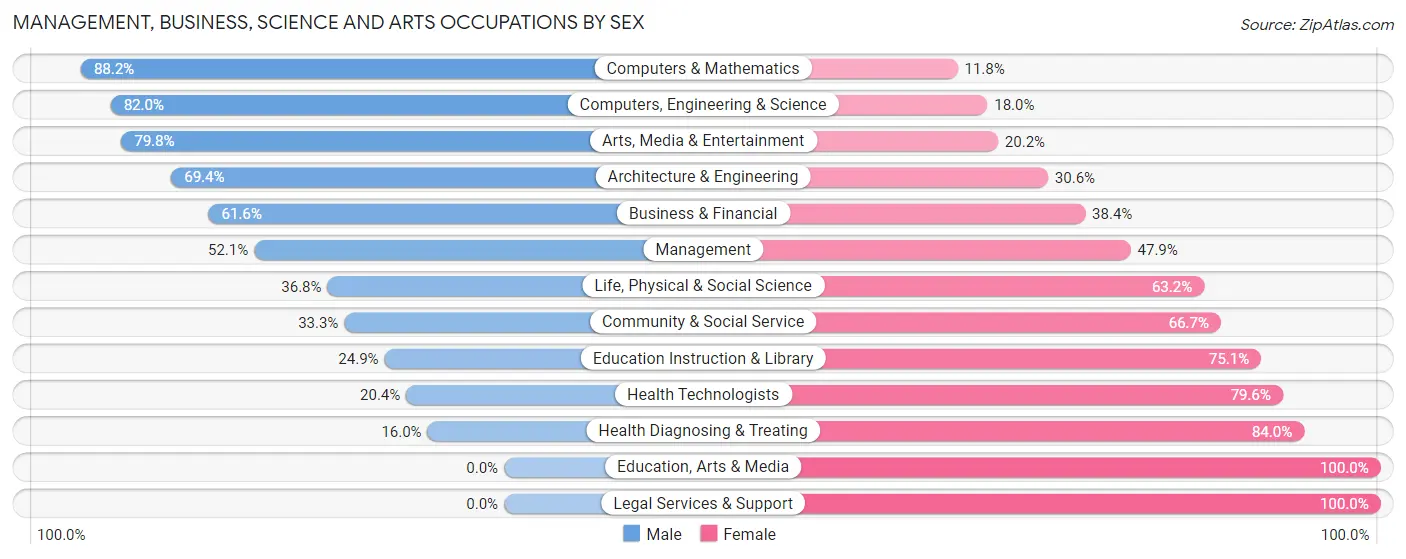
Management, Business, Science and Arts Occupations by Sex
Within the Management, Business, Science and Arts occupations in Woodhaven, the most male-oriented occupations are Computers & Mathematics (88.2%), Computers, Engineering & Science (82.0%), and Arts, Media & Entertainment (79.8%), while the most female-oriented occupations are Education, Arts & Media (100.0%), Legal Services & Support (100.0%), and Health Diagnosing & Treating (84.0%).
| Occupation | Male | Female |
| Management | 268 (52.1%) | 246 (47.9%) |
| Business & Financial | 175 (61.6%) | 109 (38.4%) |
| Computers, Engineering & Science | 251 (82.0%) | 55 (18.0%) |
| Computers & Mathematics | 210 (88.2%) | 28 (11.8%) |
| Architecture & Engineering | 34 (69.4%) | 15 (30.6%) |
| Life, Physical & Social Science | 7 (36.8%) | 12 (63.2%) |
| Community & Social Service | 191 (33.3%) | 382 (66.7%) |
| Education, Arts & Media | 0 (0.0%) | 45 (100.0%) |
| Legal Services & Support | 0 (0.0%) | 13 (100.0%) |
| Education Instruction & Library | 100 (24.9%) | 301 (75.1%) |
| Arts, Media & Entertainment | 91 (79.8%) | 23 (20.2%) |
| Health Diagnosing & Treating | 90 (16.0%) | 474 (84.0%) |
| Health Technologists | 79 (20.4%) | 308 (79.6%) |
| Total (Category) | 975 (43.5%) | 1,266 (56.5%) |
| Total (Overall) | 3,121 (53.1%) | 2,751 (46.9%) |
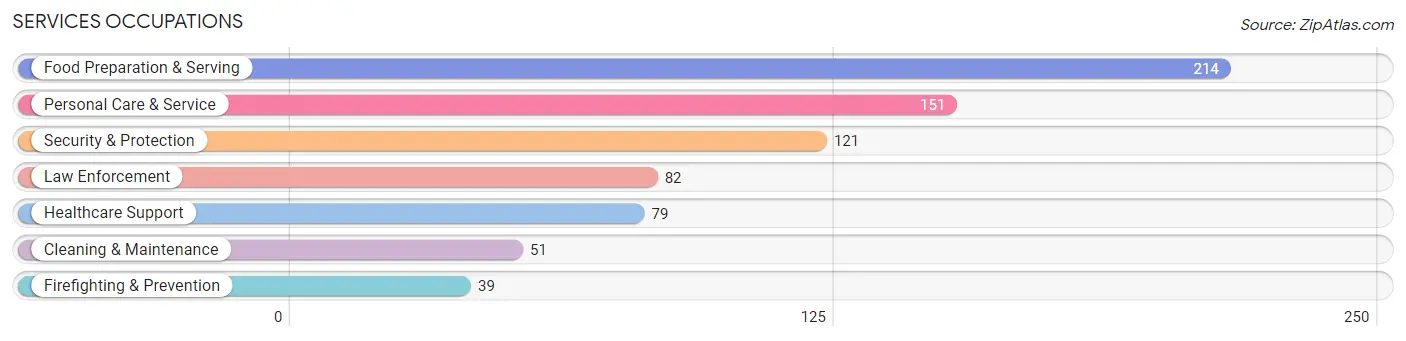
Services Occupations
The most common Services occupations in Woodhaven are Food Preparation & Serving (214 | 3.6%), Personal Care & Service (151 | 2.6%), Security & Protection (121 | 2.1%), Law Enforcement (82 | 1.4%), and Healthcare Support (79 | 1.3%).
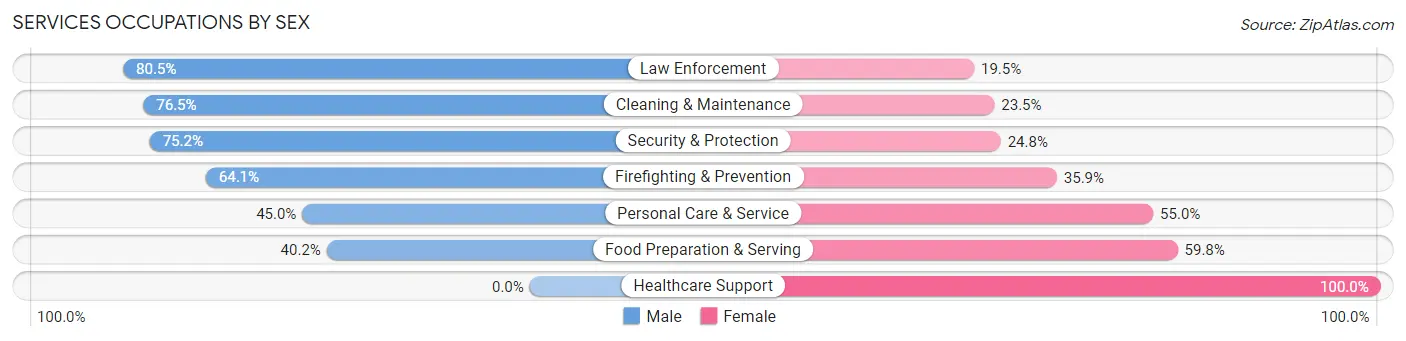
Services Occupations by Sex
Within the Services occupations in Woodhaven, the most male-oriented occupations are Law Enforcement (80.5%), Cleaning & Maintenance (76.5%), and Security & Protection (75.2%), while the most female-oriented occupations are Healthcare Support (100.0%), Food Preparation & Serving (59.8%), and Personal Care & Service (55.0%).
| Occupation | Male | Female |
| Healthcare Support | 0 (0.0%) | 79 (100.0%) |
| Security & Protection | 91 (75.2%) | 30 (24.8%) |
| Firefighting & Prevention | 25 (64.1%) | 14 (35.9%) |
| Law Enforcement | 66 (80.5%) | 16 (19.5%) |
| Food Preparation & Serving | 86 (40.2%) | 128 (59.8%) |
| Cleaning & Maintenance | 39 (76.5%) | 12 (23.5%) |
| Personal Care & Service | 68 (45.0%) | 83 (55.0%) |
| Total (Category) | 284 (46.1%) | 332 (53.9%) |
| Total (Overall) | 3,121 (53.1%) | 2,751 (46.9%) |
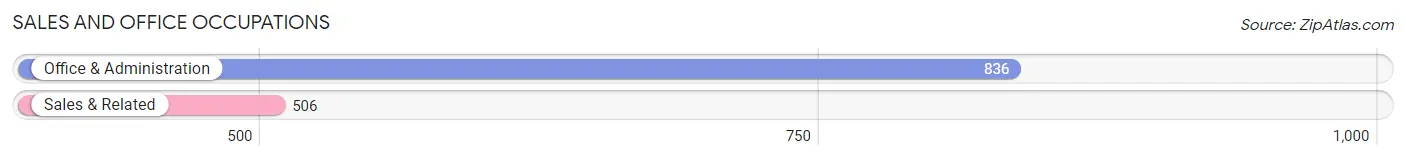
Sales and Office Occupations
The most common Sales and Office occupations in Woodhaven are Office & Administration (836 | 14.2%), and Sales & Related (506 | 8.6%).
Sales and Office Occupations by Sex
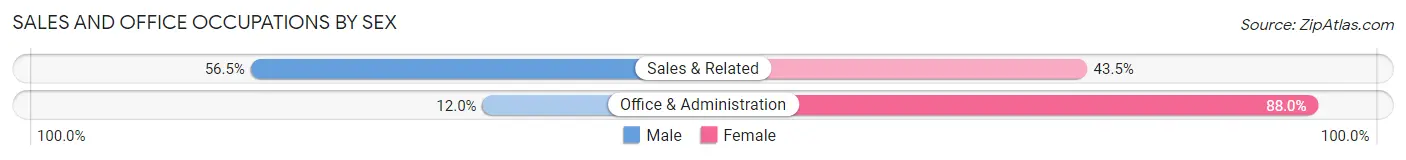
| Occupation | Male | Female |
| Sales & Related | 286 (56.5%) | 220 (43.5%) |
| Office & Administration | 100 (12.0%) | 736 (88.0%) |
| Total (Category) | 386 (28.8%) | 956 (71.2%) |
| Total (Overall) | 3,121 (53.1%) | 2,751 (46.9%) |
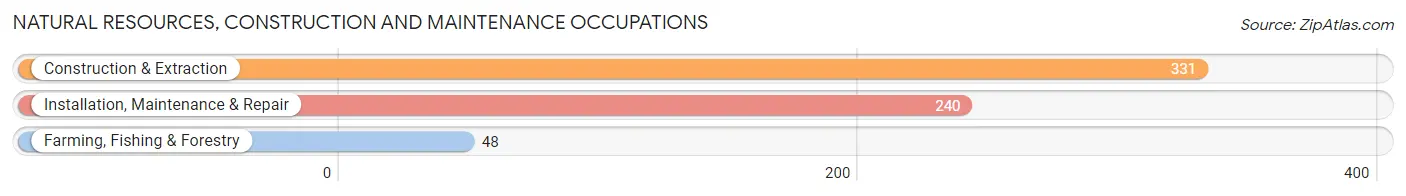
Natural Resources, Construction and Maintenance Occupations
The most common Natural Resources, Construction and Maintenance occupations in Woodhaven are Construction & Extraction (331 | 5.6%), Installation, Maintenance & Repair (240 | 4.1%), and Farming, Fishing & Forestry (48 | 0.8%).
Natural Resources, Construction and Maintenance Occupations by Sex
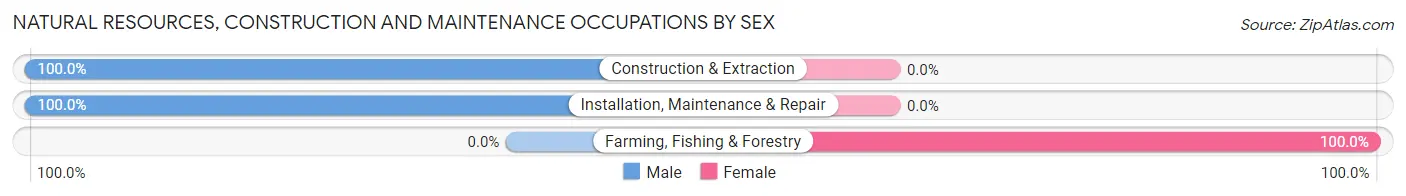
| Occupation | Male | Female |
| Farming, Fishing & Forestry | 0 (0.0%) | 48 (100.0%) |
| Construction & Extraction | 331 (100.0%) | 0 (0.0%) |
| Installation, Maintenance & Repair | 240 (100.0%) | 0 (0.0%) |
| Total (Category) | 571 (92.2%) | 48 (7.7%) |
| Total (Overall) | 3,121 (53.1%) | 2,751 (46.9%) |
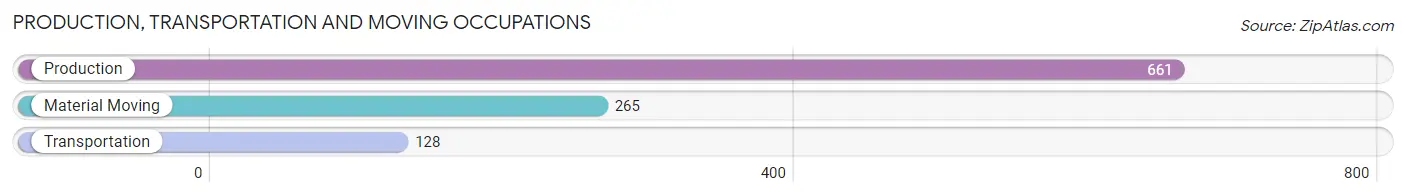
Production, Transportation and Moving Occupations
The most common Production, Transportation and Moving occupations in Woodhaven are Production (661 | 11.3%), Material Moving (265 | 4.5%), and Transportation (128 | 2.2%).
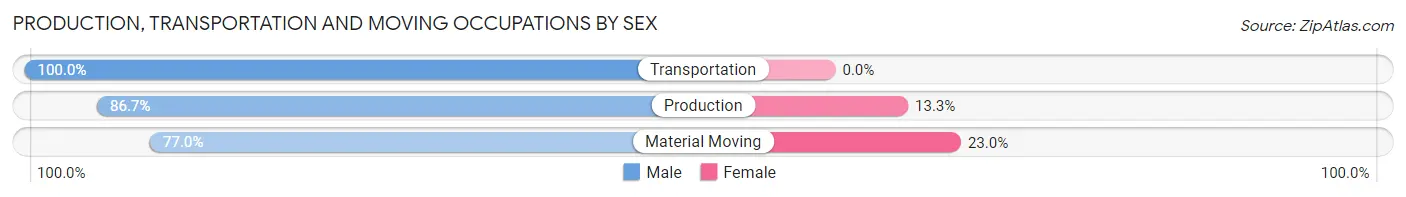
Production, Transportation and Moving Occupations by Sex
| Occupation | Male | Female |
| Production | 573 (86.7%) | 88 (13.3%) |
| Transportation | 128 (100.0%) | 0 (0.0%) |
| Material Moving | 204 (77.0%) | 61 (23.0%) |
| Total (Category) | 905 (85.9%) | 149 (14.1%) |
| Total (Overall) | 3,121 (53.1%) | 2,751 (46.9%) |
Employment Industries by Sex in Woodhaven
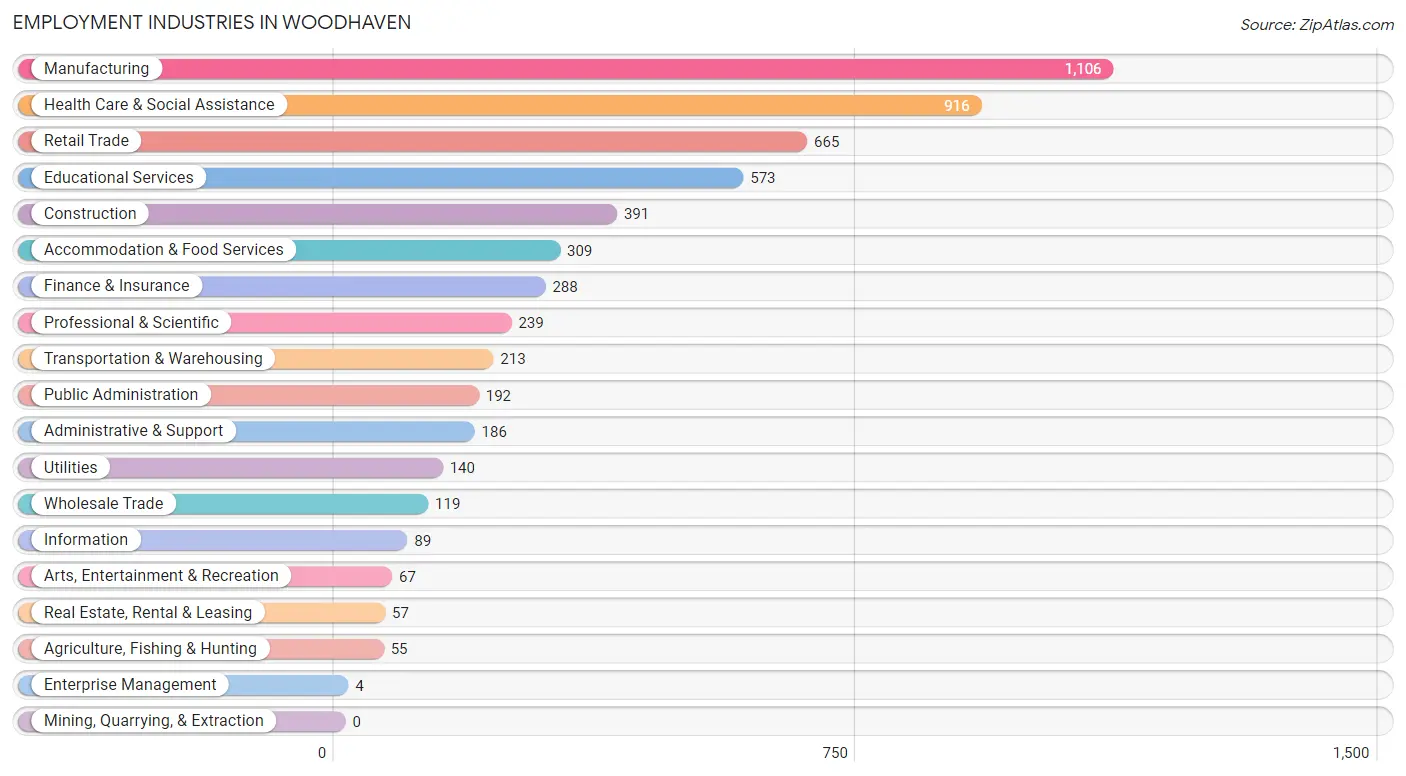
Employment Industries in Woodhaven
The major employment industries in Woodhaven include Manufacturing (1,106 | 18.8%), Health Care & Social Assistance (916 | 15.6%), Retail Trade (665 | 11.3%), Educational Services (573 | 9.8%), and Construction (391 | 6.7%).
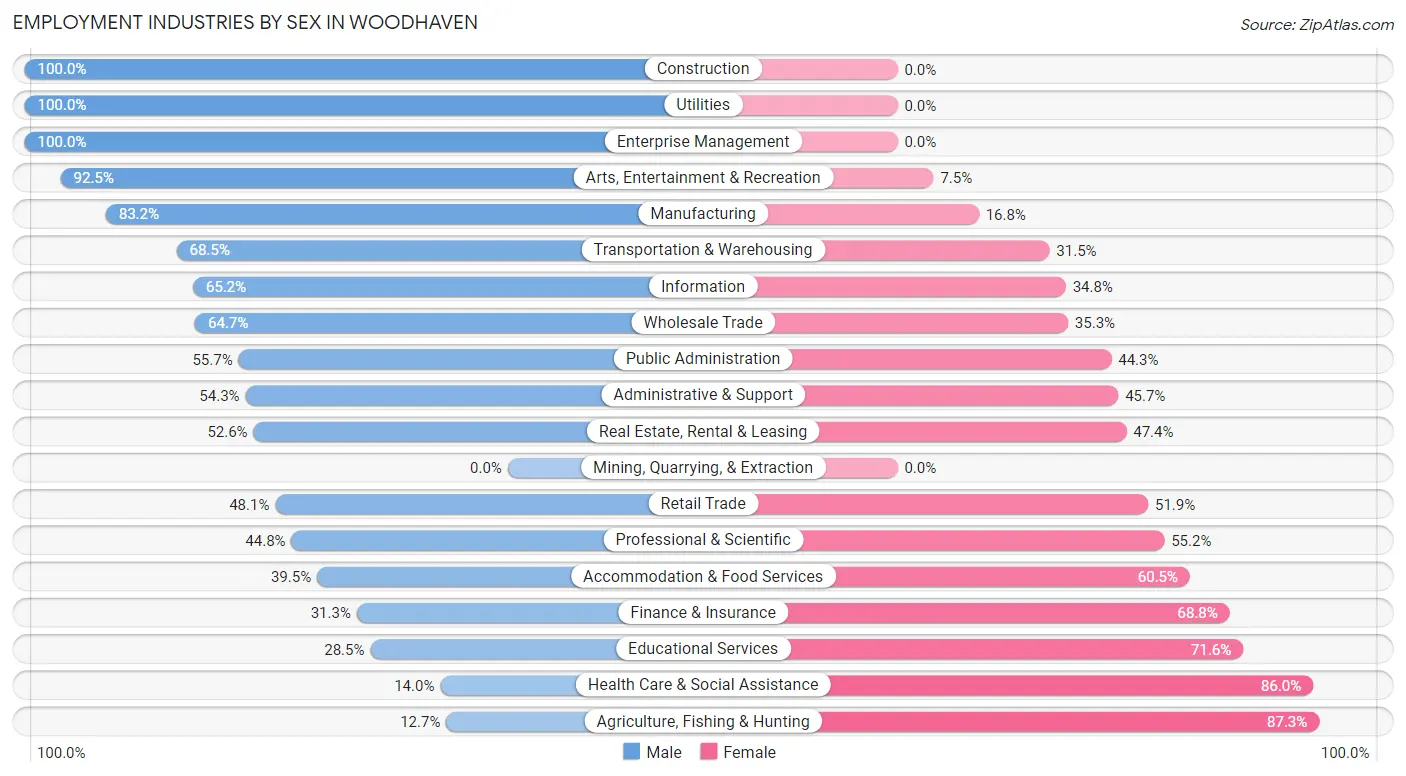
Employment Industries by Sex in Woodhaven
The Woodhaven industries that see more men than women are Construction (100.0%), Utilities (100.0%), and Enterprise Management (100.0%), whereas the industries that tend to have a higher number of women are Agriculture, Fishing & Hunting (87.3%), Health Care & Social Assistance (86.0%), and Educational Services (71.6%).
| Industry | Male | Female |
| Agriculture, Fishing & Hunting | 7 (12.7%) | 48 (87.3%) |
| Mining, Quarrying, & Extraction | 0 (0.0%) | 0 (0.0%) |
| Construction | 391 (100.0%) | 0 (0.0%) |
| Manufacturing | 920 (83.2%) | 186 (16.8%) |
| Wholesale Trade | 77 (64.7%) | 42 (35.3%) |
| Retail Trade | 320 (48.1%) | 345 (51.9%) |
| Transportation & Warehousing | 146 (68.5%) | 67 (31.5%) |
| Utilities | 140 (100.0%) | 0 (0.0%) |
| Information | 58 (65.2%) | 31 (34.8%) |
| Finance & Insurance | 90 (31.2%) | 198 (68.8%) |
| Real Estate, Rental & Leasing | 30 (52.6%) | 27 (47.4%) |
| Professional & Scientific | 107 (44.8%) | 132 (55.2%) |
| Enterprise Management | 4 (100.0%) | 0 (0.0%) |
| Administrative & Support | 101 (54.3%) | 85 (45.7%) |
| Educational Services | 163 (28.4%) | 410 (71.6%) |
| Health Care & Social Assistance | 128 (14.0%) | 788 (86.0%) |
| Arts, Entertainment & Recreation | 62 (92.5%) | 5 (7.5%) |
| Accommodation & Food Services | 122 (39.5%) | 187 (60.5%) |
| Public Administration | 107 (55.7%) | 85 (44.3%) |
| Total | 3,121 (53.1%) | 2,751 (46.9%) |
Education in Woodhaven
School Enrollment in Woodhaven
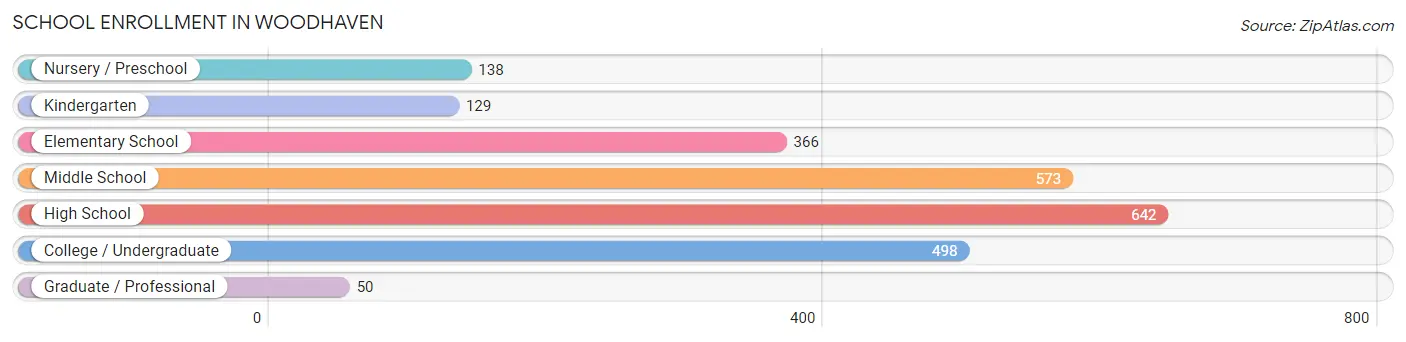
The most common levels of schooling among the 2,396 students in Woodhaven are high school (642 | 26.8%), middle school (573 | 23.9%), and college / undergraduate (498 | 20.8%).
| School Level | # Students | % Students |
| Nursery / Preschool | 138 | 5.8% |
| Kindergarten | 129 | 5.4% |
| Elementary School | 366 | 15.3% |
| Middle School | 573 | 23.9% |
| High School | 642 | 26.8% |
| College / Undergraduate | 498 | 20.8% |
| Graduate / Professional | 50 | 2.1% |
| Total | 2,396 | 100.0% |
School Enrollment by Age by Funding Source in Woodhaven
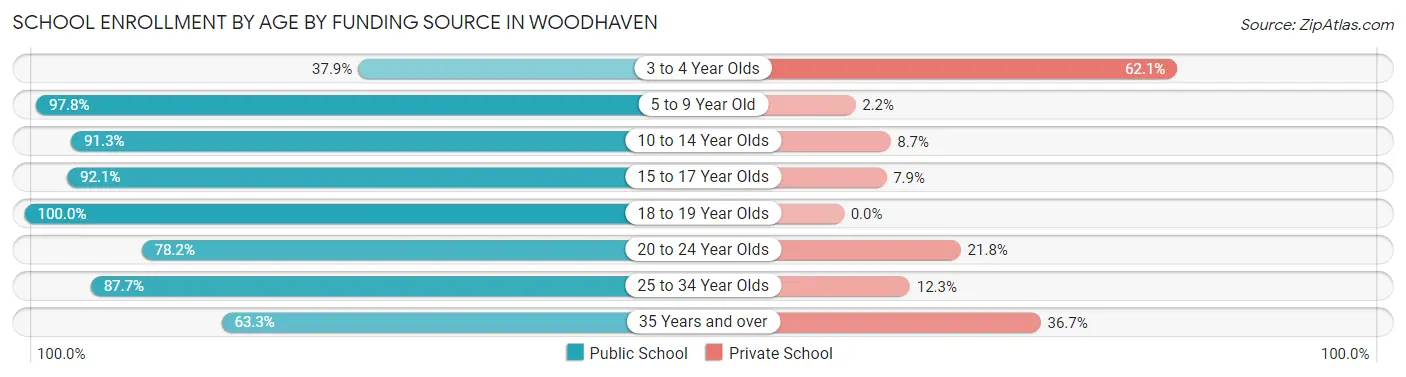
Out of a total of 2,396 students who are enrolled in schools in Woodhaven, 252 (10.5%) attend a private institution, while the remaining 2,144 (89.5%) are enrolled in public schools. The age group of 3 to 4 year olds has the highest likelihood of being enrolled in private schools, with 41 (62.1% in the age bracket) enrolled. Conversely, the age group of 18 to 19 year olds has the lowest likelihood of being enrolled in a private school, with 108 (100.0% in the age bracket) attending a public institution.
| Age Bracket | Public School | Private School |
| 3 to 4 Year Olds | 25 (37.9%) | 41 (62.1%) |
| 5 to 9 Year Old | 543 (97.8%) | 12 (2.2%) |
| 10 to 14 Year Olds | 715 (91.3%) | 68 (8.7%) |
| 15 to 17 Year Olds | 372 (92.1%) | 32 (7.9%) |
| 18 to 19 Year Olds | 108 (100.0%) | 0 (0.0%) |
| 20 to 24 Year Olds | 140 (78.2%) | 39 (21.8%) |
| 25 to 34 Year Olds | 185 (87.7%) | 26 (12.3%) |
| 35 Years and over | 57 (63.3%) | 33 (36.7%) |
| Total | 2,144 (89.5%) | 252 (10.5%) |
Educational Attainment by Field of Study in Woodhaven
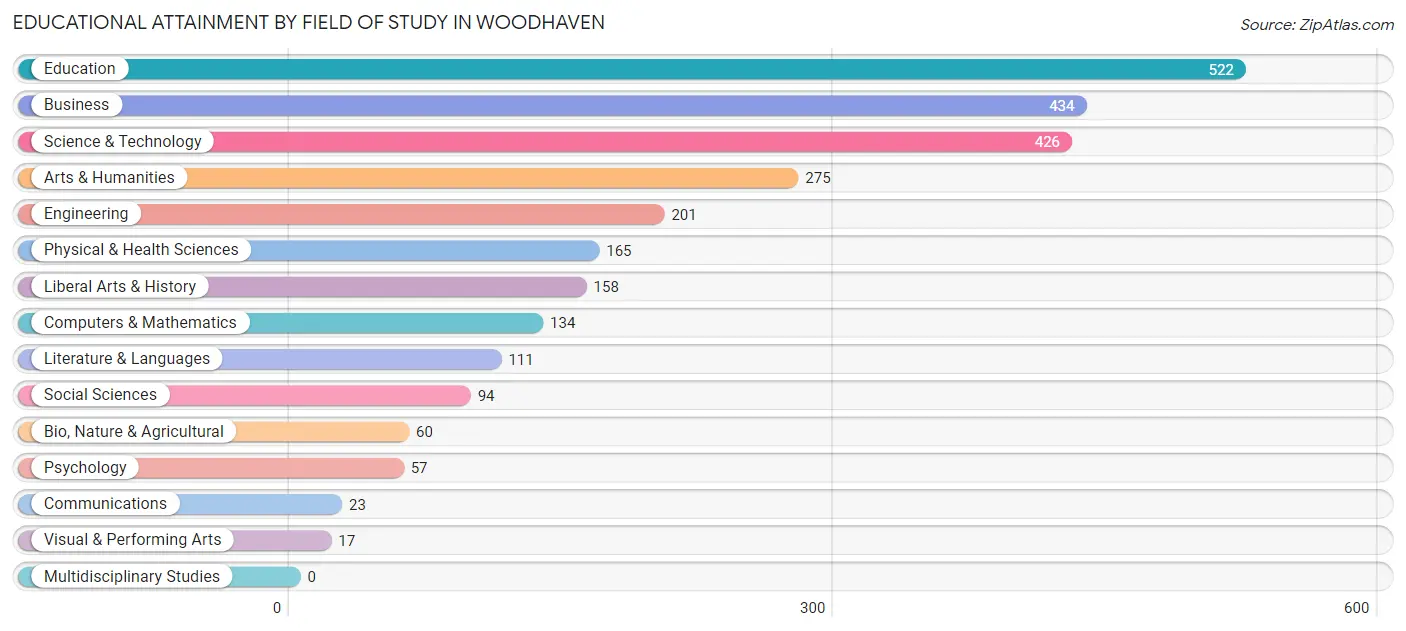
Education (522 | 19.5%), business (434 | 16.2%), science & technology (426 | 15.9%), arts & humanities (275 | 10.3%), and engineering (201 | 7.5%) are the most common fields of study among 2,677 individuals in Woodhaven who have obtained a bachelor's degree or higher.
| Field of Study | # Graduates | % Graduates |
| Computers & Mathematics | 134 | 5.0% |
| Bio, Nature & Agricultural | 60 | 2.2% |
| Physical & Health Sciences | 165 | 6.2% |
| Psychology | 57 | 2.1% |
| Social Sciences | 94 | 3.5% |
| Engineering | 201 | 7.5% |
| Multidisciplinary Studies | 0 | 0.0% |
| Science & Technology | 426 | 15.9% |
| Business | 434 | 16.2% |
| Education | 522 | 19.5% |
| Literature & Languages | 111 | 4.2% |
| Liberal Arts & History | 158 | 5.9% |
| Visual & Performing Arts | 17 | 0.6% |
| Communications | 23 | 0.9% |
| Arts & Humanities | 275 | 10.3% |
| Total | 2,677 | 100.0% |
Transportation & Commute in Woodhaven
Vehicle Availability by Sex in Woodhaven
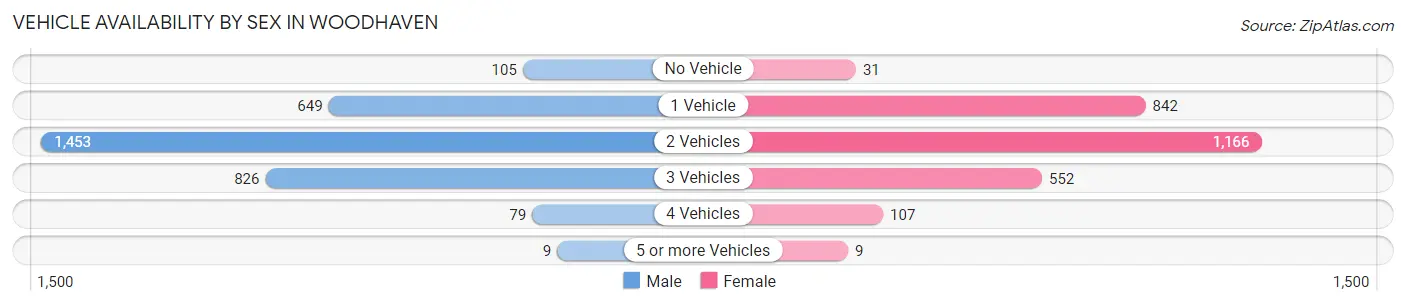
The most prevalent vehicle ownership categories in Woodhaven are males with 2 vehicles (1,453, accounting for 46.6%) and females with 2 vehicles (1,166, making up 53.7%).
| Vehicles Available | Male | Female |
| No Vehicle | 105 (3.4%) | 31 (1.1%) |
| 1 Vehicle | 649 (20.8%) | 842 (31.1%) |
| 2 Vehicles | 1,453 (46.6%) | 1,166 (43.1%) |
| 3 Vehicles | 826 (26.5%) | 552 (20.4%) |
| 4 Vehicles | 79 (2.5%) | 107 (4.0%) |
| 5 or more Vehicles | 9 (0.3%) | 9 (0.3%) |
| Total | 3,121 (100.0%) | 2,707 (100.0%) |
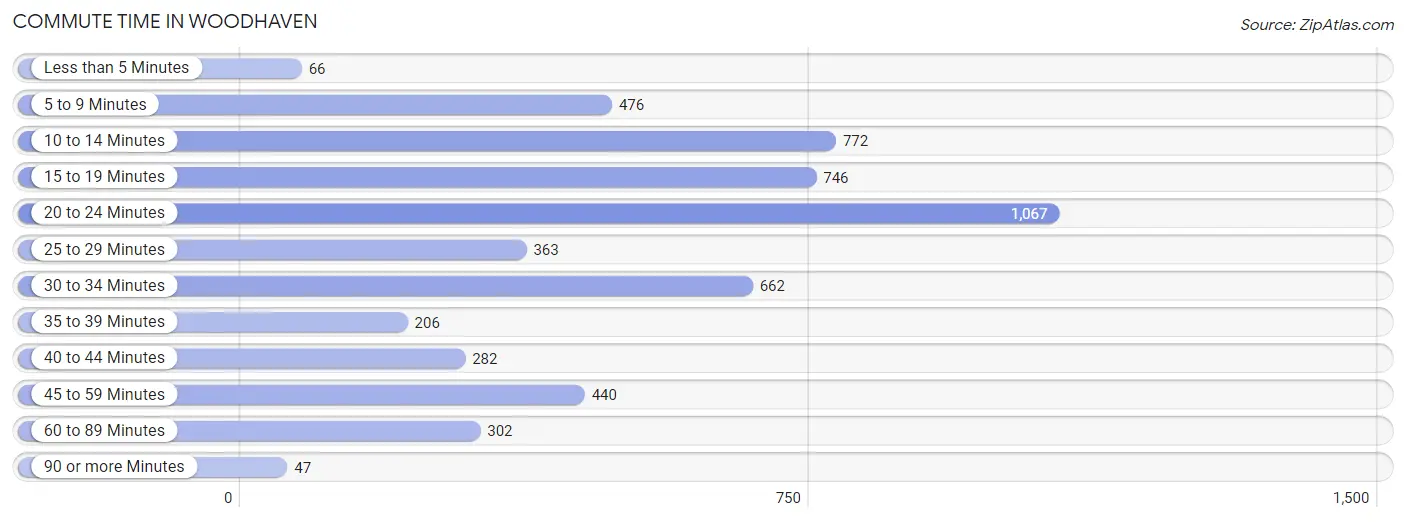
Commute Time in Woodhaven
The most frequently occuring commute durations in Woodhaven are 20 to 24 minutes (1,067 commuters, 19.7%), 10 to 14 minutes (772 commuters, 14.2%), and 15 to 19 minutes (746 commuters, 13.7%).
| Commute Time | # Commuters | % Commuters |
| Less than 5 Minutes | 66 | 1.2% |
| 5 to 9 Minutes | 476 | 8.8% |
| 10 to 14 Minutes | 772 | 14.2% |
| 15 to 19 Minutes | 746 | 13.7% |
| 20 to 24 Minutes | 1,067 | 19.7% |
| 25 to 29 Minutes | 363 | 6.7% |
| 30 to 34 Minutes | 662 | 12.2% |
| 35 to 39 Minutes | 206 | 3.8% |
| 40 to 44 Minutes | 282 | 5.2% |
| 45 to 59 Minutes | 440 | 8.1% |
| 60 to 89 Minutes | 302 | 5.6% |
| 90 or more Minutes | 47 | 0.9% |
Commute Time by Sex in Woodhaven
The most common commute times in Woodhaven are 20 to 24 minutes (495 commuters, 16.9%) for males and 20 to 24 minutes (572 commuters, 22.9%) for females.
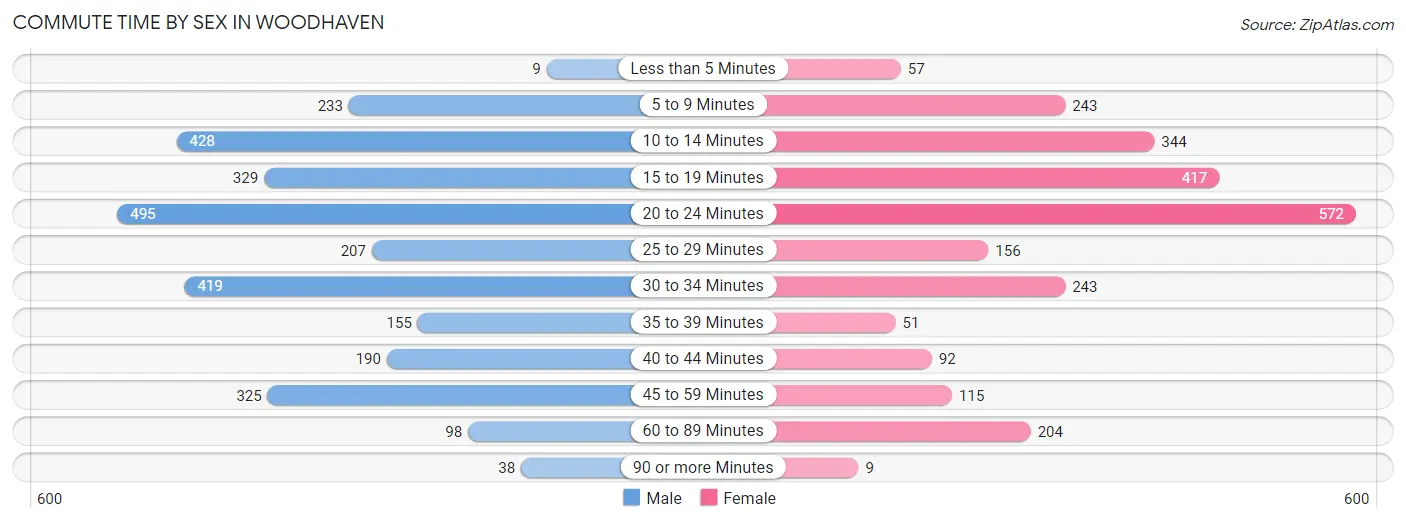
| Commute Time | Male | Female |
| Less than 5 Minutes | 9 (0.3%) | 57 (2.3%) |
| 5 to 9 Minutes | 233 (8.0%) | 243 (9.7%) |
| 10 to 14 Minutes | 428 (14.6%) | 344 (13.7%) |
| 15 to 19 Minutes | 329 (11.2%) | 417 (16.7%) |
| 20 to 24 Minutes | 495 (16.9%) | 572 (22.9%) |
| 25 to 29 Minutes | 207 (7.1%) | 156 (6.2%) |
| 30 to 34 Minutes | 419 (14.3%) | 243 (9.7%) |
| 35 to 39 Minutes | 155 (5.3%) | 51 (2.0%) |
| 40 to 44 Minutes | 190 (6.5%) | 92 (3.7%) |
| 45 to 59 Minutes | 325 (11.1%) | 115 (4.6%) |
| 60 to 89 Minutes | 98 (3.4%) | 204 (8.2%) |
| 90 or more Minutes | 38 (1.3%) | 9 (0.4%) |
Time of Departure to Work by Sex in Woodhaven
The most frequent times of departure to work in Woodhaven are 6:00 AM to 6:29 AM (379, 13.0%) for males and 6:30 AM to 6:59 AM (430, 17.2%) for females.
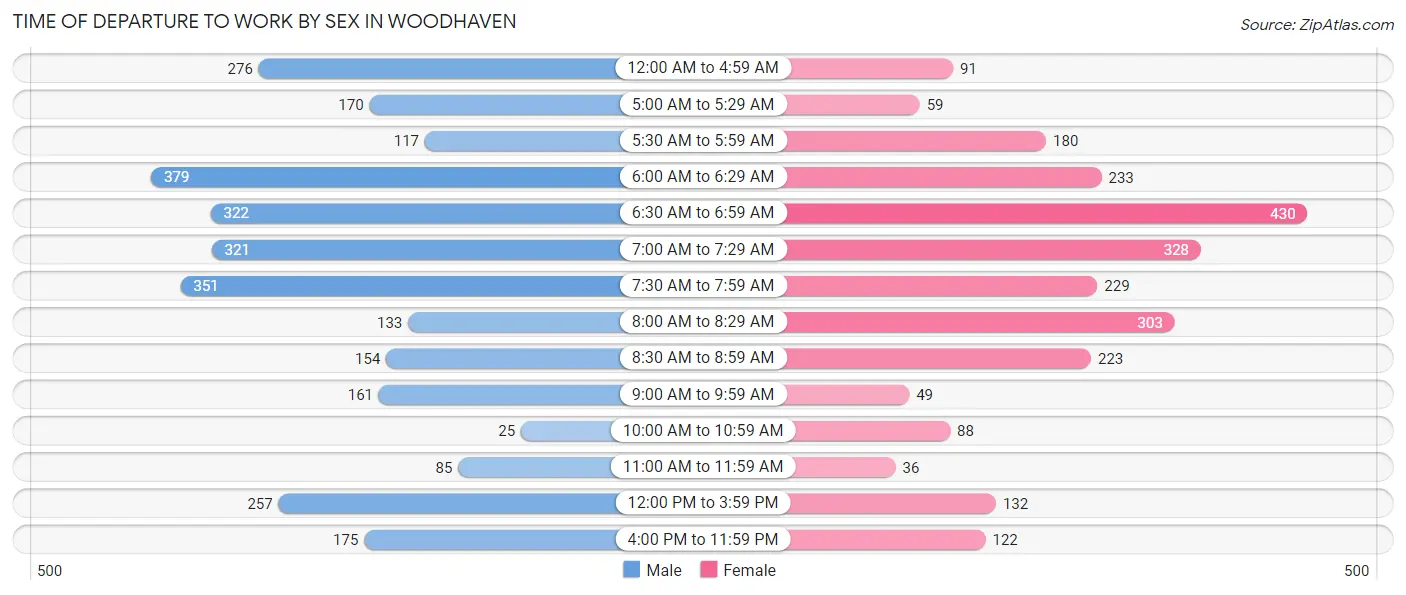
| Time of Departure | Male | Female |
| 12:00 AM to 4:59 AM | 276 (9.4%) | 91 (3.6%) |
| 5:00 AM to 5:29 AM | 170 (5.8%) | 59 (2.4%) |
| 5:30 AM to 5:59 AM | 117 (4.0%) | 180 (7.2%) |
| 6:00 AM to 6:29 AM | 379 (13.0%) | 233 (9.3%) |
| 6:30 AM to 6:59 AM | 322 (11.0%) | 430 (17.2%) |
| 7:00 AM to 7:29 AM | 321 (11.0%) | 328 (13.1%) |
| 7:30 AM to 7:59 AM | 351 (12.0%) | 229 (9.1%) |
| 8:00 AM to 8:29 AM | 133 (4.5%) | 303 (12.1%) |
| 8:30 AM to 8:59 AM | 154 (5.3%) | 223 (8.9%) |
| 9:00 AM to 9:59 AM | 161 (5.5%) | 49 (2.0%) |
| 10:00 AM to 10:59 AM | 25 (0.9%) | 88 (3.5%) |
| 11:00 AM to 11:59 AM | 85 (2.9%) | 36 (1.4%) |
| 12:00 PM to 3:59 PM | 257 (8.8%) | 132 (5.3%) |
| 4:00 PM to 11:59 PM | 175 (6.0%) | 122 (4.9%) |
| Total | 2,926 (100.0%) | 2,503 (100.0%) |
Housing Occupancy in Woodhaven
Occupancy by Ownership in Woodhaven
Of the total 5,344 dwellings in Woodhaven, owner-occupied units account for 4,107 (76.8%), while renter-occupied units make up 1,237 (23.2%).
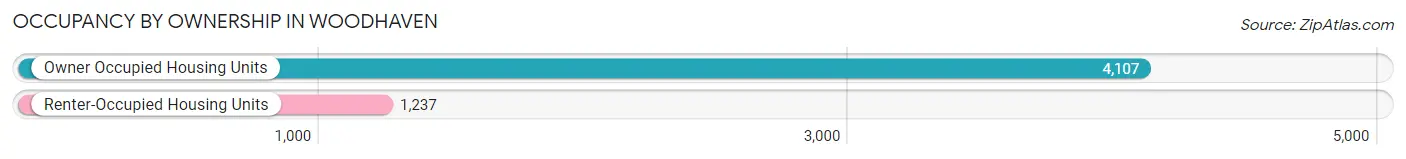
| Occupancy | # Housing Units | % Housing Units |
| Owner Occupied Housing Units | 4,107 | 76.8% |
| Renter-Occupied Housing Units | 1,237 | 23.2% |
| Total Occupied Housing Units | 5,344 | 100.0% |
Occupancy by Household Size in Woodhaven
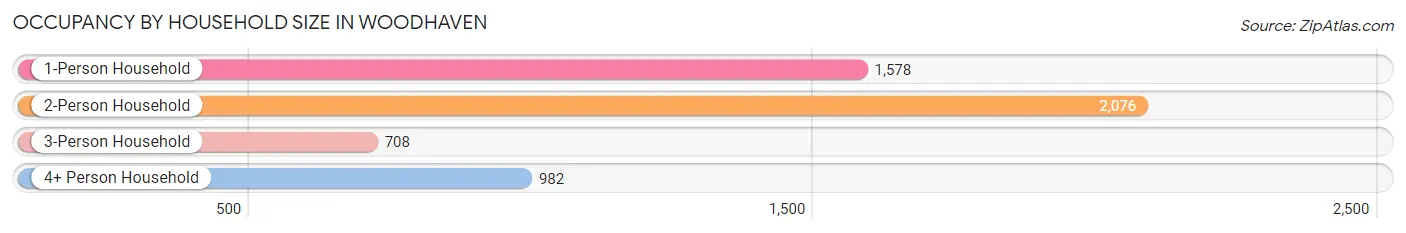
| Household Size | # Housing Units | % Housing Units |
| 1-Person Household | 1,578 | 29.5% |
| 2-Person Household | 2,076 | 38.9% |
| 3-Person Household | 708 | 13.3% |
| 4+ Person Household | 982 | 18.4% |
| Total Housing Units | 5,344 | 100.0% |
Occupancy by Ownership by Household Size in Woodhaven
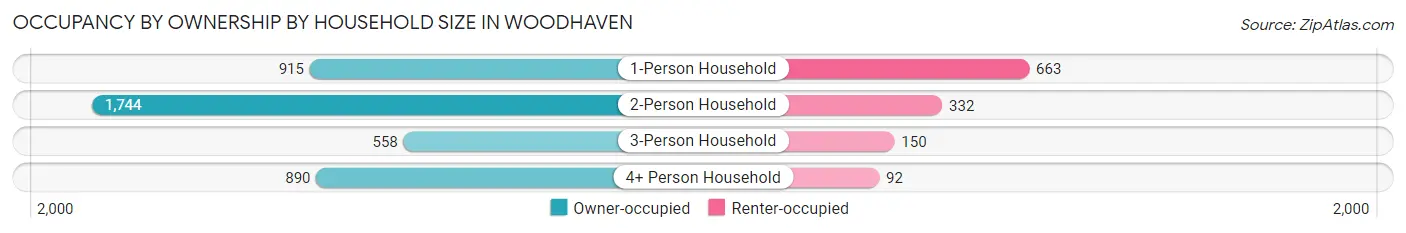
| Household Size | Owner-occupied | Renter-occupied |
| 1-Person Household | 915 (58.0%) | 663 (42.0%) |
| 2-Person Household | 1,744 (84.0%) | 332 (16.0%) |
| 3-Person Household | 558 (78.8%) | 150 (21.2%) |
| 4+ Person Household | 890 (90.6%) | 92 (9.4%) |
| Total Housing Units | 4,107 (76.8%) | 1,237 (23.2%) |
Occupancy by Educational Attainment in Woodhaven
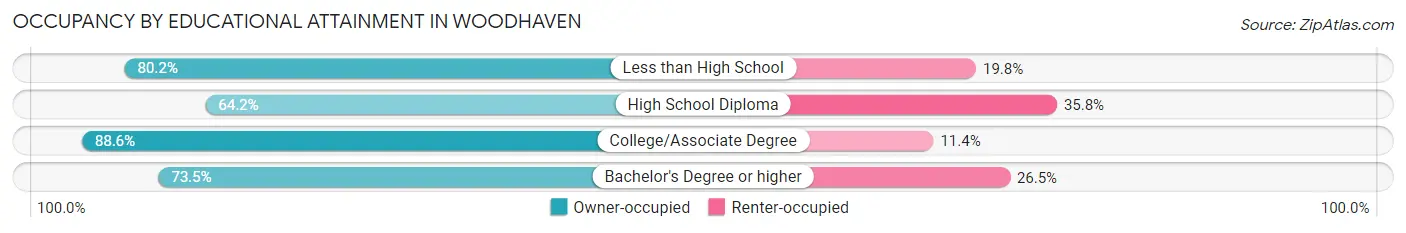
| Household Size | Owner-occupied | Renter-occupied |
| Less than High School | 166 (80.2%) | 41 (19.8%) |
| High School Diploma | 1,042 (64.2%) | 582 (35.8%) |
| College/Associate Degree | 1,857 (88.6%) | 238 (11.4%) |
| Bachelor's Degree or higher | 1,042 (73.5%) | 376 (26.5%) |
Occupancy by Age of Householder in Woodhaven
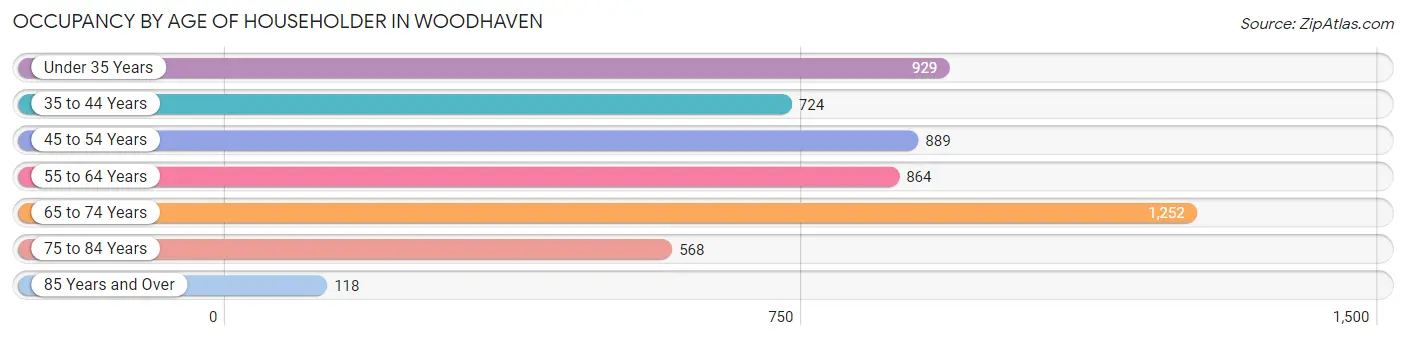
| Age Bracket | # Households | % Households |
| Under 35 Years | 929 | 17.4% |
| 35 to 44 Years | 724 | 13.6% |
| 45 to 54 Years | 889 | 16.6% |
| 55 to 64 Years | 864 | 16.2% |
| 65 to 74 Years | 1,252 | 23.4% |
| 75 to 84 Years | 568 | 10.6% |
| 85 Years and Over | 118 | 2.2% |
| Total | 5,344 | 100.0% |
Housing Finances in Woodhaven
Median Income by Occupancy in Woodhaven
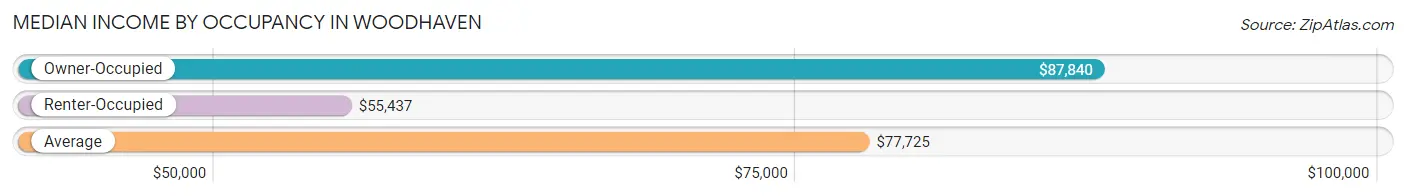
| Occupancy Type | # Households | Median Income |
| Owner-Occupied | 4,107 (76.8%) | $87,840 |
| Renter-Occupied | 1,237 (23.2%) | $55,437 |
| Average | 5,344 (100.0%) | $77,725 |
Occupancy by Householder Income Bracket in Woodhaven
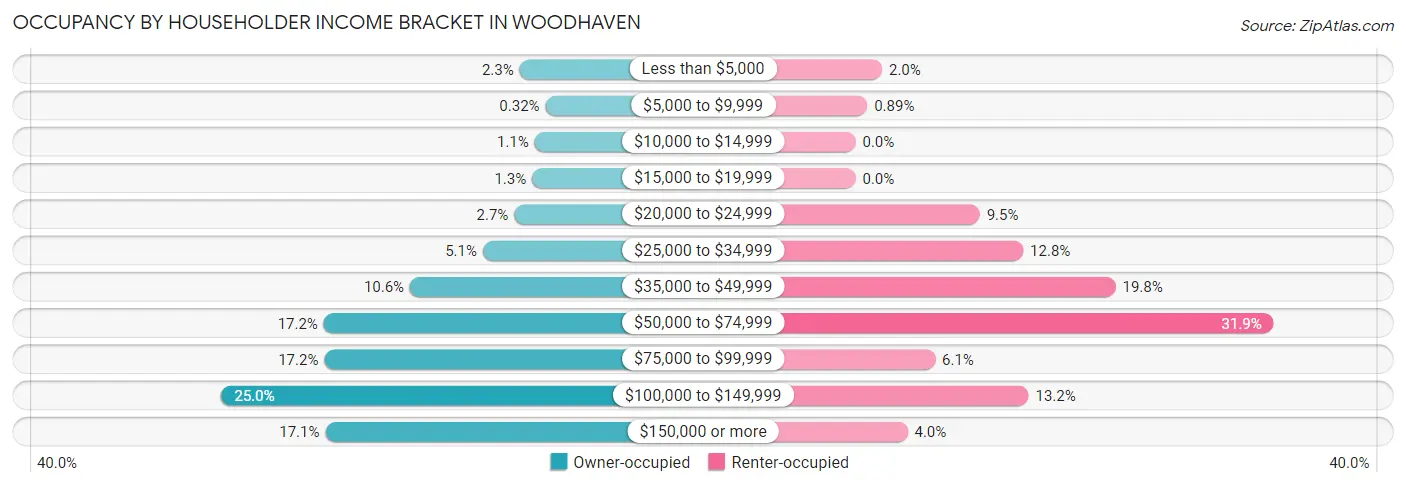
| Income Bracket | Owner-occupied | Renter-occupied |
| Less than $5,000 | 94 (2.3%) | 25 (2.0%) |
| $5,000 to $9,999 | 13 (0.3%) | 11 (0.9%) |
| $10,000 to $14,999 | 47 (1.1%) | 0 (0.0%) |
| $15,000 to $19,999 | 55 (1.3%) | 0 (0.0%) |
| $20,000 to $24,999 | 111 (2.7%) | 117 (9.5%) |
| $25,000 to $34,999 | 209 (5.1%) | 158 (12.8%) |
| $35,000 to $49,999 | 437 (10.6%) | 245 (19.8%) |
| $50,000 to $74,999 | 707 (17.2%) | 394 (31.9%) |
| $75,000 to $99,999 | 705 (17.2%) | 75 (6.1%) |
| $100,000 to $149,999 | 1,027 (25.0%) | 163 (13.2%) |
| $150,000 or more | 702 (17.1%) | 49 (4.0%) |
| Total | 4,107 (100.0%) | 1,237 (100.0%) |
Monthly Housing Cost Tiers in Woodhaven
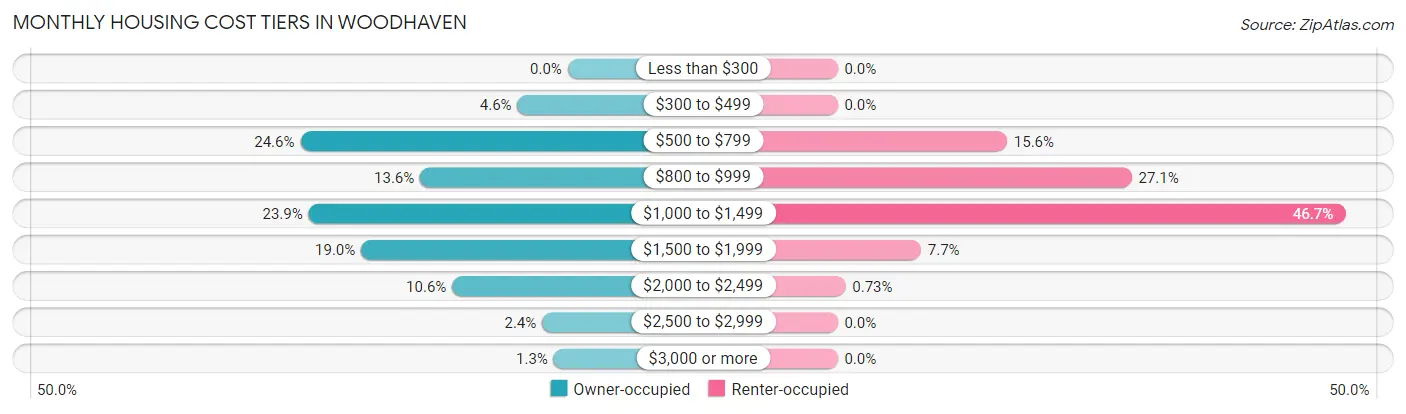
| Monthly Cost | Owner-occupied | Renter-occupied |
| Less than $300 | 0 (0.0%) | 0 (0.0%) |
| $300 to $499 | 190 (4.6%) | 0 (0.0%) |
| $500 to $799 | 1,011 (24.6%) | 193 (15.6%) |
| $800 to $999 | 558 (13.6%) | 335 (27.1%) |
| $1,000 to $1,499 | 980 (23.9%) | 578 (46.7%) |
| $1,500 to $1,999 | 781 (19.0%) | 95 (7.7%) |
| $2,000 to $2,499 | 437 (10.6%) | 9 (0.7%) |
| $2,500 to $2,999 | 97 (2.4%) | 0 (0.0%) |
| $3,000 or more | 53 (1.3%) | 0 (0.0%) |
| Total | 4,107 (100.0%) | 1,237 (100.0%) |
Physical Housing Characteristics in Woodhaven
Housing Structures in Woodhaven
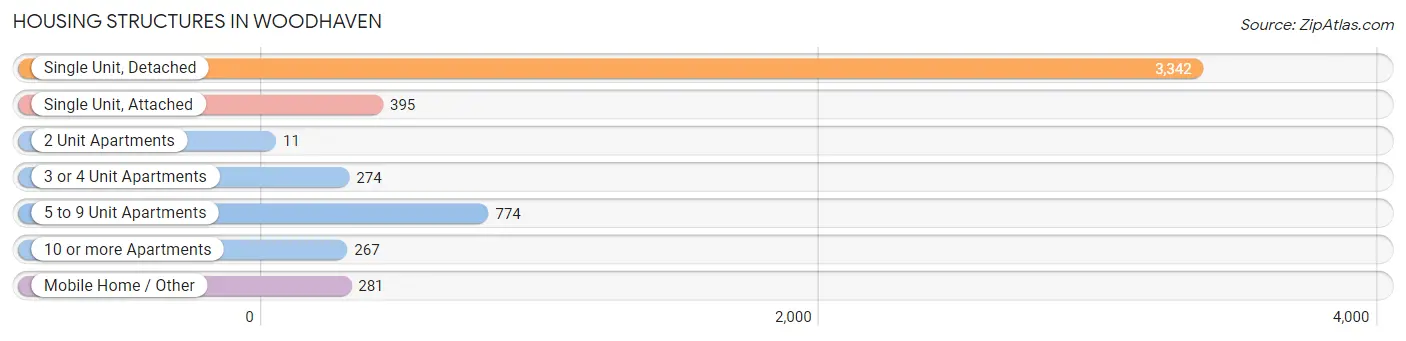
| Structure Type | # Housing Units | % Housing Units |
| Single Unit, Detached | 3,342 | 62.5% |
| Single Unit, Attached | 395 | 7.4% |
| 2 Unit Apartments | 11 | 0.2% |
| 3 or 4 Unit Apartments | 274 | 5.1% |
| 5 to 9 Unit Apartments | 774 | 14.5% |
| 10 or more Apartments | 267 | 5.0% |
| Mobile Home / Other | 281 | 5.3% |
| Total | 5,344 | 100.0% |
Housing Structures by Occupancy in Woodhaven
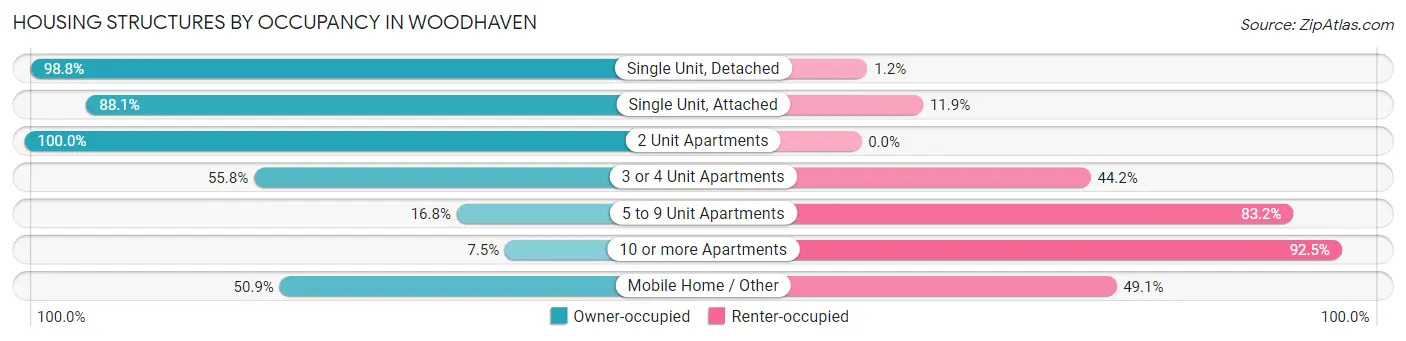
| Structure Type | Owner-occupied | Renter-occupied |
| Single Unit, Detached | 3,302 (98.8%) | 40 (1.2%) |
| Single Unit, Attached | 348 (88.1%) | 47 (11.9%) |
| 2 Unit Apartments | 11 (100.0%) | 0 (0.0%) |
| 3 or 4 Unit Apartments | 153 (55.8%) | 121 (44.2%) |
| 5 to 9 Unit Apartments | 130 (16.8%) | 644 (83.2%) |
| 10 or more Apartments | 20 (7.5%) | 247 (92.5%) |
| Mobile Home / Other | 143 (50.9%) | 138 (49.1%) |
| Total | 4,107 (76.8%) | 1,237 (23.2%) |
Housing Structures by Number of Rooms in Woodhaven
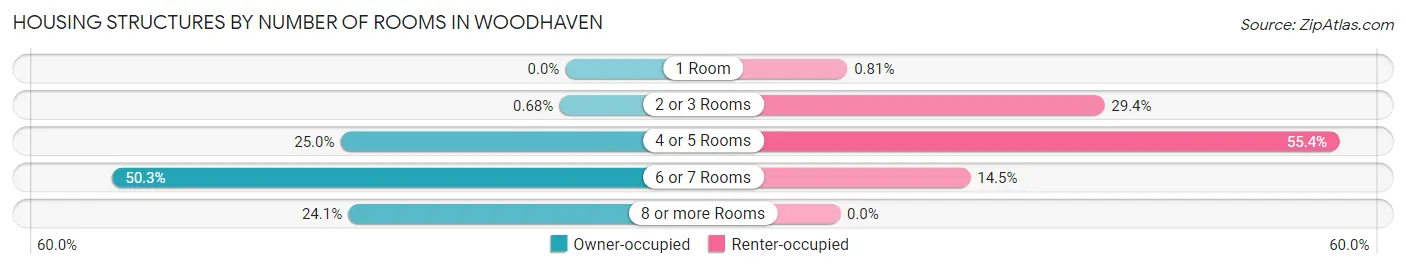
| Number of Rooms | Owner-occupied | Renter-occupied |
| 1 Room | 0 (0.0%) | 10 (0.8%) |
| 2 or 3 Rooms | 28 (0.7%) | 363 (29.3%) |
| 4 or 5 Rooms | 1,025 (25.0%) | 685 (55.4%) |
| 6 or 7 Rooms | 2,064 (50.3%) | 179 (14.5%) |
| 8 or more Rooms | 990 (24.1%) | 0 (0.0%) |
| Total | 4,107 (100.0%) | 1,237 (100.0%) |
Housing Structure by Heating Type in Woodhaven
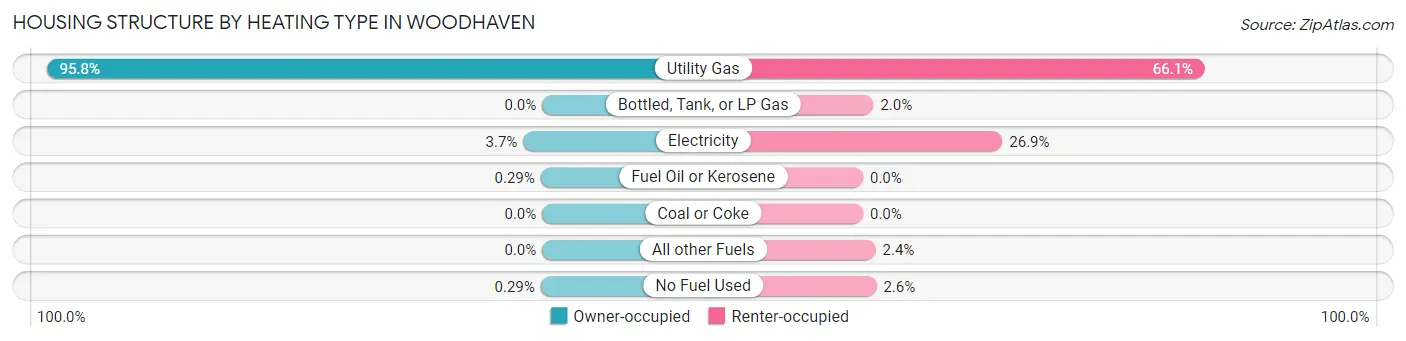
| Heating Type | Owner-occupied | Renter-occupied |
| Utility Gas | 3,933 (95.8%) | 817 (66.0%) |
| Bottled, Tank, or LP Gas | 0 (0.0%) | 25 (2.0%) |
| Electricity | 150 (3.6%) | 333 (26.9%) |
| Fuel Oil or Kerosene | 12 (0.3%) | 0 (0.0%) |
| Coal or Coke | 0 (0.0%) | 0 (0.0%) |
| All other Fuels | 0 (0.0%) | 30 (2.4%) |
| No Fuel Used | 12 (0.3%) | 32 (2.6%) |
| Total | 4,107 (100.0%) | 1,237 (100.0%) |
Household Vehicle Usage in Woodhaven
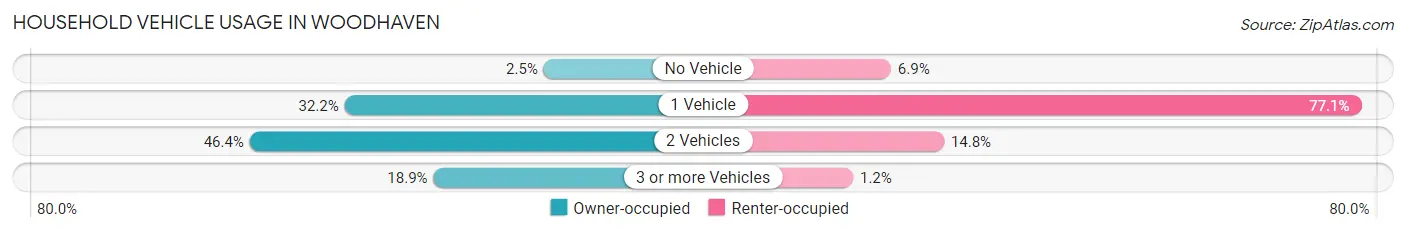
| Vehicles per Household | Owner-occupied | Renter-occupied |
| No Vehicle | 101 (2.5%) | 85 (6.9%) |
| 1 Vehicle | 1,323 (32.2%) | 954 (77.1%) |
| 2 Vehicles | 1,905 (46.4%) | 183 (14.8%) |
| 3 or more Vehicles | 778 (18.9%) | 15 (1.2%) |
| Total | 4,107 (100.0%) | 1,237 (100.0%) |
Real Estate & Mortgages in Woodhaven
Real Estate and Mortgage Overview in Woodhaven
| Characteristic | Without Mortgage | With Mortgage |
| Housing Units | 1,532 | 2,575 |
| Median Property Value | $202,300 | $214,500 |
| Median Household Income | $59,313 | $514 |
| Monthly Housing Costs | $694 | $53 |
| Real Estate Taxes | $3,837 | $188 |
Property Value by Mortgage Status in Woodhaven
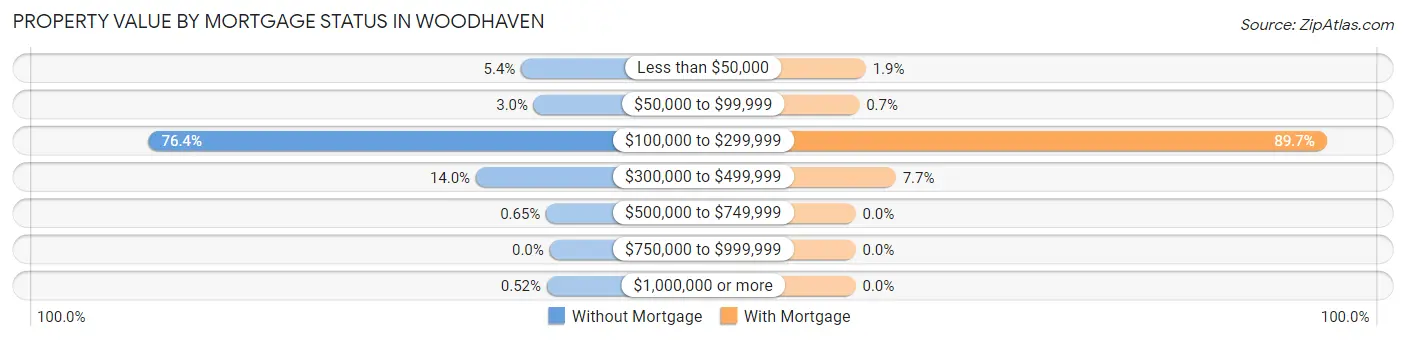
| Property Value | Without Mortgage | With Mortgage |
| Less than $50,000 | 83 (5.4%) | 50 (1.9%) |
| $50,000 to $99,999 | 46 (3.0%) | 18 (0.7%) |
| $100,000 to $299,999 | 1,170 (76.4%) | 2,310 (89.7%) |
| $300,000 to $499,999 | 215 (14.0%) | 197 (7.6%) |
| $500,000 to $749,999 | 10 (0.6%) | 0 (0.0%) |
| $750,000 to $999,999 | 0 (0.0%) | 0 (0.0%) |
| $1,000,000 or more | 8 (0.5%) | 0 (0.0%) |
| Total | 1,532 (100.0%) | 2,575 (100.0%) |
Household Income by Mortgage Status in Woodhaven
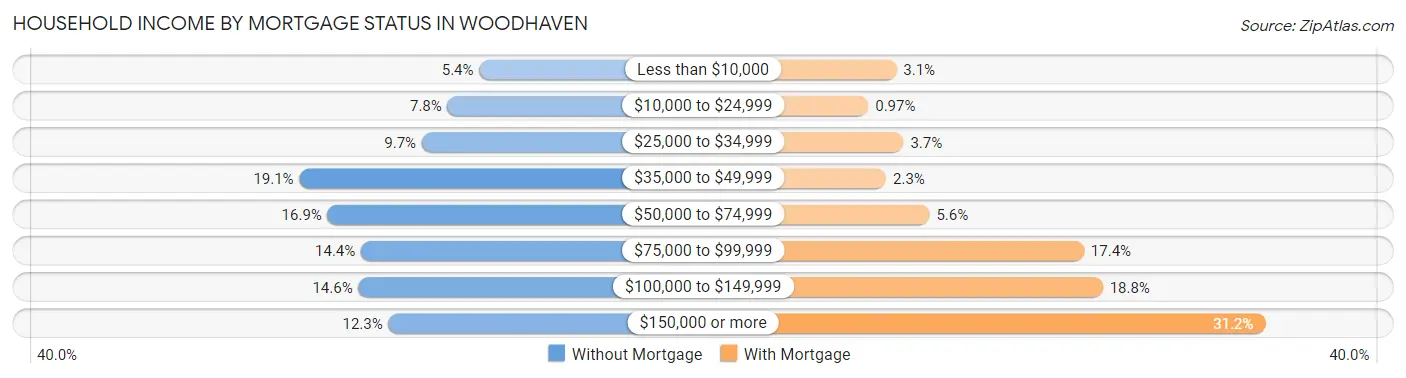
| Household Income | Without Mortgage | With Mortgage |
| Less than $10,000 | 82 (5.3%) | 80 (3.1%) |
| $10,000 to $24,999 | 119 (7.8%) | 25 (1.0%) |
| $25,000 to $34,999 | 149 (9.7%) | 94 (3.6%) |
| $35,000 to $49,999 | 292 (19.1%) | 60 (2.3%) |
| $50,000 to $74,999 | 259 (16.9%) | 145 (5.6%) |
| $75,000 to $99,999 | 220 (14.4%) | 448 (17.4%) |
| $100,000 to $149,999 | 223 (14.6%) | 485 (18.8%) |
| $150,000 or more | 188 (12.3%) | 804 (31.2%) |
| Total | 1,532 (100.0%) | 2,575 (100.0%) |
Property Value to Household Income Ratio in Woodhaven
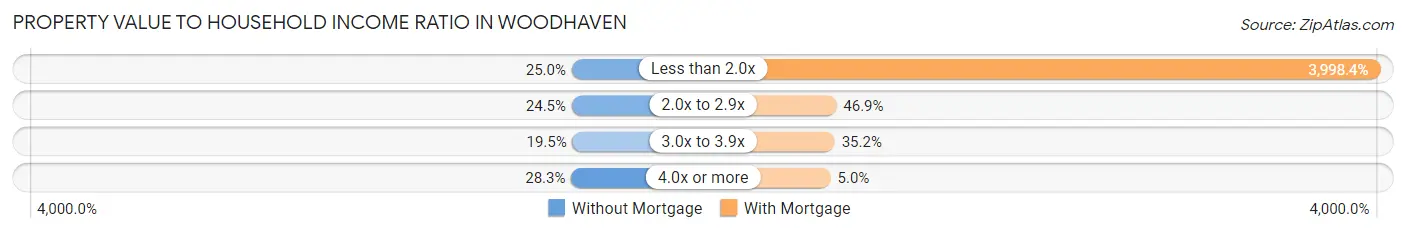
| Value-to-Income Ratio | Without Mortgage | With Mortgage |
| Less than 2.0x | 383 (25.0%) | 102,958 (3,998.4%) |
| 2.0x to 2.9x | 375 (24.5%) | 1,208 (46.9%) |
| 3.0x to 3.9x | 298 (19.5%) | 906 (35.2%) |
| 4.0x or more | 434 (28.3%) | 129 (5.0%) |
| Total | 1,532 (100.0%) | 2,575 (100.0%) |
Real Estate Taxes by Mortgage Status in Woodhaven
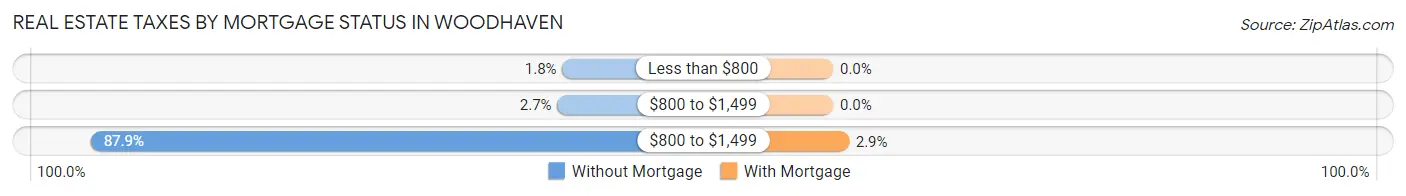
| Property Taxes | Without Mortgage | With Mortgage |
| Less than $800 | 27 (1.8%) | 0 (0.0%) |
| $800 to $1,499 | 41 (2.7%) | 0 (0.0%) |
| $800 to $1,499 | 1,347 (87.9%) | 74 (2.9%) |
| Total | 1,532 (100.0%) | 2,575 (100.0%) |
Health & Disability in Woodhaven
Health Insurance Coverage by Age in Woodhaven
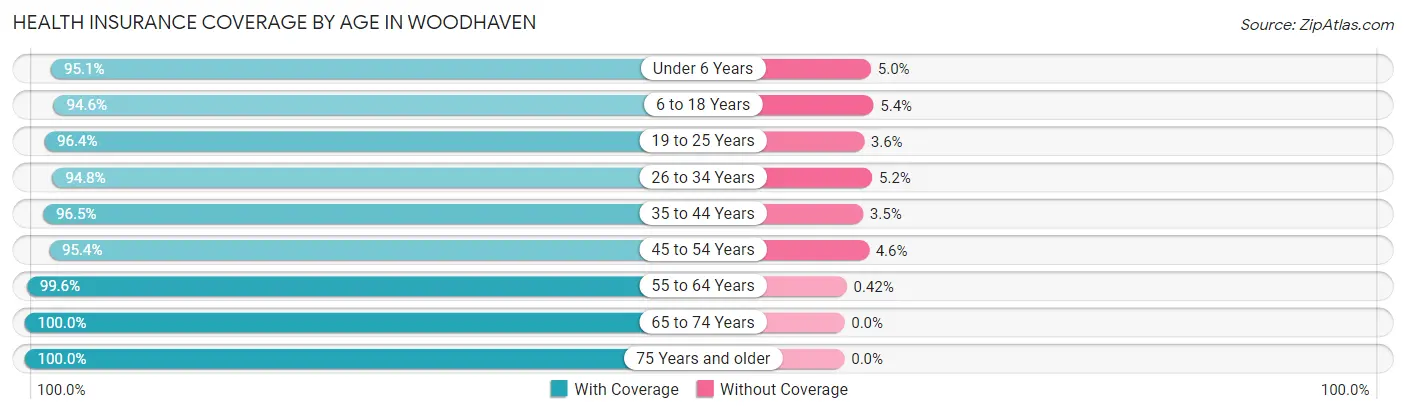
| Age Bracket | With Coverage | Without Coverage |
| Under 6 Years | 710 (95.1%) | 37 (5.0%) |
| 6 to 18 Years | 1,746 (94.6%) | 100 (5.4%) |
| 19 to 25 Years | 688 (96.4%) | 26 (3.6%) |
| 26 to 34 Years | 1,429 (94.8%) | 78 (5.2%) |
| 35 to 44 Years | 1,417 (96.5%) | 51 (3.5%) |
| 45 to 54 Years | 1,569 (95.4%) | 75 (4.6%) |
| 55 to 64 Years | 1,655 (99.6%) | 7 (0.4%) |
| 65 to 74 Years | 2,004 (100.0%) | 0 (0.0%) |
| 75 Years and older | 1,133 (100.0%) | 0 (0.0%) |
| Total | 12,351 (97.1%) | 374 (2.9%) |
Health Insurance Coverage by Citizenship Status in Woodhaven
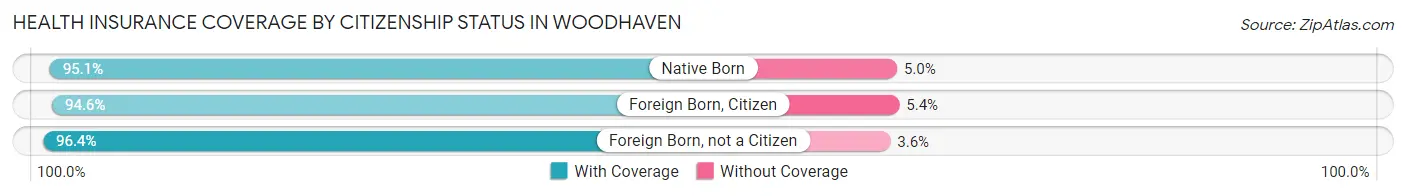
| Citizenship Status | With Coverage | Without Coverage |
| Native Born | 710 (95.1%) | 37 (5.0%) |
| Foreign Born, Citizen | 1,746 (94.6%) | 100 (5.4%) |
| Foreign Born, not a Citizen | 688 (96.4%) | 26 (3.6%) |
Health Insurance Coverage by Household Income in Woodhaven
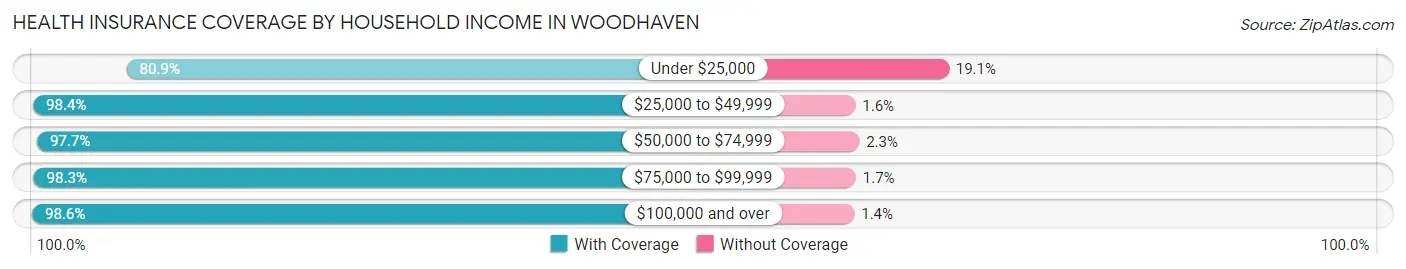
| Household Income | With Coverage | Without Coverage |
| Under $25,000 | 762 (80.9%) | 180 (19.1%) |
| $25,000 to $49,999 | 1,911 (98.4%) | 31 (1.6%) |
| $50,000 to $74,999 | 2,098 (97.7%) | 50 (2.3%) |
| $75,000 to $99,999 | 1,790 (98.3%) | 31 (1.7%) |
| $100,000 and over | 5,773 (98.6%) | 82 (1.4%) |
Public vs Private Health Insurance Coverage by Age in Woodhaven
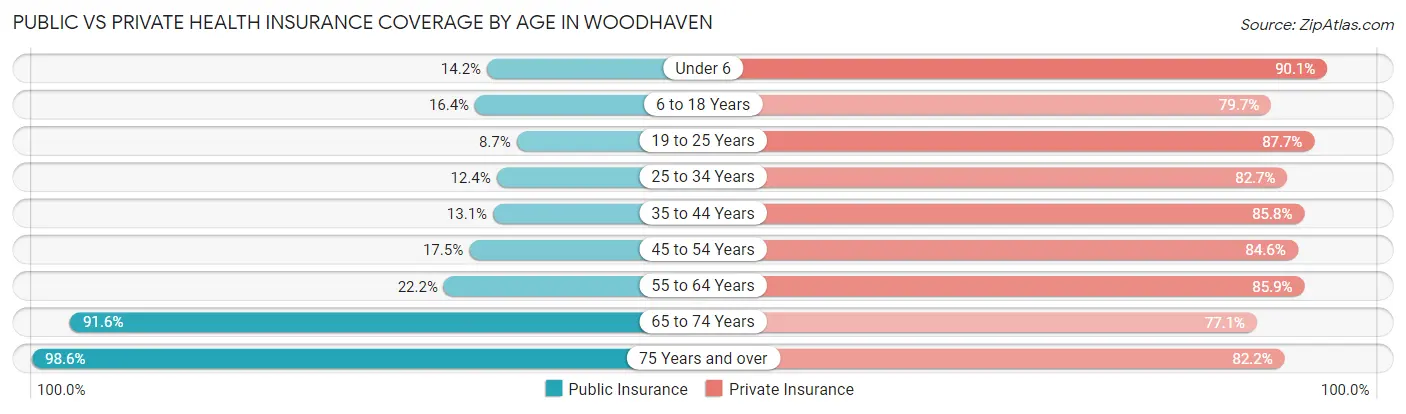
| Age Bracket | Public Insurance | Private Insurance |
| Under 6 | 106 (14.2%) | 673 (90.1%) |
| 6 to 18 Years | 303 (16.4%) | 1,471 (79.7%) |
| 19 to 25 Years | 62 (8.7%) | 626 (87.7%) |
| 25 to 34 Years | 187 (12.4%) | 1,246 (82.7%) |
| 35 to 44 Years | 192 (13.1%) | 1,260 (85.8%) |
| 45 to 54 Years | 288 (17.5%) | 1,391 (84.6%) |
| 55 to 64 Years | 369 (22.2%) | 1,427 (85.9%) |
| 65 to 74 Years | 1,835 (91.6%) | 1,544 (77.0%) |
| 75 Years and over | 1,117 (98.6%) | 931 (82.2%) |
| Total | 4,459 (35.0%) | 10,569 (83.1%) |
Disability Status by Sex by Age in Woodhaven
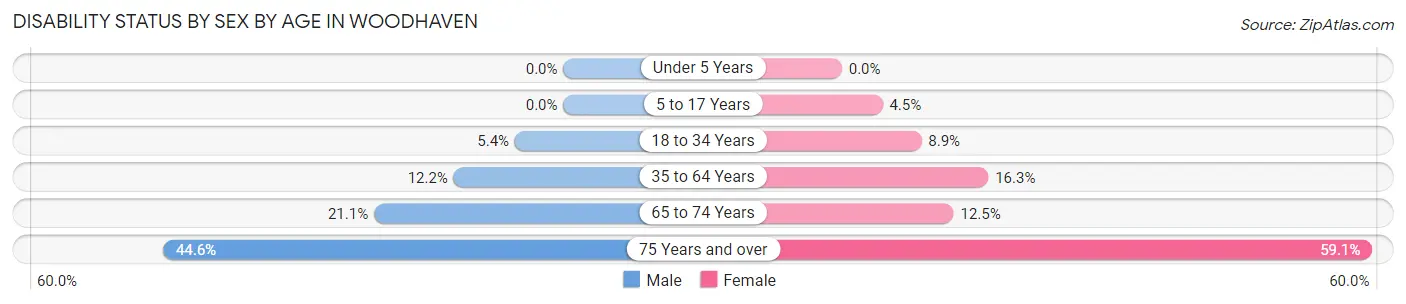
| Age Bracket | Male | Female |
| Under 5 Years | 0 (0.0%) | 0 (0.0%) |
| 5 to 17 Years | 0 (0.0%) | 47 (4.5%) |
| 18 to 34 Years | 65 (5.4%) | 103 (8.9%) |
| 35 to 64 Years | 273 (12.2%) | 414 (16.3%) |
| 65 to 74 Years | 194 (21.1%) | 135 (12.4%) |
| 75 Years and over | 198 (44.6%) | 407 (59.1%) |
Disability Class by Sex by Age in Woodhaven
Disability Class: Hearing Difficulty
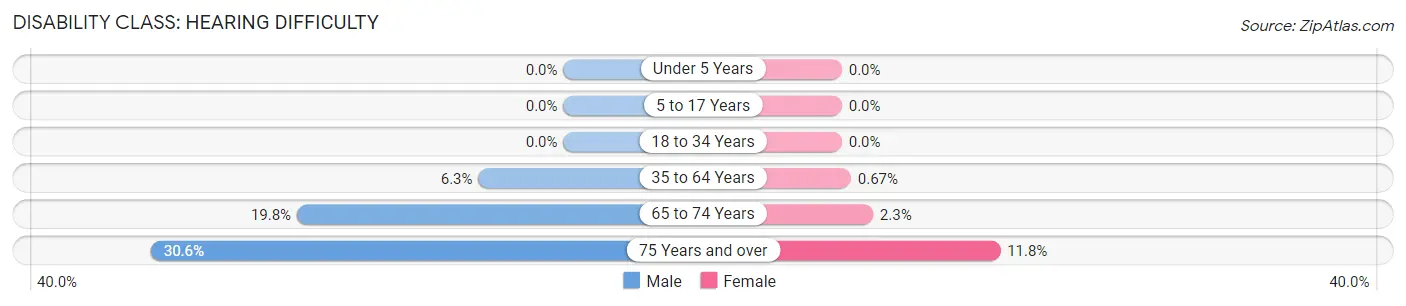
| Age Bracket | Male | Female |
| Under 5 Years | 0 (0.0%) | 0 (0.0%) |
| 5 to 17 Years | 0 (0.0%) | 0 (0.0%) |
| 18 to 34 Years | 0 (0.0%) | 0 (0.0%) |
| 35 to 64 Years | 141 (6.3%) | 17 (0.7%) |
| 65 to 74 Years | 182 (19.8%) | 25 (2.3%) |
| 75 Years and over | 136 (30.6%) | 81 (11.8%) |
Disability Class: Vision Difficulty
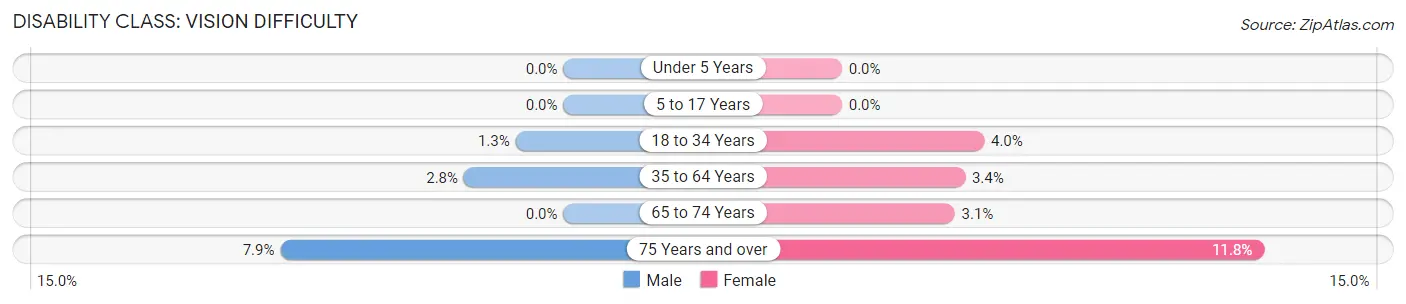
| Age Bracket | Male | Female |
| Under 5 Years | 0 (0.0%) | 0 (0.0%) |
| 5 to 17 Years | 0 (0.0%) | 0 (0.0%) |
| 18 to 34 Years | 16 (1.3%) | 46 (4.0%) |
| 35 to 64 Years | 62 (2.8%) | 87 (3.4%) |
| 65 to 74 Years | 0 (0.0%) | 34 (3.1%) |
| 75 Years and over | 35 (7.9%) | 81 (11.8%) |
Disability Class: Cognitive Difficulty
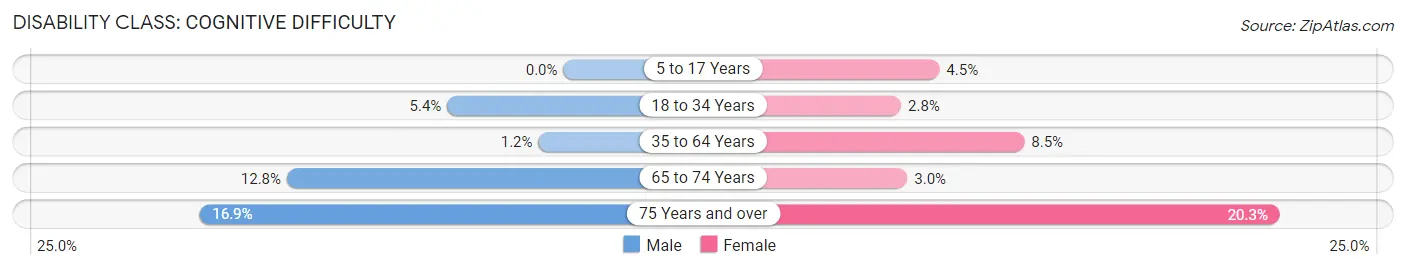
| Age Bracket | Male | Female |
| 5 to 17 Years | 0 (0.0%) | 47 (4.5%) |
| 18 to 34 Years | 65 (5.4%) | 32 (2.8%) |
| 35 to 64 Years | 26 (1.2%) | 215 (8.5%) |
| 65 to 74 Years | 118 (12.8%) | 33 (3.0%) |
| 75 Years and over | 75 (16.9%) | 140 (20.3%) |
Disability Class: Ambulatory Difficulty
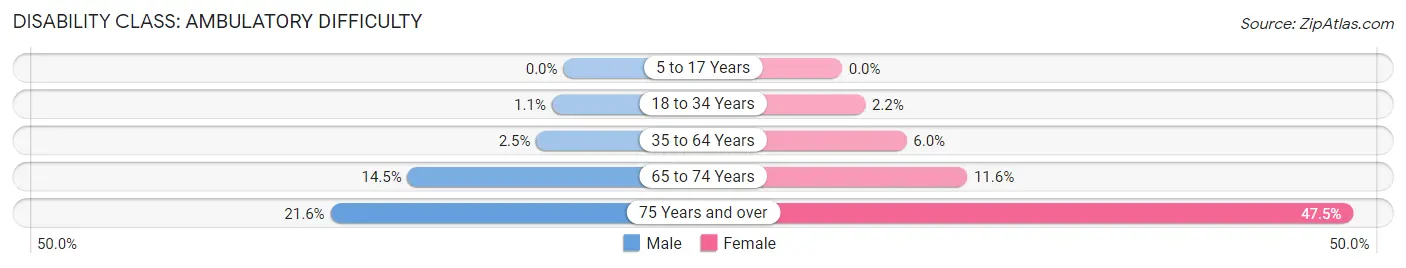
| Age Bracket | Male | Female |
| 5 to 17 Years | 0 (0.0%) | 0 (0.0%) |
| 18 to 34 Years | 13 (1.1%) | 25 (2.1%) |
| 35 to 64 Years | 56 (2.5%) | 152 (6.0%) |
| 65 to 74 Years | 133 (14.5%) | 126 (11.6%) |
| 75 Years and over | 96 (21.6%) | 327 (47.5%) |
Disability Class: Self-Care Difficulty
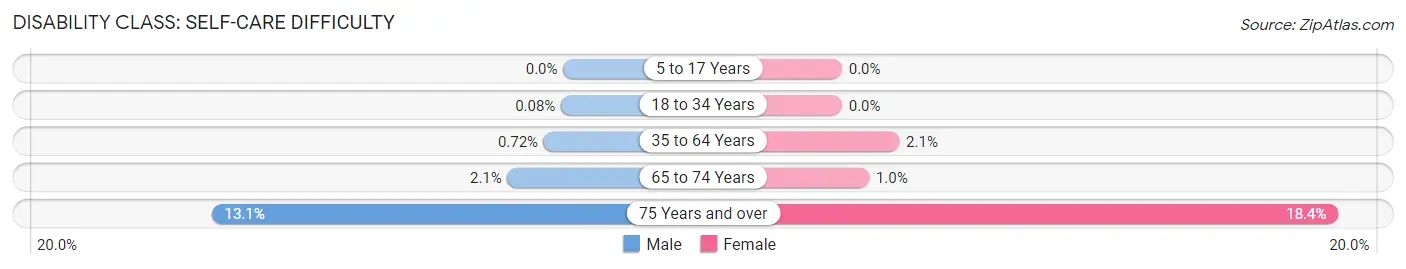
| Age Bracket | Male | Female |
| 5 to 17 Years | 0 (0.0%) | 0 (0.0%) |
| 18 to 34 Years | 1 (0.1%) | 0 (0.0%) |
| 35 to 64 Years | 16 (0.7%) | 54 (2.1%) |
| 65 to 74 Years | 19 (2.1%) | 11 (1.0%) |
| 75 Years and over | 58 (13.1%) | 127 (18.4%) |
Technology Access in Woodhaven
Computing Device Access in Woodhaven
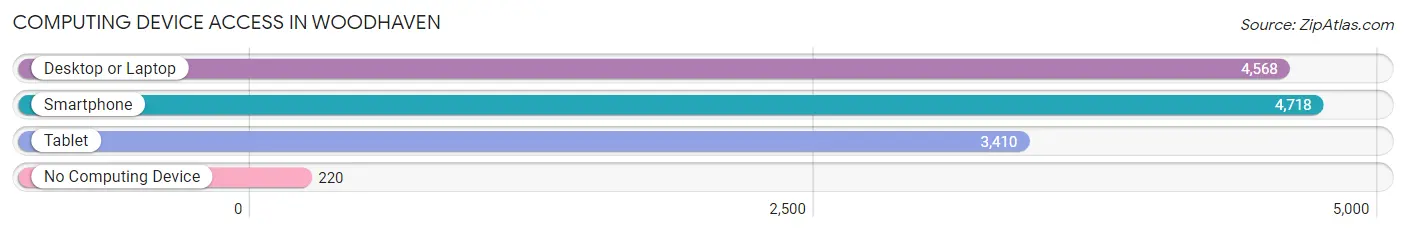
| Device Type | # Households | % Households |
| Desktop or Laptop | 4,568 | 85.5% |
| Smartphone | 4,718 | 88.3% |
| Tablet | 3,410 | 63.8% |
| No Computing Device | 220 | 4.1% |
| Total | 5,344 | 100.0% |
Internet Access in Woodhaven
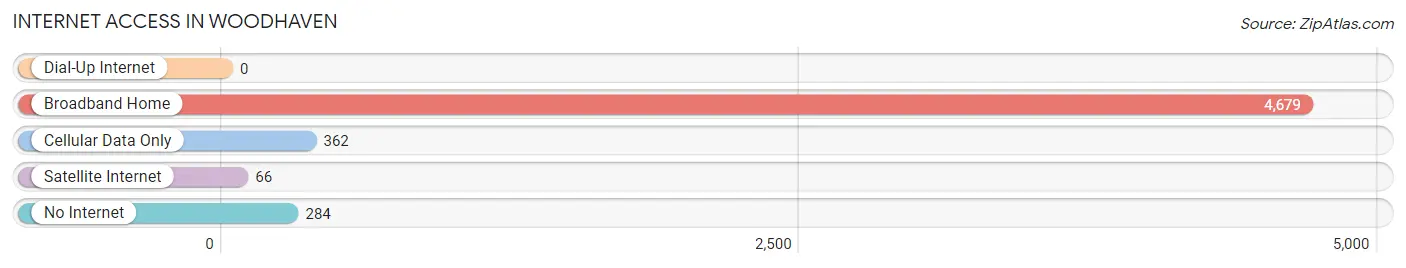
| Internet Type | # Households | % Households |
| Dial-Up Internet | 0 | 0.0% |
| Broadband Home | 4,679 | 87.6% |
| Cellular Data Only | 362 | 6.8% |
| Satellite Internet | 66 | 1.2% |
| No Internet | 284 | 5.3% |
| Total | 5,344 | 100.0% |
Woodhaven Summary
History
Woodhaven is a city located in Wayne County, Michigan. It is a suburb of Detroit and is part of the Downriver area. The city was first settled in 1835 by a group of settlers from New York. The city was originally known as Woodville, but the name was changed to Woodhaven in 1837. The city was incorporated in 1854.
Woodhaven has a rich history of industry and manufacturing. In the late 19th century, the city was home to several factories, including a paper mill, a sawmill, and a brickyard. The city was also home to a large number of farms, which provided food for the growing population.
In the early 20th century, the city experienced a period of growth and development. The city was home to several automobile factories, including the Ford Motor Company, which opened a plant in Woodhaven in 1918. The city also became home to several other industries, including a steel mill, a glass factory, and a furniture factory.
Geography
Woodhaven is located in southeastern Michigan, about 20 miles south of Detroit. The city is situated on the banks of the Ecorse River, which flows through the city. The city is bordered by the cities of Trenton to the north, Brownstown Township to the east, and Flat Rock to the south.
The city has a total area of 4.6 square miles, all of which is land. The terrain is mostly flat, with some rolling hills in the northern part of the city. The city has a humid continental climate, with hot, humid summers and cold, snowy winters.
Economy
Woodhaven’s economy is largely based on manufacturing and retail. The city is home to several large factories, including the Ford Motor Company, which employs over 1,000 people in the city. The city is also home to several retail stores, including a Walmart Supercenter, a Target, and a Meijer.
The city is also home to several small businesses, including restaurants, bars, and shops. The city is also home to several medical facilities, including a hospital and several clinics.
Demographics
As of the 2010 census, the population of Woodhaven was 11,842. The population is largely white (87.3%), with small percentages of African American (7.2%), Asian (2.2%), and Hispanic (1.7%) residents. The median household income is $50,945, and the median home value is $127,400.
The city is served by the Woodhaven-Brownstown School District, which includes four elementary schools, one middle school, and one high school. The city is also home to several private schools, including a Catholic school and a Montessori school.
Common Questions
What is the Total Population of Woodhaven?
Total Population of Woodhaven is 12,867.
What is the Total Male Population of Woodhaven?
Total Male Population of Woodhaven is 5,962.
What is the Total Female Population of Woodhaven?
Total Female Population of Woodhaven is 6,905.
What is the Ratio of Males per 100 Females in Woodhaven?
There are 86.34 Males per 100 Females in Woodhaven.
What is the Ratio of Females per 100 Males in Woodhaven?
There are 115.82 Females per 100 Males in Woodhaven.
What is the Median Population Age in Woodhaven?
Median Population Age in Woodhaven is 45.8 Years.
What is the Average Family Size in Woodhaven
Average Family Size in Woodhaven is 3.0 People.
What is the Average Household Size in Woodhaven
Average Household Size in Woodhaven is 2.4 People.
What is Per Capita Income in Woodhaven?
Per Capita income in Woodhaven is $38,013.
What is the Median Family Income in Woodhaven?
Median Family Income in Woodhaven is $96,667.
What is the Median Household income in Woodhaven?
Median Household Income in Woodhaven is $77,725.
What is Income or Wage Gap in Woodhaven?
Income or Wage Gap in Woodhaven is 31.8%.
Women in Woodhaven earn 68.2 cents for every dollar earned by a man.
What is Inequality or Gini Index in Woodhaven?
Inequality or Gini Index in Woodhaven is 0.36.
How Large is the Labor Force in Woodhaven?
There are 6,192 People in the Labor Forcein in Woodhaven.
What is the Percentage of People in the Labor Force in Woodhaven?
57.8% of People are in the Labor Force in Woodhaven.
What is the Unemployment Rate in Woodhaven?
Unemployment Rate in Woodhaven is 5.0%.