Lake Odessa, MI
Lake Odessa Map
Lake Odessa Overview
2,129
TOTAL POPULATION
1,008
MALE POPULATION
1,121
FEMALE POPULATION
89.92
MALES / 100 FEMALES
111.21
FEMALES / 100 MALES
36.0
MEDIAN AGE
3.4
AVG FAMILY SIZE
2.8
AVG HOUSEHOLD SIZE
$33,726
PER CAPITA INCOME
$83,177
AVG FAMILY INCOME
$66,397
AVG HOUSEHOLD INCOME
55.8%
WAGE / INCOME GAP [ % ]
44.2¢/ $1
WAGE / INCOME GAP [ $ ]
0.47
INEQUALITY / GINI INDEX
1,084
LABOR FORCE [ PEOPLE ]
63.8%
PERCENT IN LABOR FORCE
5.6%
UNEMPLOYMENT RATE
Lake Odessa Zip Codes
Lake Odessa Area Codes
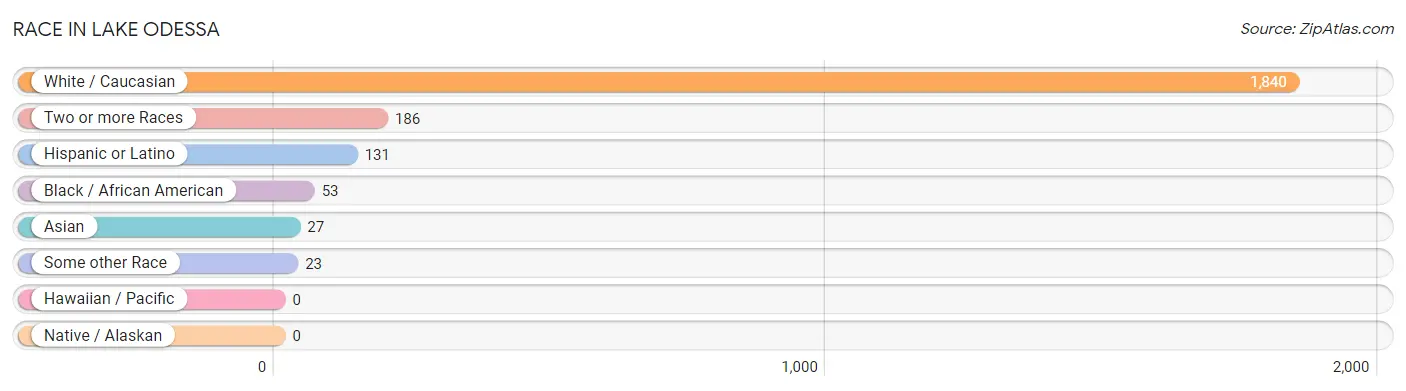
Race in Lake Odessa
The most populous races in Lake Odessa are White / Caucasian (1,840 | 86.4%), Two or more Races (186 | 8.7%), and Hispanic or Latino (131 | 6.1%).
| Race | # Population | % Population |
| Asian | 27 | 1.3% |
| Black / African American | 53 | 2.5% |
| Hawaiian / Pacific | 0 | 0.0% |
| Hispanic or Latino | 131 | 6.1% |
| Native / Alaskan | 0 | 0.0% |
| White / Caucasian | 1,840 | 86.4% |
| Two or more Races | 186 | 8.7% |
| Some other Race | 23 | 1.1% |
| Total | 2,129 | 100.0% |
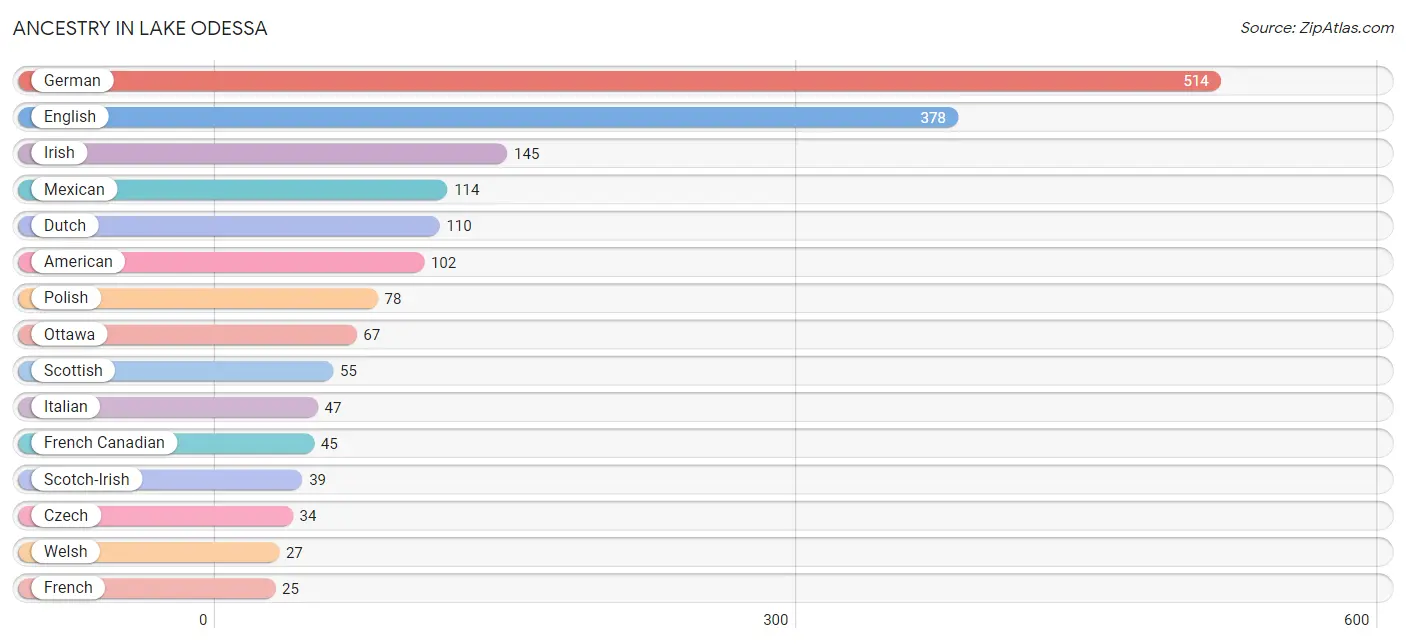
Ancestry in Lake Odessa
The most populous ancestries reported in Lake Odessa are German (514 | 24.1%), English (378 | 17.7%), Irish (145 | 6.8%), Mexican (114 | 5.3%), and Dutch (110 | 5.2%), together accounting for 59.2% of all Lake Odessa residents.
| Ancestry | # Population | % Population |
| American | 102 | 4.8% |
| Belgian | 5 | 0.2% |
| Bhutanese | 19 | 0.9% |
| British | 5 | 0.2% |
| Canadian | 10 | 0.5% |
| Central American Indian | 4 | 0.2% |
| Chippewa | 18 | 0.9% |
| Czech | 34 | 1.6% |
| Danish | 7 | 0.3% |
| Dutch | 110 | 5.2% |
| English | 378 | 17.7% |
| European | 12 | 0.6% |
| Filipino | 14 | 0.7% |
| Finnish | 4 | 0.2% |
| French | 25 | 1.2% |
| French Canadian | 45 | 2.1% |
| German | 514 | 24.1% |
| Greek | 5 | 0.2% |
| Hungarian | 5 | 0.2% |
| Irish | 145 | 6.8% |
| Italian | 47 | 2.2% |
| Korean | 19 | 0.9% |
| Mexican | 114 | 5.3% |
| Mexican American Indian | 4 | 0.2% |
| Northern European | 6 | 0.3% |
| Ottawa | 67 | 3.2% |
| Pennsylvania German | 5 | 0.2% |
| Polish | 78 | 3.7% |
| Portuguese | 5 | 0.2% |
| Puerto Rican | 13 | 0.6% |
| Scandinavian | 7 | 0.3% |
| Scotch-Irish | 39 | 1.8% |
| Scottish | 55 | 2.6% |
| Spaniard | 4 | 0.2% |
| Swiss | 6 | 0.3% |
| Thai | 13 | 0.6% |
| Welsh | 27 | 1.3% | View All 37 Rows |
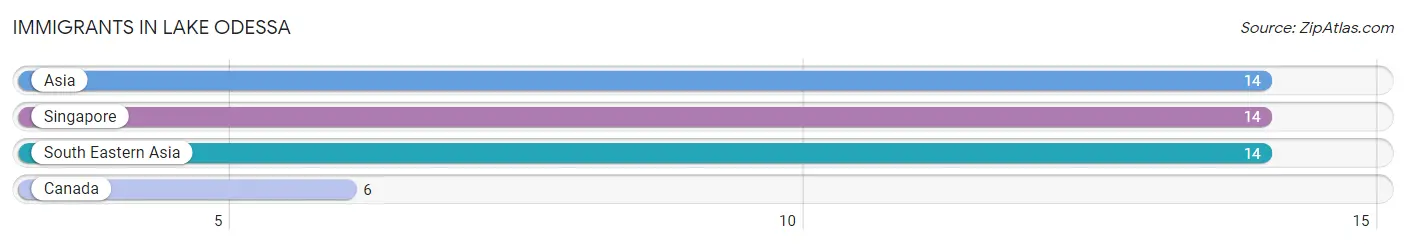
Immigrants in Lake Odessa
The most numerous immigrant groups reported in Lake Odessa came from Asia (14 | 0.7%), Singapore (14 | 0.7%), South Eastern Asia (14 | 0.7%), and Canada (6 | 0.3%), together accounting for 2.3% of all Lake Odessa residents.
| Immigration Origin | # Population | % Population |
| Asia | 14 | 0.7% |
| Canada | 6 | 0.3% |
| Singapore | 14 | 0.7% |
| South Eastern Asia | 14 | 0.7% | View All 4 Rows |
Sex and Age in Lake Odessa
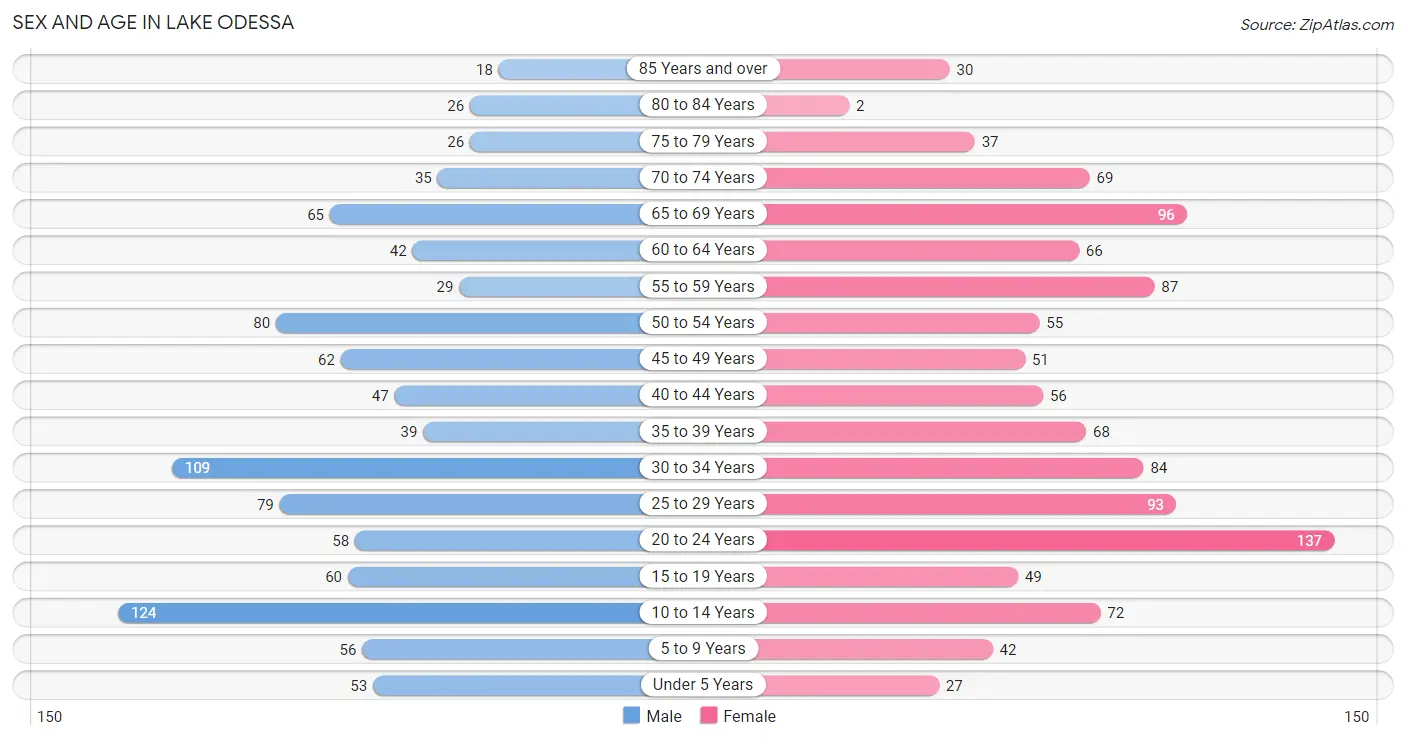
Sex and Age in Lake Odessa
The most populous age groups in Lake Odessa are 10 to 14 Years (124 | 12.3%) for men and 20 to 24 Years (137 | 12.2%) for women.
| Age Bracket | Male | Female |
| Under 5 Years | 53 (5.3%) | 27 (2.4%) |
| 5 to 9 Years | 56 (5.6%) | 42 (3.7%) |
| 10 to 14 Years | 124 (12.3%) | 72 (6.4%) |
| 15 to 19 Years | 60 (5.9%) | 49 (4.4%) |
| 20 to 24 Years | 58 (5.8%) | 137 (12.2%) |
| 25 to 29 Years | 79 (7.8%) | 93 (8.3%) |
| 30 to 34 Years | 109 (10.8%) | 84 (7.5%) |
| 35 to 39 Years | 39 (3.9%) | 68 (6.1%) |
| 40 to 44 Years | 47 (4.7%) | 56 (5.0%) |
| 45 to 49 Years | 62 (6.1%) | 51 (4.5%) |
| 50 to 54 Years | 80 (7.9%) | 55 (4.9%) |
| 55 to 59 Years | 29 (2.9%) | 87 (7.8%) |
| 60 to 64 Years | 42 (4.2%) | 66 (5.9%) |
| 65 to 69 Years | 65 (6.5%) | 96 (8.6%) |
| 70 to 74 Years | 35 (3.5%) | 69 (6.2%) |
| 75 to 79 Years | 26 (2.6%) | 37 (3.3%) |
| 80 to 84 Years | 26 (2.6%) | 2 (0.2%) |
| 85 Years and over | 18 (1.8%) | 30 (2.7%) |
| Total | 1,008 (100.0%) | 1,121 (100.0%) |
Families and Households in Lake Odessa
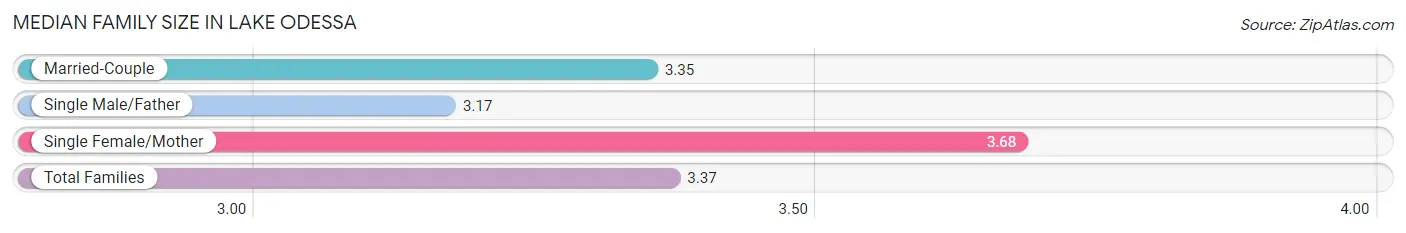
Median Family Size in Lake Odessa
The median family size in Lake Odessa is 3.37 persons per family, with single female/mother families (60 | 12.0%) accounting for the largest median family size of 3.68 persons per family. On the other hand, single male/father families (41 | 8.2%) represent the smallest median family size with 3.17 persons per family.
| Family Type | # Families | Family Size |
| Married-Couple | 397 (79.7%) | 3.35 |
| Single Male/Father | 41 (8.2%) | 3.17 |
| Single Female/Mother | 60 (12.0%) | 3.68 |
| Total Families | 498 (100.0%) | 3.37 |
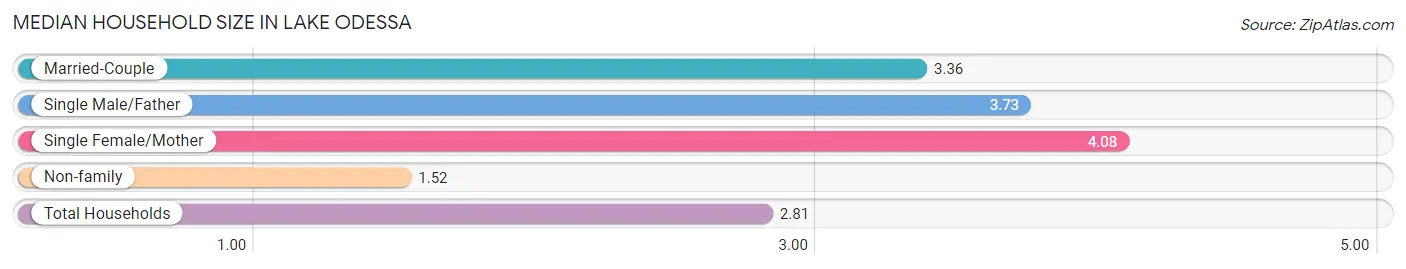
Median Household Size in Lake Odessa
The median household size in Lake Odessa is 2.81 persons per household, with single female/mother households (60 | 7.9%) accounting for the largest median household size of 4.08 persons per household. non-family households (259 | 34.2%) represent the smallest median household size with 1.52 persons per household.
| Household Type | # Households | Household Size |
| Married-Couple | 397 (52.4%) | 3.36 |
| Single Male/Father | 41 (5.4%) | 3.73 |
| Single Female/Mother | 60 (7.9%) | 4.08 |
| Non-family | 259 (34.2%) | 1.52 |
| Total Households | 757 (100.0%) | 2.81 |
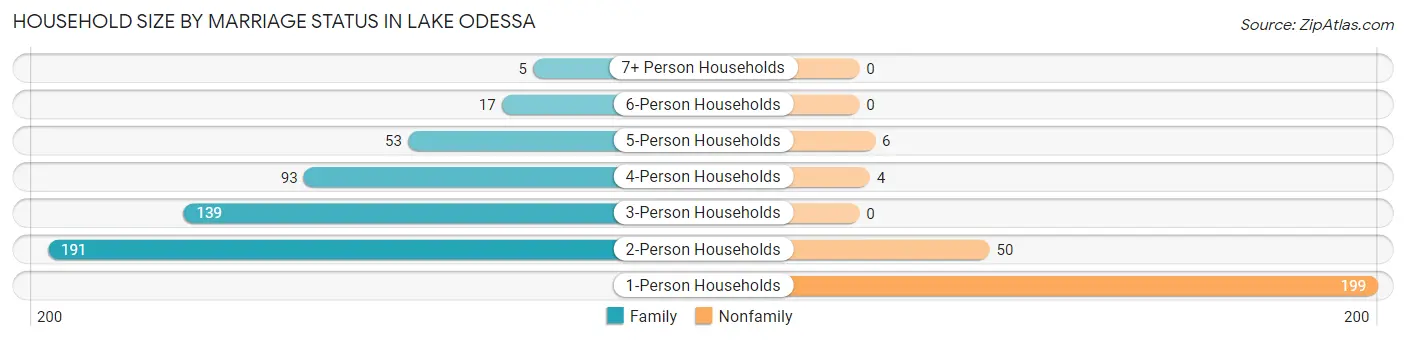
Household Size by Marriage Status in Lake Odessa
Out of a total of 757 households in Lake Odessa, 498 (65.8%) are family households, while 259 (34.2%) are nonfamily households. The most numerous type of family households are 2-person households, comprising 191, and the most common type of nonfamily households are 1-person households, comprising 199.
| Household Size | Family Households | Nonfamily Households |
| 1-Person Households | - | 199 (26.3%) |
| 2-Person Households | 191 (25.2%) | 50 (6.6%) |
| 3-Person Households | 139 (18.4%) | 0 (0.0%) |
| 4-Person Households | 93 (12.3%) | 4 (0.5%) |
| 5-Person Households | 53 (7.0%) | 6 (0.8%) |
| 6-Person Households | 17 (2.2%) | 0 (0.0%) |
| 7+ Person Households | 5 (0.7%) | 0 (0.0%) |
| Total | 498 (65.8%) | 259 (34.2%) |
Female Fertility in Lake Odessa
Fertility by Age in Lake Odessa
Average fertility rate in Lake Odessa is 26.0 births per 1,000 women. Women in the age bracket of 35 to 50 years have the highest fertility rate with 34.0 births per 1,000 women. Women in the age bracket of 20 to 34 years acount for 57.1% of all women with births.
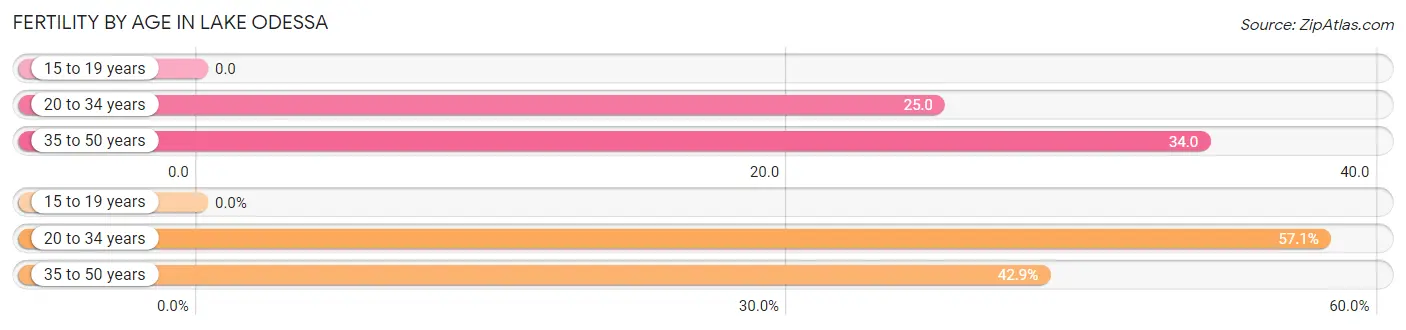
| Age Bracket | Women with Births | Births / 1,000 Women |
| 15 to 19 years | 0 (0.0%) | 0.0 |
| 20 to 34 years | 8 (57.1%) | 25.0 |
| 35 to 50 years | 6 (42.9%) | 34.0 |
| Total | 14 (100.0%) | 26.0 |
Fertility by Age by Marriage Status in Lake Odessa
28.6% of women with births (14) in Lake Odessa are married. The highest percentage of unmarried women with births falls into 35 to 50 years age bracket with 100.0% of them unmarried at the time of birth, while the lowest percentage of unmarried women with births belong to 20 to 34 years age bracket with 50.0% of them unmarried.
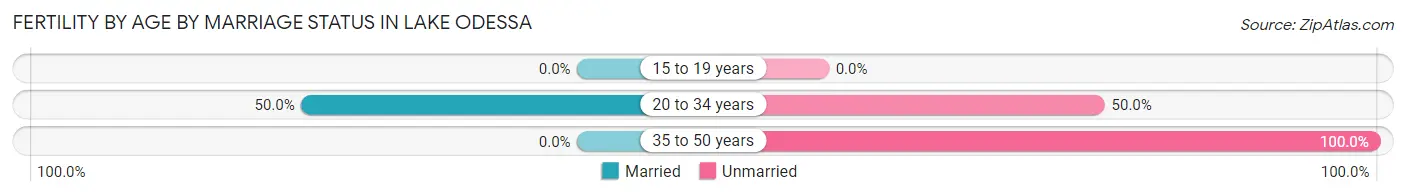
| Age Bracket | Married | Unmarried |
| 15 to 19 years | 0 (0.0%) | 0 (0.0%) |
| 20 to 34 years | 4 (50.0%) | 4 (50.0%) |
| 35 to 50 years | 0 (0.0%) | 6 (100.0%) |
| Total | 4 (28.6%) | 10 (71.4%) |
Fertility by Education in Lake Odessa
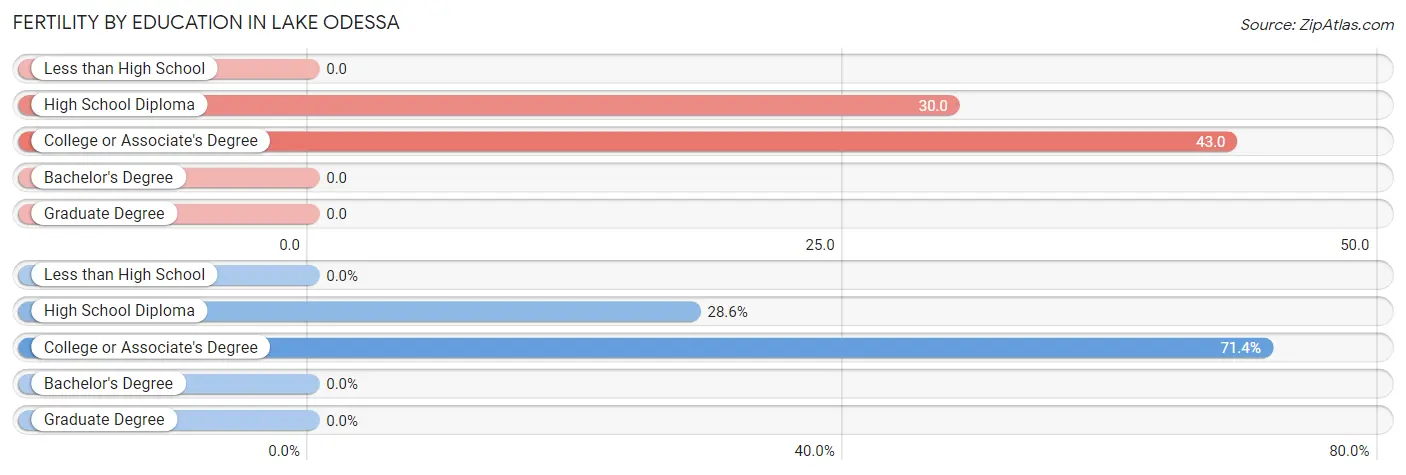
| Educational Attainment | Women with Births | Births / 1,000 Women |
| Less than High School | 0 (0.0%) | 0.0 |
| High School Diploma | 4 (28.6%) | 30.0 |
| College or Associate's Degree | 10 (71.4%) | 43.0 |
| Bachelor's Degree | 0 (0.0%) | 0.0 |
| Graduate Degree | 0 (0.0%) | 0.0 |
| Total | 14 (100.0%) | 26.0 |
Fertility by Education by Marriage Status in Lake Odessa
71.4% of women with births in Lake Odessa are unmarried. Women with the educational attainment of high school diploma are most likely to be married with 100.0% of them married at childbirth, while women with the educational attainment of college or associate's degree are least likely to be married with 100.0% of them unmarried at childbirth.
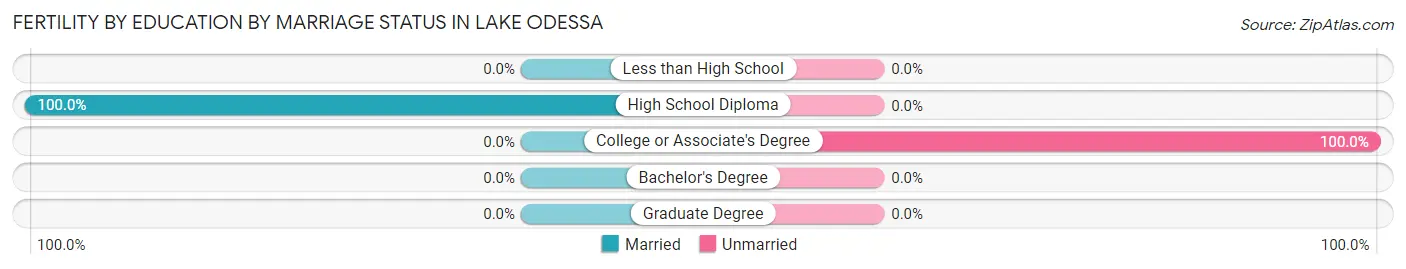
| Educational Attainment | Married | Unmarried |
| Less than High School | 0 (0.0%) | 0 (0.0%) |
| High School Diploma | 4 (100.0%) | 0 (0.0%) |
| College or Associate's Degree | 0 (0.0%) | 10 (100.0%) |
| Bachelor's Degree | 0 (0.0%) | 0 (0.0%) |
| Graduate Degree | 0 (0.0%) | 0 (0.0%) |
| Total | 4 (28.6%) | 10 (71.4%) |
Income in Lake Odessa
Income Overview in Lake Odessa
Per Capita Income in Lake Odessa is $33,726, while median incomes of families and households are $83,177 and $66,397 respectively.
| Characteristic | Number | Measure |
| Per Capita Income | 2,129 | $33,726 |
| Median Family Income | 498 | $83,177 |
| Mean Family Income | 498 | $99,298 |
| Median Household Income | 757 | $66,397 |
| Mean Household Income | 757 | $87,359 |
| Income Deficit | 498 | $0 |
| Wage / Income Gap (%) | 2,129 | 55.80% |
| Wage / Income Gap ($) | 2,129 | 44.20¢ per $1 |
| Gini / Inequality Index | 2,129 | 0.47 |
Earnings by Sex in Lake Odessa
Average Earnings in Lake Odessa are $42,188, $55,511 for men and $24,536 for women, a difference of 55.8%.
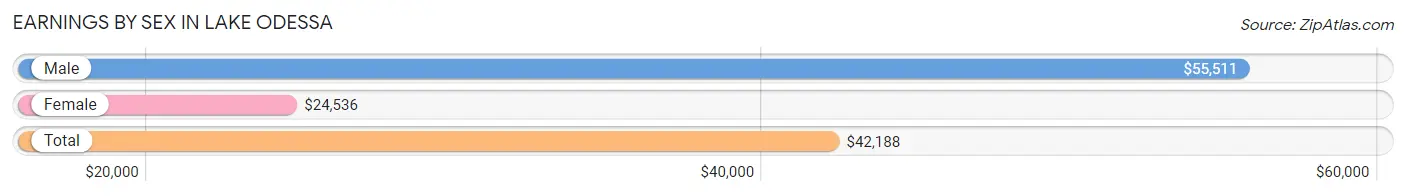
| Sex | Number | Average Earnings |
| Male | 503 (45.2%) | $55,511 |
| Female | 609 (54.8%) | $24,536 |
| Total | 1,112 (100.0%) | $42,188 |
Earnings by Sex by Income Bracket in Lake Odessa
The most common earnings brackets in Lake Odessa are $55,000 to $64,999 for men (101 | 20.1%) and $35,000 to $39,999 for women (64 | 10.5%).
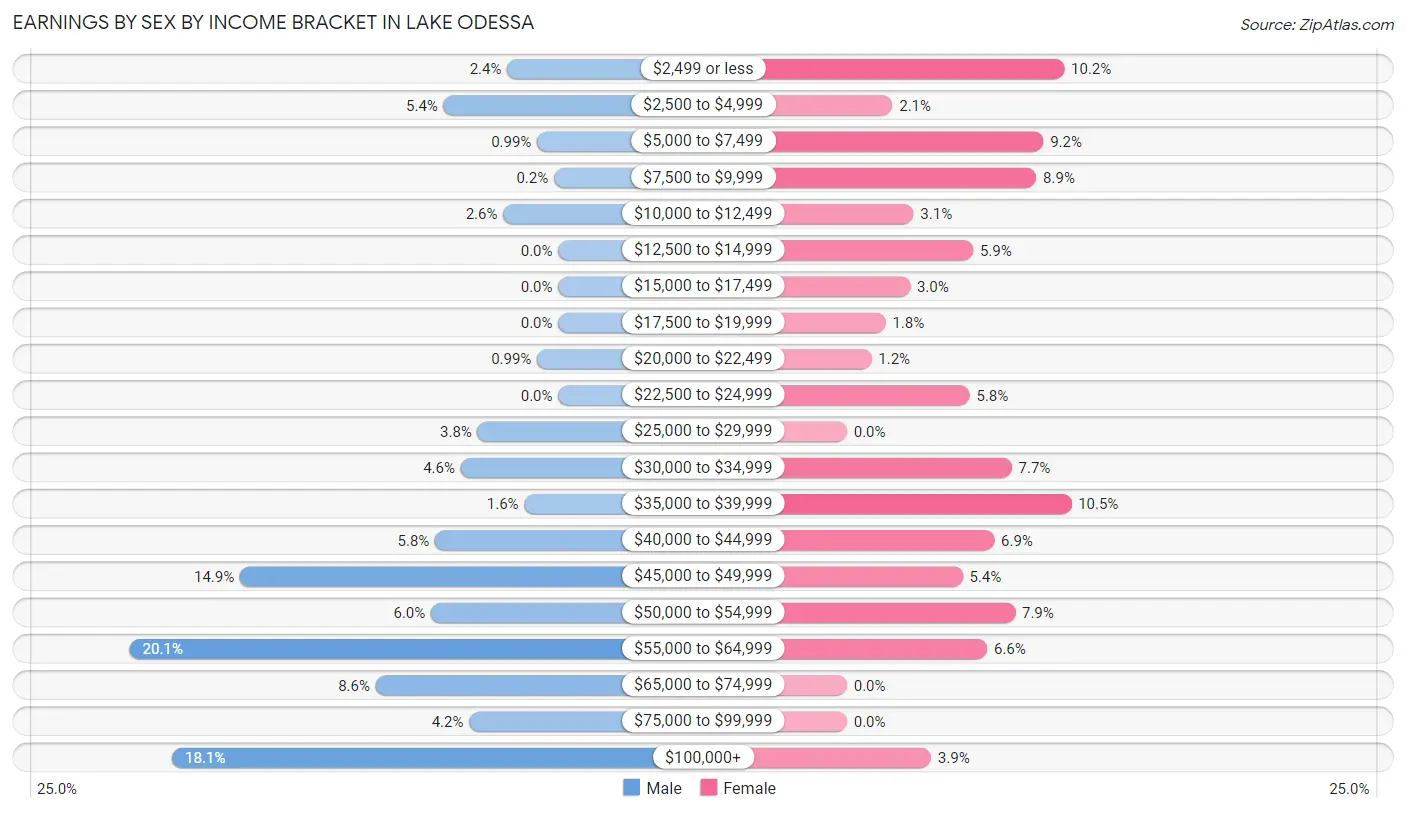
| Income | Male | Female |
| $2,499 or less | 12 (2.4%) | 62 (10.2%) |
| $2,500 to $4,999 | 27 (5.4%) | 13 (2.1%) |
| $5,000 to $7,499 | 5 (1.0%) | 56 (9.2%) |
| $7,500 to $9,999 | 1 (0.2%) | 54 (8.9%) |
| $10,000 to $12,499 | 13 (2.6%) | 19 (3.1%) |
| $12,500 to $14,999 | 0 (0.0%) | 36 (5.9%) |
| $15,000 to $17,499 | 0 (0.0%) | 18 (3.0%) |
| $17,500 to $19,999 | 0 (0.0%) | 11 (1.8%) |
| $20,000 to $22,499 | 5 (1.0%) | 7 (1.1%) |
| $22,500 to $24,999 | 0 (0.0%) | 35 (5.8%) |
| $25,000 to $29,999 | 19 (3.8%) | 0 (0.0%) |
| $30,000 to $34,999 | 23 (4.6%) | 47 (7.7%) |
| $35,000 to $39,999 | 8 (1.6%) | 64 (10.5%) |
| $40,000 to $44,999 | 29 (5.8%) | 42 (6.9%) |
| $45,000 to $49,999 | 75 (14.9%) | 33 (5.4%) |
| $50,000 to $54,999 | 30 (6.0%) | 48 (7.9%) |
| $55,000 to $64,999 | 101 (20.1%) | 40 (6.6%) |
| $65,000 to $74,999 | 43 (8.6%) | 0 (0.0%) |
| $75,000 to $99,999 | 21 (4.2%) | 0 (0.0%) |
| $100,000+ | 91 (18.1%) | 24 (3.9%) |
| Total | 503 (100.0%) | 609 (100.0%) |
Earnings by Sex by Educational Attainment in Lake Odessa
Average earnings in Lake Odessa are $58,137 for men and $34,508 for women, a difference of 40.6%. Men with an educational attainment of high school diploma enjoy the highest average annual earnings of $65,833, while those with bachelor's degree education earn the least with $51,063. Women with an educational attainment of graduate degree earn the most with the average annual earnings of $35,066, while those with college or associate's degree education have the smallest earnings of $34,732.
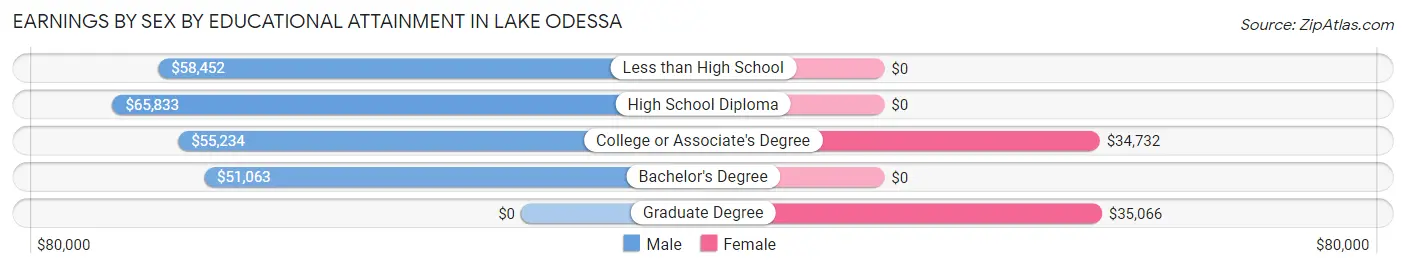
| Educational Attainment | Male Income | Female Income |
| Less than High School | $58,452 | $0 |
| High School Diploma | $65,833 | $0 |
| College or Associate's Degree | $55,234 | $34,732 |
| Bachelor's Degree | $51,063 | $0 |
| Graduate Degree | - | - |
| Total | $58,137 | $34,508 |
Family Income in Lake Odessa
Family Income Brackets in Lake Odessa
According to the Lake Odessa family income data, there are 117 families falling into the $75,000 to $99,999 income range, which is the most common income bracket and makes up 23.5% of all families. Conversely, the $10,000 to $14,999 income bracket is the least frequent group with only 10 families (2.0%) belonging to this category.
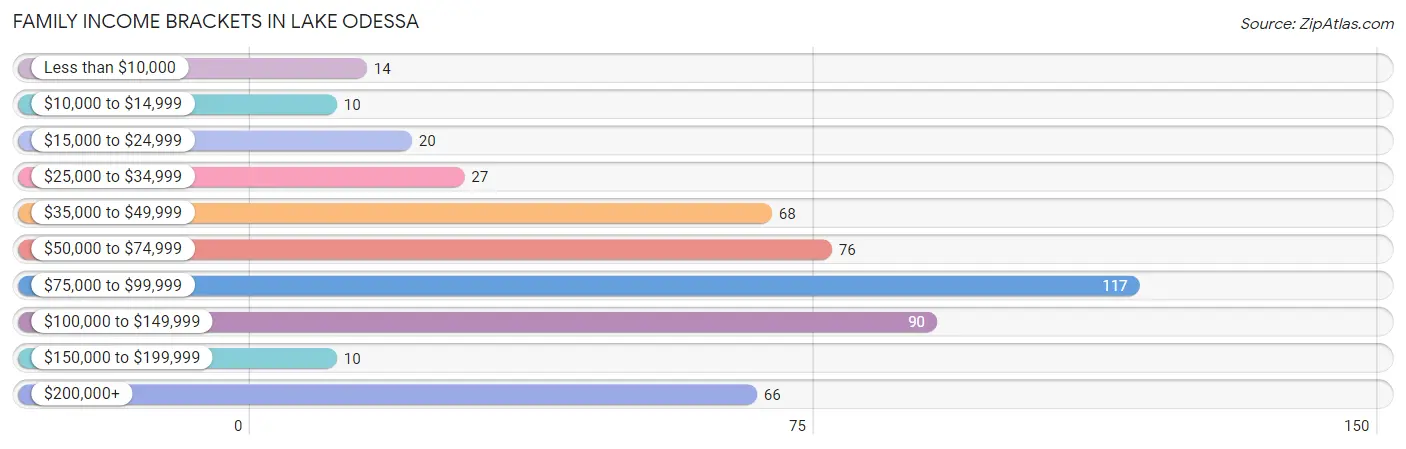
| Income Bracket | # Families | % Families |
| Less than $10,000 | 14 | 2.8% |
| $10,000 to $14,999 | 10 | 2.0% |
| $15,000 to $24,999 | 20 | 4.0% |
| $25,000 to $34,999 | 27 | 5.4% |
| $35,000 to $49,999 | 68 | 13.7% |
| $50,000 to $74,999 | 76 | 15.3% |
| $75,000 to $99,999 | 117 | 23.5% |
| $100,000 to $149,999 | 90 | 18.1% |
| $150,000 to $199,999 | 10 | 2.0% |
| $200,000+ | 66 | 13.3% |
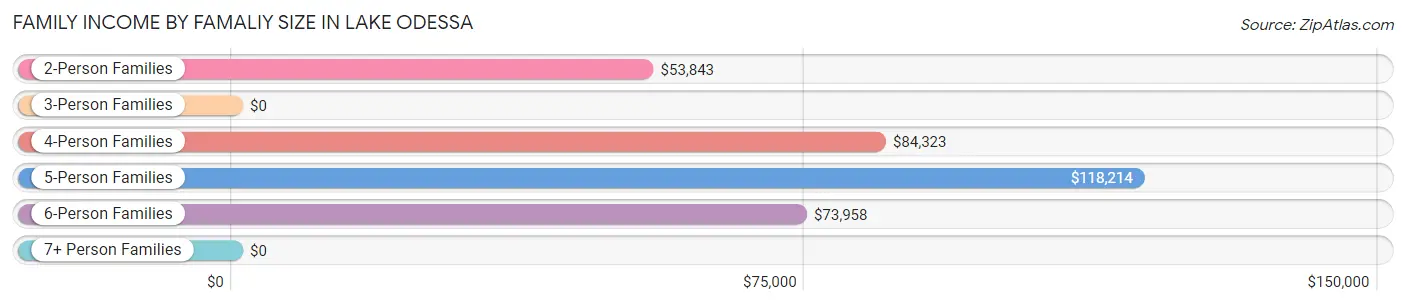
Family Income by Famaliy Size in Lake Odessa
5-person families (52 | 10.4%) account for the highest median family income in Lake Odessa with $118,214 per family, while 2-person families (211 | 42.4%) have the highest median income of $26,922 per family member.
| Income Bracket | # Families | Median Income |
| 2-Person Families | 211 (42.4%) | $53,843 |
| 3-Person Families | 129 (25.9%) | $0 |
| 4-Person Families | 89 (17.9%) | $84,323 |
| 5-Person Families | 52 (10.4%) | $118,214 |
| 6-Person Families | 17 (3.4%) | $73,958 |
| 7+ Person Families | 0 (0.0%) | $0 |
| Total | 498 (100.0%) | $83,177 |
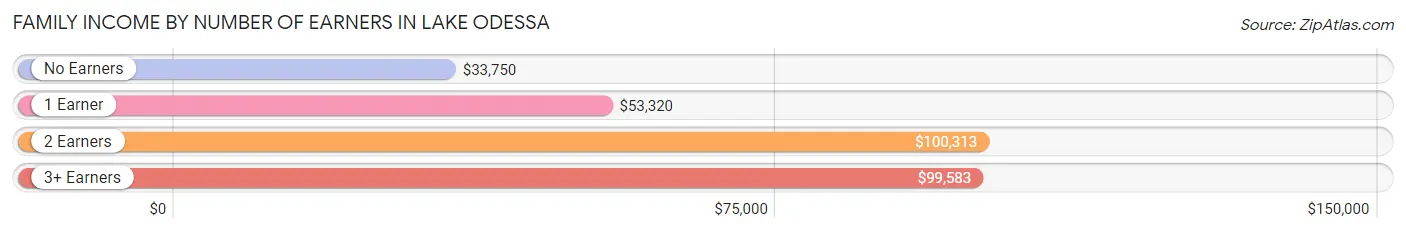
Family Income by Number of Earners in Lake Odessa
The median family income in Lake Odessa is $83,177, with families comprising 2 earners (222) having the highest median family income of $100,313, while families with no earners (73) have the lowest median family income of $33,750, accounting for 44.6% and 14.7% of families, respectively.
| Number of Earners | # Families | Median Income |
| No Earners | 73 (14.7%) | $33,750 |
| 1 Earner | 135 (27.1%) | $53,320 |
| 2 Earners | 222 (44.6%) | $100,313 |
| 3+ Earners | 68 (13.7%) | $99,583 |
| Total | 498 (100.0%) | $83,177 |
Household Income in Lake Odessa
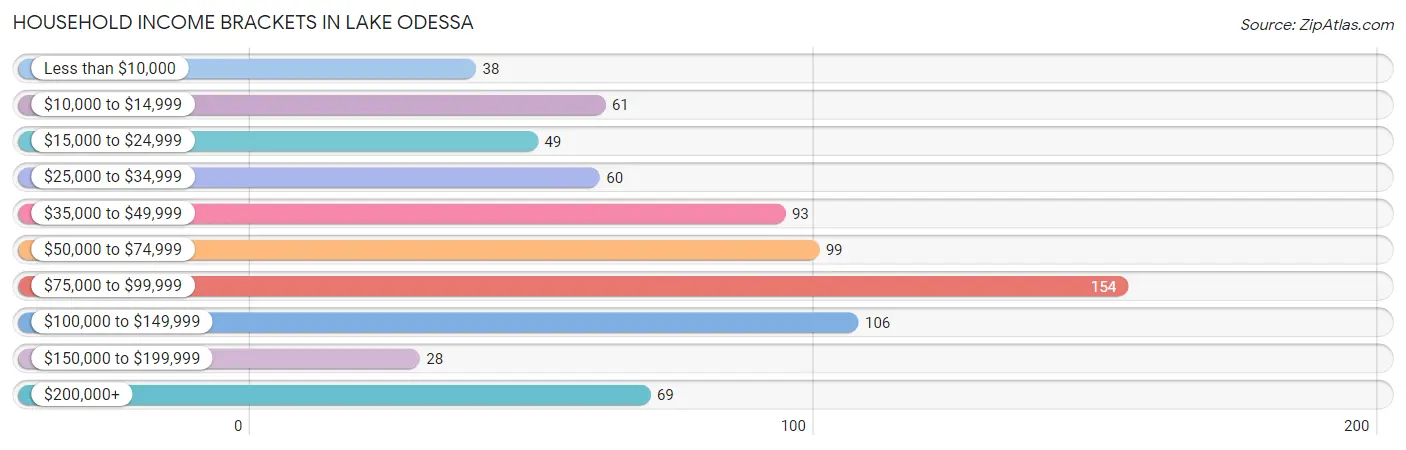
Household Income Brackets in Lake Odessa
With 154 households falling in the category, the $75,000 to $99,999 income range is the most frequent in Lake Odessa, accounting for 20.3% of all households. In contrast, only 28 households (3.7%) fall into the $150,000 to $199,999 income bracket, making it the least populous group.
| Income Bracket | # Households | % Households |
| Less than $10,000 | 38 | 5.0% |
| $10,000 to $14,999 | 61 | 8.1% |
| $15,000 to $24,999 | 49 | 6.5% |
| $25,000 to $34,999 | 60 | 7.9% |
| $35,000 to $49,999 | 93 | 12.3% |
| $50,000 to $74,999 | 99 | 13.1% |
| $75,000 to $99,999 | 154 | 20.3% |
| $100,000 to $149,999 | 106 | 14.0% |
| $150,000 to $199,999 | 28 | 3.7% |
| $200,000+ | 69 | 9.1% |
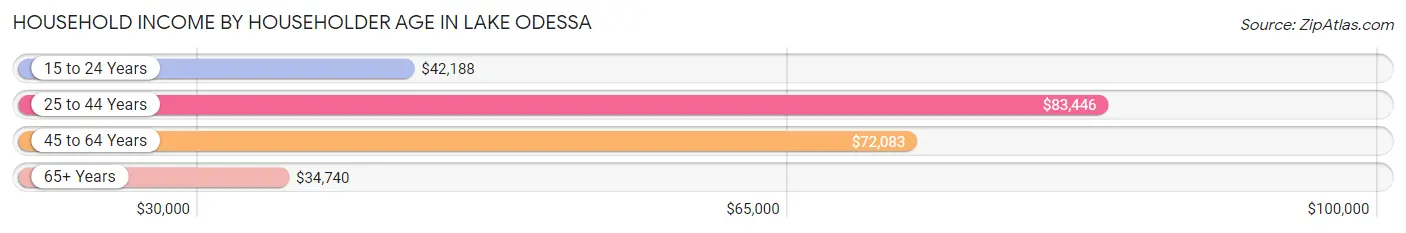
Household Income by Householder Age in Lake Odessa
The median household income in Lake Odessa is $66,397, with the highest median household income of $83,446 found in the 25 to 44 years age bracket for the primary householder. A total of 220 households (29.1%) fall into this category. Meanwhile, the 65+ years age bracket for the primary householder has the lowest median household income of $34,740, with 187 households (24.7%) in this group.
| Income Bracket | # Households | Median Income |
| 15 to 24 Years | 17 (2.2%) | $42,188 |
| 25 to 44 Years | 220 (29.1%) | $83,446 |
| 45 to 64 Years | 333 (44.0%) | $72,083 |
| 65+ Years | 187 (24.7%) | $34,740 |
| Total | 757 (100.0%) | $66,397 |
Poverty in Lake Odessa
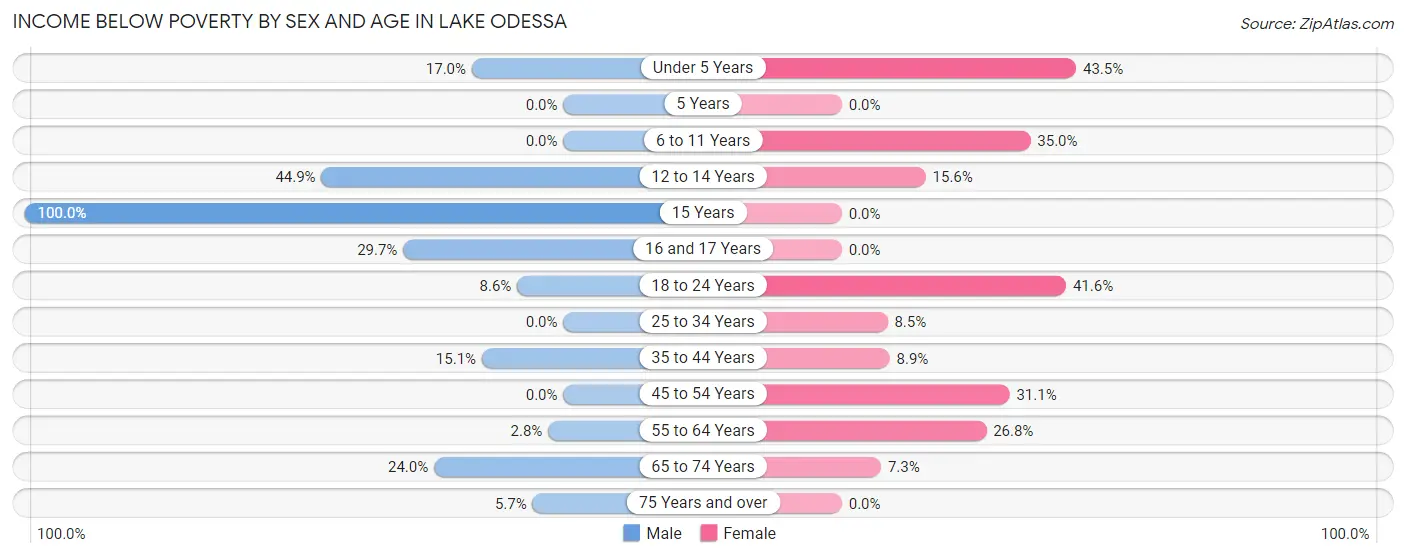
Income Below Poverty by Sex and Age in Lake Odessa
With 10.3% poverty level for males and 17.9% for females among the residents of Lake Odessa, 15 year old males and under 5 year old females are the most vulnerable to poverty, with 11 males (100.0%) and 10 females (43.5%) in their respective age groups living below the poverty level.
| Age Bracket | Male | Female |
| Under 5 Years | 9 (17.0%) | 10 (43.5%) |
| 5 Years | 0 (0.0%) | 0 (0.0%) |
| 6 to 11 Years | 0 (0.0%) | 14 (35.0%) |
| 12 to 14 Years | 22 (44.9%) | 7 (15.6%) |
| 15 Years | 11 (100.0%) | 0 (0.0%) |
| 16 and 17 Years | 11 (29.7%) | 0 (0.0%) |
| 18 to 24 Years | 6 (8.6%) | 57 (41.6%) |
| 25 to 34 Years | 0 (0.0%) | 15 (8.5%) |
| 35 to 44 Years | 13 (15.1%) | 11 (8.9%) |
| 45 to 54 Years | 0 (0.0%) | 33 (31.1%) |
| 55 to 64 Years | 2 (2.8%) | 41 (26.8%) |
| 65 to 74 Years | 24 (24.0%) | 12 (7.3%) |
| 75 Years and over | 4 (5.7%) | 0 (0.0%) |
| Total | 102 (10.3%) | 200 (17.9%) |
Income Above Poverty by Sex and Age in Lake Odessa
According to the poverty statistics in Lake Odessa, males aged 5 years and females aged 5 years are the age groups that are most secure financially, with 100.0% of males and 100.0% of females in these age groups living above the poverty line.
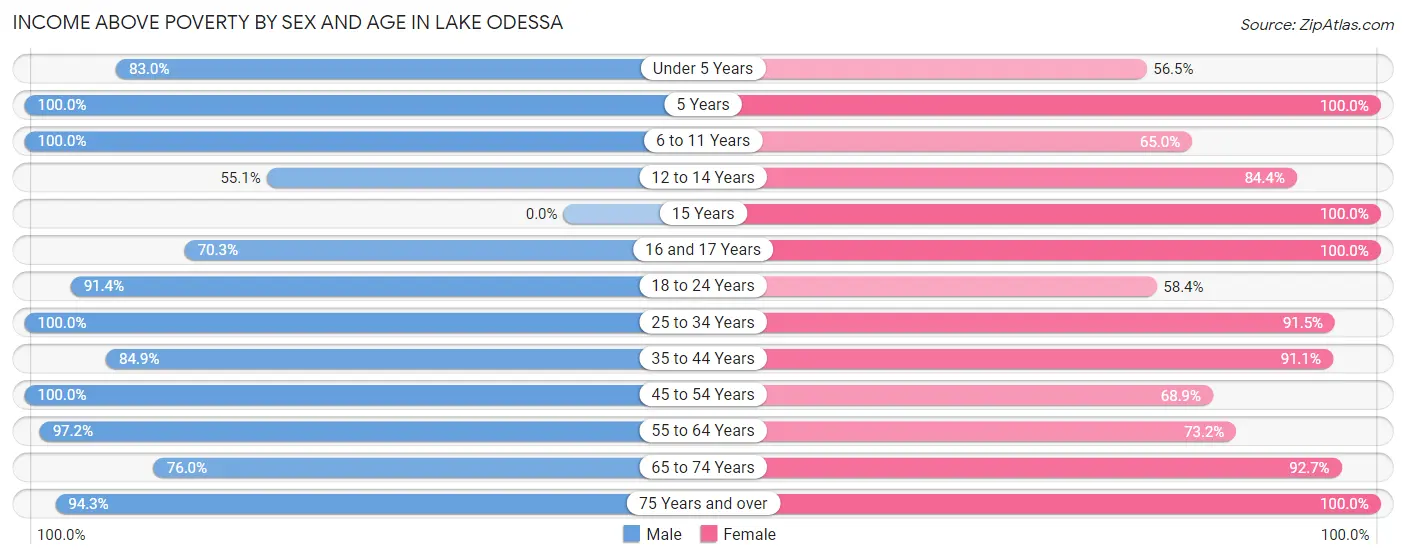
| Age Bracket | Male | Female |
| Under 5 Years | 44 (83.0%) | 13 (56.5%) |
| 5 Years | 23 (100.0%) | 29 (100.0%) |
| 6 to 11 Years | 89 (100.0%) | 26 (65.0%) |
| 12 to 14 Years | 27 (55.1%) | 38 (84.4%) |
| 15 Years | 0 (0.0%) | 45 (100.0%) |
| 16 and 17 Years | 26 (70.3%) | 4 (100.0%) |
| 18 to 24 Years | 64 (91.4%) | 80 (58.4%) |
| 25 to 34 Years | 188 (100.0%) | 162 (91.5%) |
| 35 to 44 Years | 73 (84.9%) | 113 (91.1%) |
| 45 to 54 Years | 142 (100.0%) | 73 (68.9%) |
| 55 to 64 Years | 69 (97.2%) | 112 (73.2%) |
| 65 to 74 Years | 76 (76.0%) | 153 (92.7%) |
| 75 Years and over | 66 (94.3%) | 69 (100.0%) |
| Total | 887 (89.7%) | 917 (82.1%) |
Income Below Poverty Among Married-Couple Families in Lake Odessa
The poverty statistics for married-couple families in Lake Odessa show that 2.5% or 10 of the total 397 families live below the poverty line. Families with 3 or 4 children have the highest poverty rate of 38.5%, comprising of 10 families. On the other hand, families with no children have the lowest poverty rate of 0.0%, which includes 0 families.
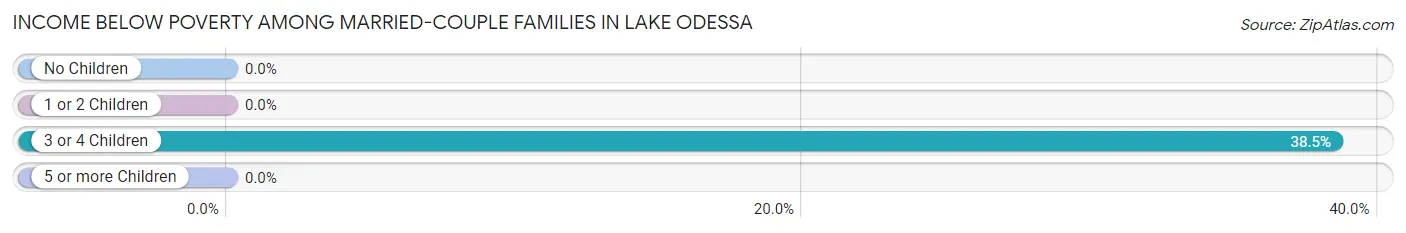
| Children | Above Poverty | Below Poverty |
| No Children | 155 (100.0%) | 0 (0.0%) |
| 1 or 2 Children | 216 (100.0%) | 0 (0.0%) |
| 3 or 4 Children | 16 (61.5%) | 10 (38.5%) |
| 5 or more Children | 0 (0.0%) | 0 (0.0%) |
| Total | 387 (97.5%) | 10 (2.5%) |
Income Below Poverty Among Single-Parent Households in Lake Odessa
According to the poverty data in Lake Odessa, 12.2% or 5 single-father households and 48.3% or 29 single-mother households are living below the poverty line. Among single-father households, those with 1 or 2 children have the highest poverty rate, with 5 households (25.0%) experiencing poverty. Likewise, among single-mother households, those with 3 or 4 children have the highest poverty rate, with 5 households (100.0%) falling below the poverty line.
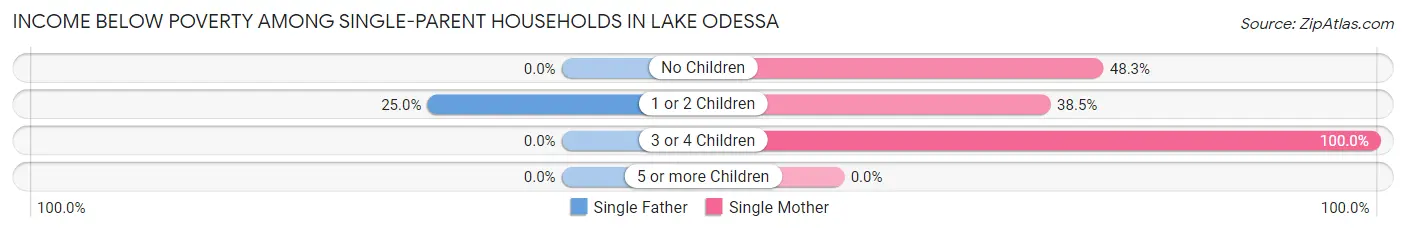
| Children | Single Father | Single Mother |
| No Children | 0 (0.0%) | 14 (48.3%) |
| 1 or 2 Children | 5 (25.0%) | 10 (38.5%) |
| 3 or 4 Children | 0 (0.0%) | 5 (100.0%) |
| 5 or more Children | 0 (0.0%) | 0 (0.0%) |
| Total | 5 (12.2%) | 29 (48.3%) |
Income Below Poverty Among Married-Couple vs Single-Parent Households in Lake Odessa
The poverty data for Lake Odessa shows that 10 of the married-couple family households (2.5%) and 34 of the single-parent households (33.7%) are living below the poverty level. Within the married-couple family households, those with 3 or 4 children have the highest poverty rate, with 10 households (38.5%) falling below the poverty line. Among the single-parent households, those with 3 or 4 children have the highest poverty rate, with 5 household (50.0%) living below poverty.
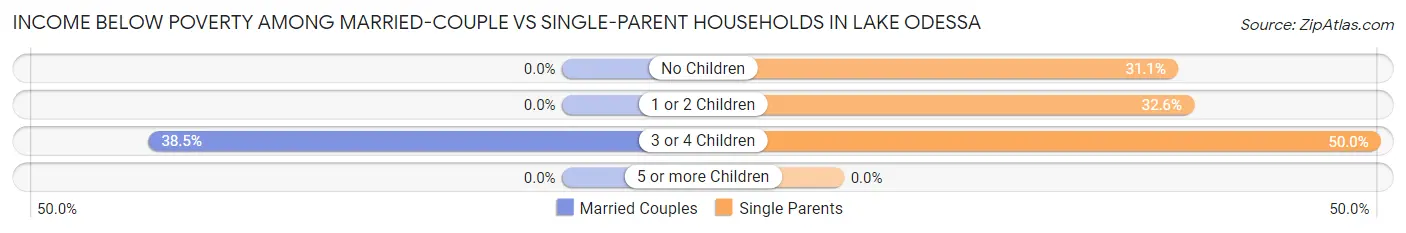
| Children | Married-Couple Families | Single-Parent Households |
| No Children | 0 (0.0%) | 14 (31.1%) |
| 1 or 2 Children | 0 (0.0%) | 15 (32.6%) |
| 3 or 4 Children | 10 (38.5%) | 5 (50.0%) |
| 5 or more Children | 0 (0.0%) | 0 (0.0%) |
| Total | 10 (2.5%) | 34 (33.7%) |
Employment Characteristics in Lake Odessa
Employment by Class of Employer in Lake Odessa
Among the 1,005 employed individuals in Lake Odessa, private company employees (762 | 75.8%), state government employees (64 | 6.4%), and local government employees (50 | 5.0%) make up the most common classes of employment.
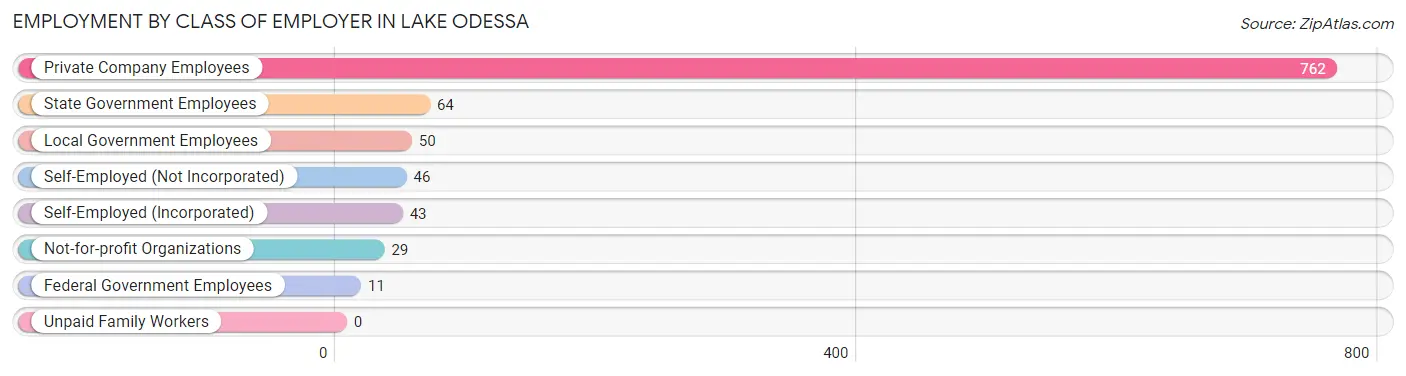
| Employer Class | # Employees | % Employees |
| Private Company Employees | 762 | 75.8% |
| Self-Employed (Incorporated) | 43 | 4.3% |
| Self-Employed (Not Incorporated) | 46 | 4.6% |
| Not-for-profit Organizations | 29 | 2.9% |
| Local Government Employees | 50 | 5.0% |
| State Government Employees | 64 | 6.4% |
| Federal Government Employees | 11 | 1.1% |
| Unpaid Family Workers | 0 | 0.0% |
| Total | 1,005 | 100.0% |
Employment Status by Age in Lake Odessa
According to the labor force statistics for Lake Odessa, out of the total population over 16 years of age (1,699), 63.8% or 1,084 individuals are in the labor force, with 5.6% or 61 of them unemployed. The age group with the highest labor force participation rate is 25 to 29 years, with 100.0% or 172 individuals in the labor force. Within the labor force, the 35 to 44 years age range has the highest percentage of unemployed individuals, with 15.8% or 28 of them being unemployed.
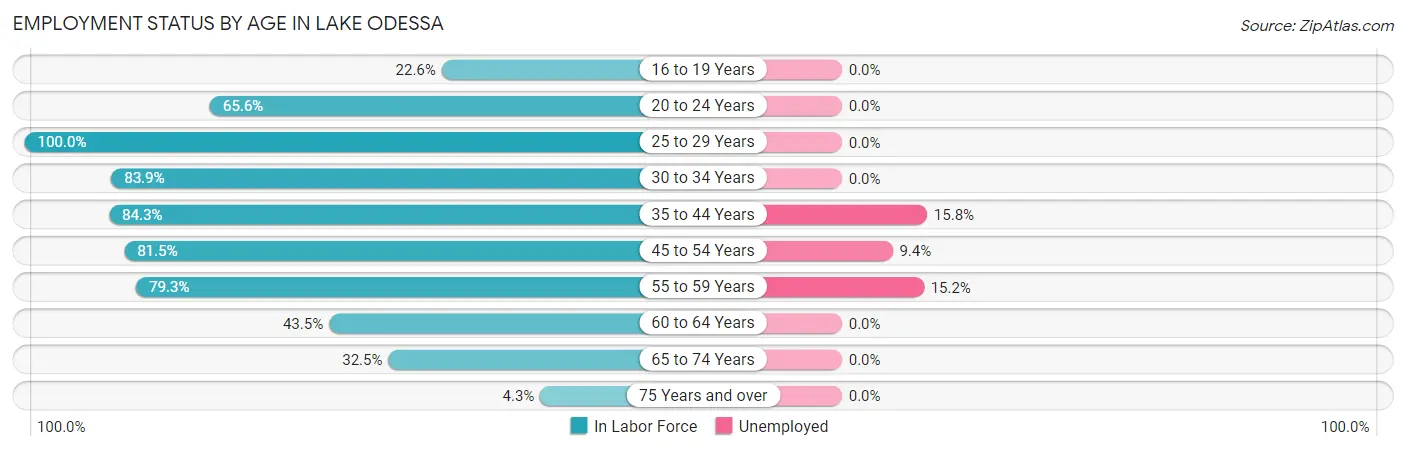
| Age Bracket | In Labor Force | Unemployed |
| 16 to 19 Years | 12 (22.6%) | 0 (0.0%) |
| 20 to 24 Years | 128 (65.6%) | 0 (0.0%) |
| 25 to 29 Years | 172 (100.0%) | 0 (0.0%) |
| 30 to 34 Years | 162 (83.9%) | 0 (0.0%) |
| 35 to 44 Years | 177 (84.3%) | 28 (15.8%) |
| 45 to 54 Years | 202 (81.5%) | 19 (9.4%) |
| 55 to 59 Years | 92 (79.3%) | 14 (15.2%) |
| 60 to 64 Years | 47 (43.5%) | 0 (0.0%) |
| 65 to 74 Years | 86 (32.5%) | 0 (0.0%) |
| 75 Years and over | 6 (4.3%) | 0 (0.0%) |
| Total | 1,084 (63.8%) | 61 (5.6%) |
Employment Status by Educational Attainment in Lake Odessa
According to labor force statistics for Lake Odessa, 81.4% of individuals (852) out of the total population between 25 and 64 years of age (1,047) are in the labor force, with 7.2% or 61 of them being unemployed. The group with the highest labor force participation rate are those with the educational attainment of bachelor's degree or higher, with 93.3% or 154 individuals in the labor force. Within the labor force, individuals with less than high school education have the highest percentage of unemployment, with 14.7% or 10 of them being unemployed.
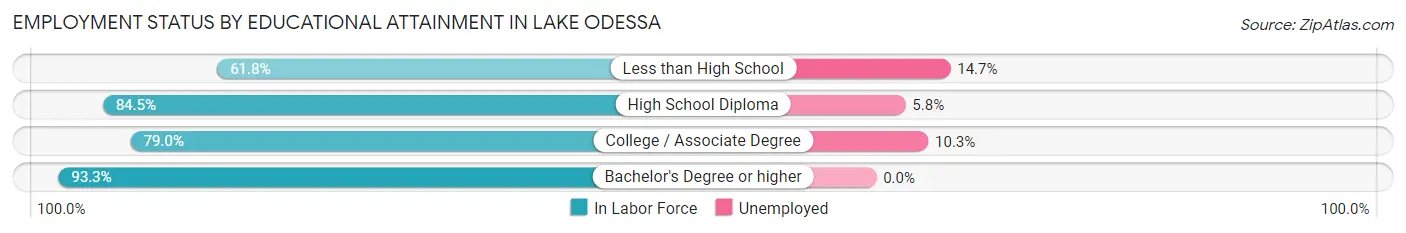
| Educational Attainment | In Labor Force | Unemployed |
| Less than High School | 68 (61.8%) | 16 (14.7%) |
| High School Diploma | 310 (84.5%) | 21 (5.8%) |
| College / Associate Degree | 320 (79.0%) | 42 (10.3%) |
| Bachelor's Degree or higher | 154 (93.3%) | 0 (0.0%) |
| Total | 852 (81.4%) | 75 (7.2%) |
Employment Occupations by Sex in Lake Odessa
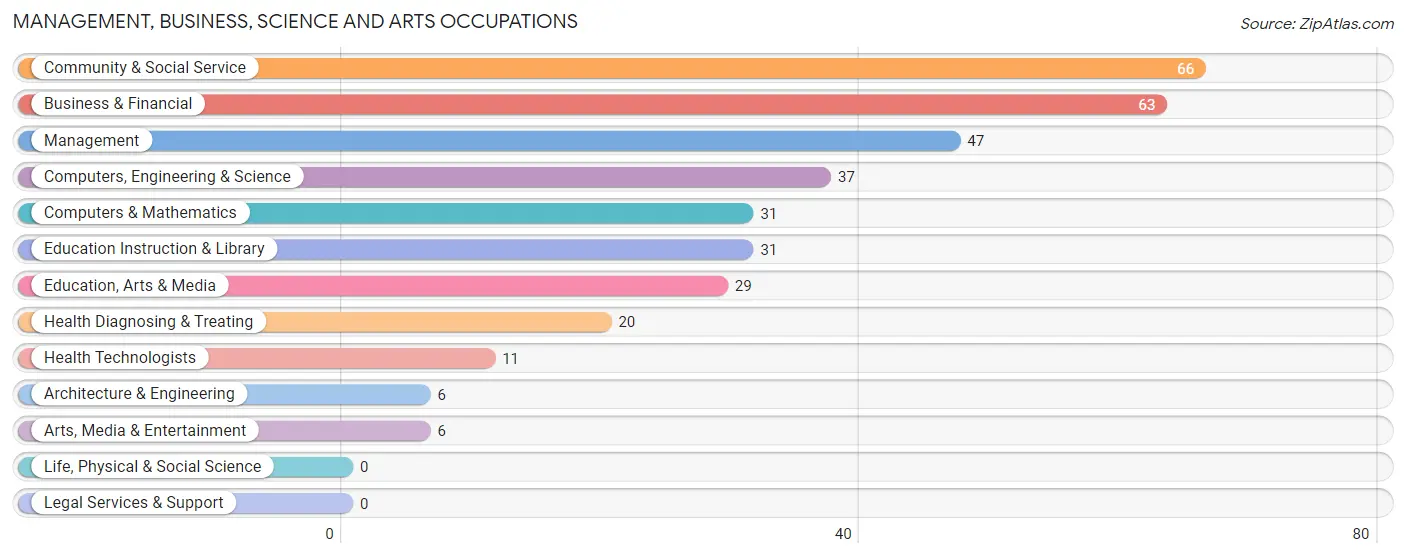
Management, Business, Science and Arts Occupations
The most common Management, Business, Science and Arts occupations in Lake Odessa are Community & Social Service (66 | 6.5%), Business & Financial (63 | 6.2%), Management (47 | 4.6%), Computers, Engineering & Science (37 | 3.6%), and Computers & Mathematics (31 | 3.0%).
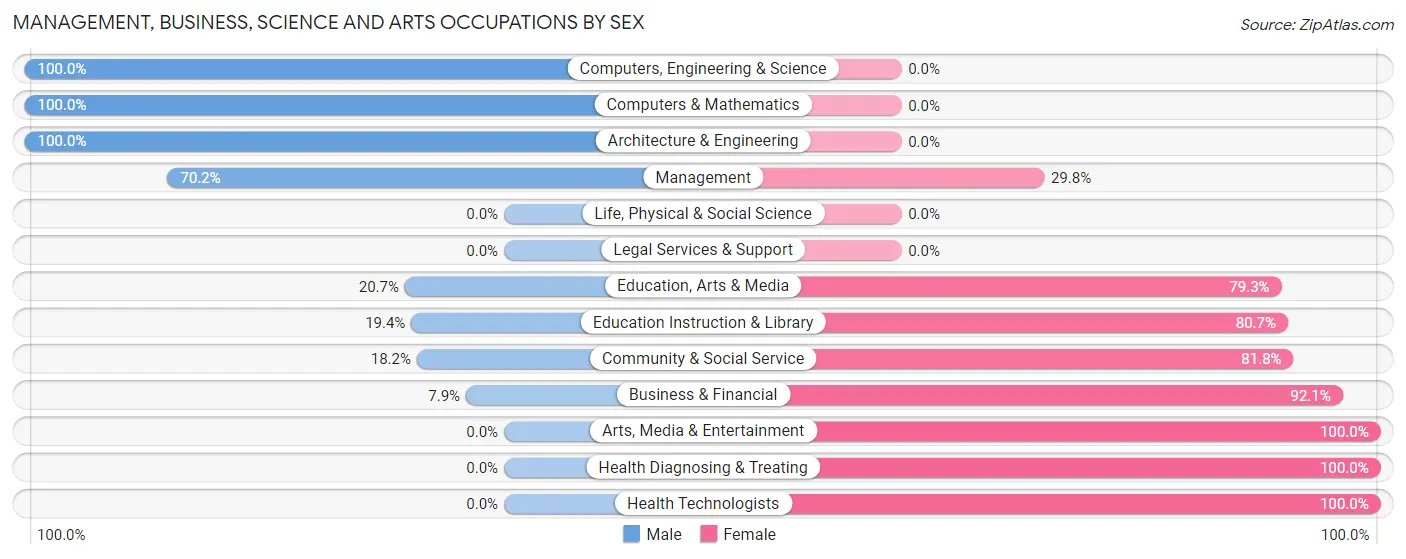
Management, Business, Science and Arts Occupations by Sex
Within the Management, Business, Science and Arts occupations in Lake Odessa, the most male-oriented occupations are Computers, Engineering & Science (100.0%), Computers & Mathematics (100.0%), and Architecture & Engineering (100.0%), while the most female-oriented occupations are Arts, Media & Entertainment (100.0%), Health Diagnosing & Treating (100.0%), and Health Technologists (100.0%).
| Occupation | Male | Female |
| Management | 33 (70.2%) | 14 (29.8%) |
| Business & Financial | 5 (7.9%) | 58 (92.1%) |
| Computers, Engineering & Science | 37 (100.0%) | 0 (0.0%) |
| Computers & Mathematics | 31 (100.0%) | 0 (0.0%) |
| Architecture & Engineering | 6 (100.0%) | 0 (0.0%) |
| Life, Physical & Social Science | 0 (0.0%) | 0 (0.0%) |
| Community & Social Service | 12 (18.2%) | 54 (81.8%) |
| Education, Arts & Media | 6 (20.7%) | 23 (79.3%) |
| Legal Services & Support | 0 (0.0%) | 0 (0.0%) |
| Education Instruction & Library | 6 (19.4%) | 25 (80.6%) |
| Arts, Media & Entertainment | 0 (0.0%) | 6 (100.0%) |
| Health Diagnosing & Treating | 0 (0.0%) | 20 (100.0%) |
| Health Technologists | 0 (0.0%) | 11 (100.0%) |
| Total (Category) | 87 (37.3%) | 146 (62.7%) |
| Total (Overall) | 480 (46.9%) | 543 (53.1%) |
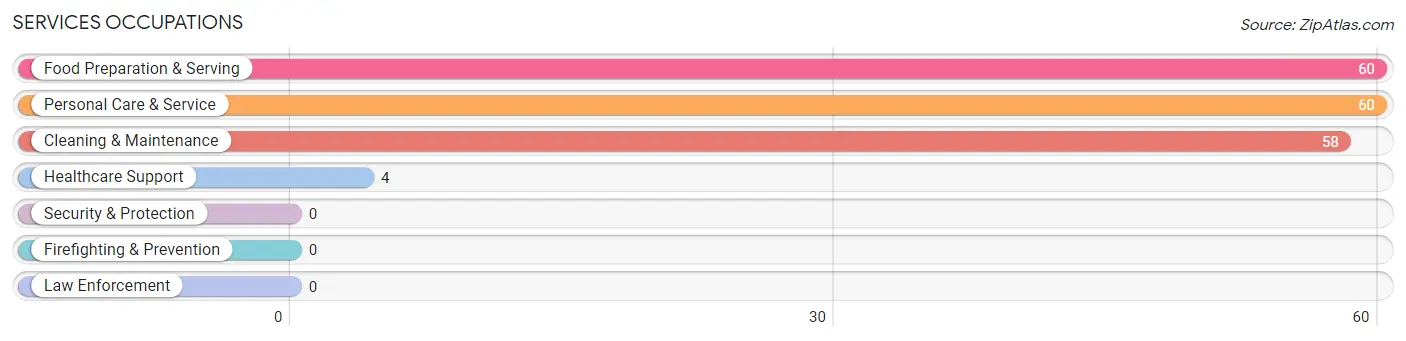
Services Occupations
The most common Services occupations in Lake Odessa are Food Preparation & Serving (60 | 5.9%), Personal Care & Service (60 | 5.9%), Cleaning & Maintenance (58 | 5.7%), and Healthcare Support (4 | 0.4%).
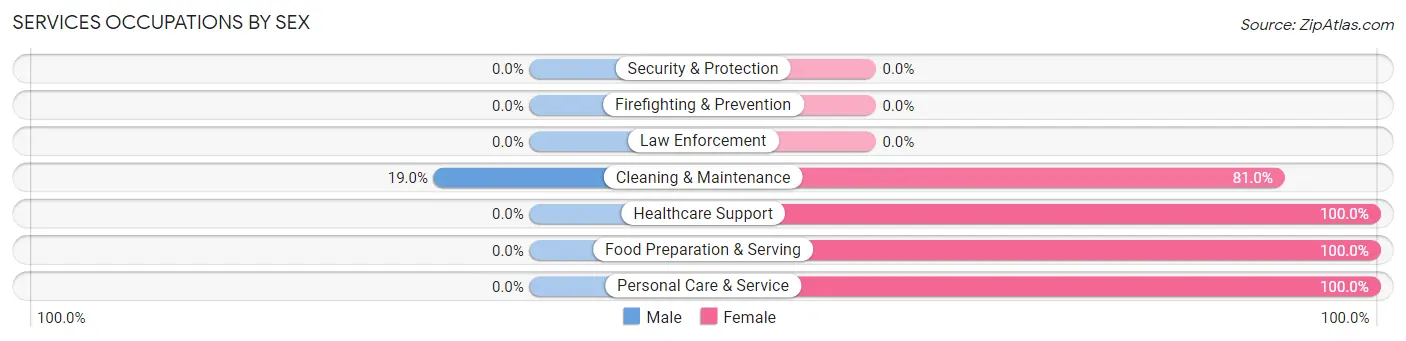
Services Occupations by Sex
| Occupation | Male | Female |
| Healthcare Support | 0 (0.0%) | 4 (100.0%) |
| Security & Protection | 0 (0.0%) | 0 (0.0%) |
| Firefighting & Prevention | 0 (0.0%) | 0 (0.0%) |
| Law Enforcement | 0 (0.0%) | 0 (0.0%) |
| Food Preparation & Serving | 0 (0.0%) | 60 (100.0%) |
| Cleaning & Maintenance | 11 (19.0%) | 47 (81.0%) |
| Personal Care & Service | 0 (0.0%) | 60 (100.0%) |
| Total (Category) | 11 (6.0%) | 171 (94.0%) |
| Total (Overall) | 480 (46.9%) | 543 (53.1%) |
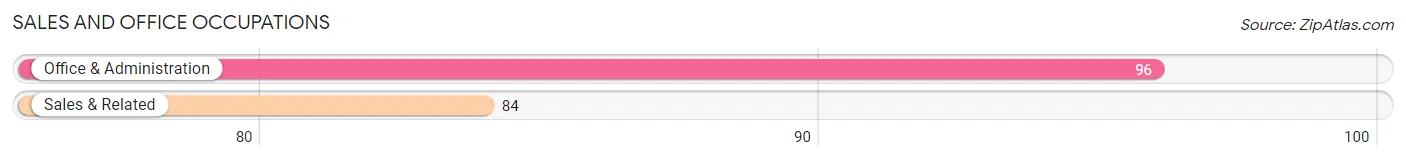
Sales and Office Occupations
The most common Sales and Office occupations in Lake Odessa are Office & Administration (96 | 9.4%), and Sales & Related (84 | 8.2%).
Sales and Office Occupations by Sex
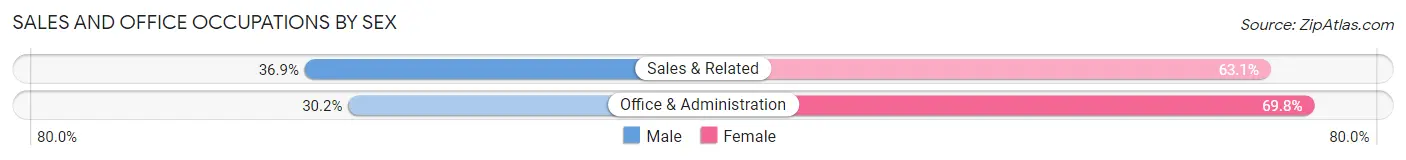
| Occupation | Male | Female |
| Sales & Related | 31 (36.9%) | 53 (63.1%) |
| Office & Administration | 29 (30.2%) | 67 (69.8%) |
| Total (Category) | 60 (33.3%) | 120 (66.7%) |
| Total (Overall) | 480 (46.9%) | 543 (53.1%) |
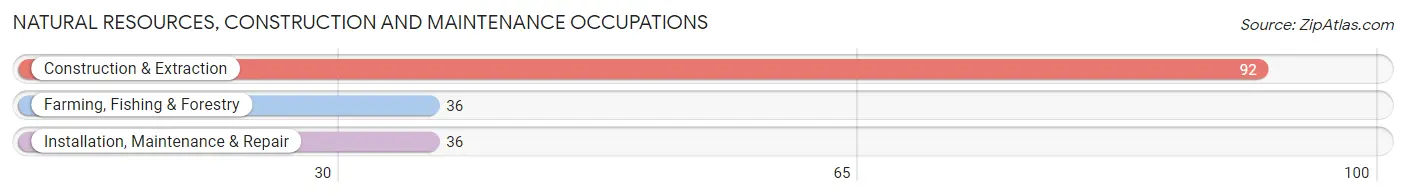
Natural Resources, Construction and Maintenance Occupations
The most common Natural Resources, Construction and Maintenance occupations in Lake Odessa are Construction & Extraction (92 | 9.0%), Farming, Fishing & Forestry (36 | 3.5%), and Installation, Maintenance & Repair (36 | 3.5%).
Natural Resources, Construction and Maintenance Occupations by Sex
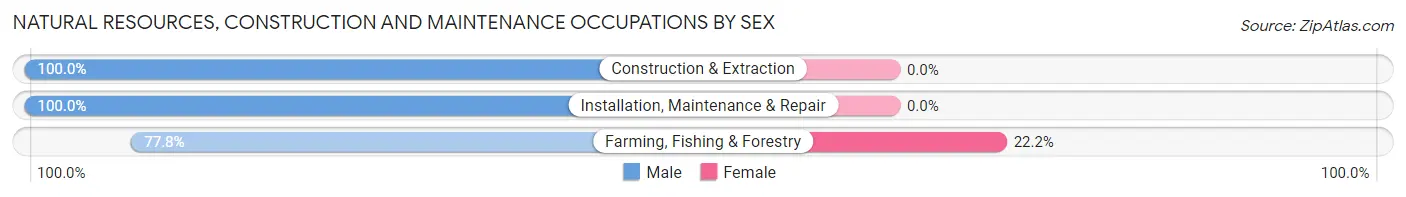
| Occupation | Male | Female |
| Farming, Fishing & Forestry | 28 (77.8%) | 8 (22.2%) |
| Construction & Extraction | 92 (100.0%) | 0 (0.0%) |
| Installation, Maintenance & Repair | 36 (100.0%) | 0 (0.0%) |
| Total (Category) | 156 (95.1%) | 8 (4.9%) |
| Total (Overall) | 480 (46.9%) | 543 (53.1%) |
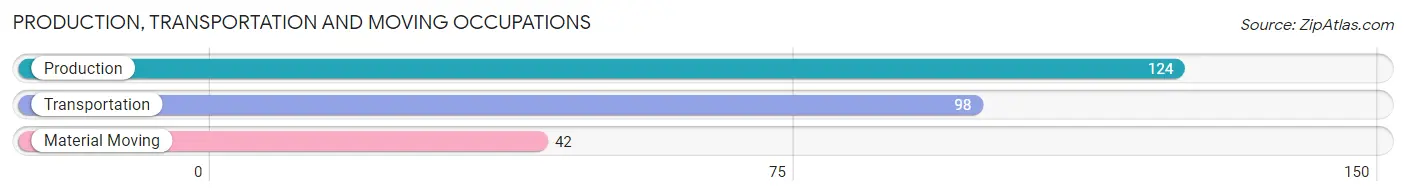
Production, Transportation and Moving Occupations
The most common Production, Transportation and Moving occupations in Lake Odessa are Production (124 | 12.1%), Transportation (98 | 9.6%), and Material Moving (42 | 4.1%).
Production, Transportation and Moving Occupations by Sex
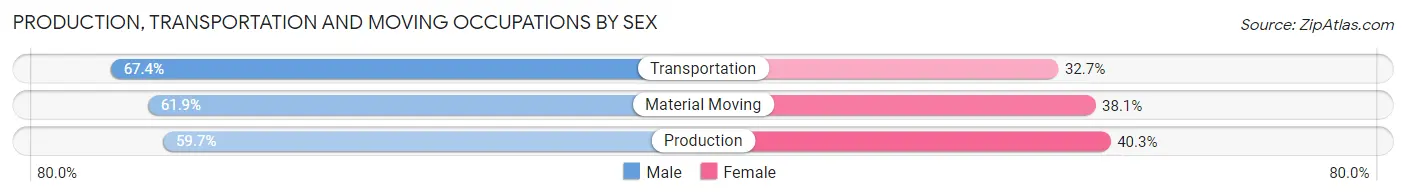
| Occupation | Male | Female |
| Production | 74 (59.7%) | 50 (40.3%) |
| Transportation | 66 (67.3%) | 32 (32.7%) |
| Material Moving | 26 (61.9%) | 16 (38.1%) |
| Total (Category) | 166 (62.9%) | 98 (37.1%) |
| Total (Overall) | 480 (46.9%) | 543 (53.1%) |
Employment Industries by Sex in Lake Odessa
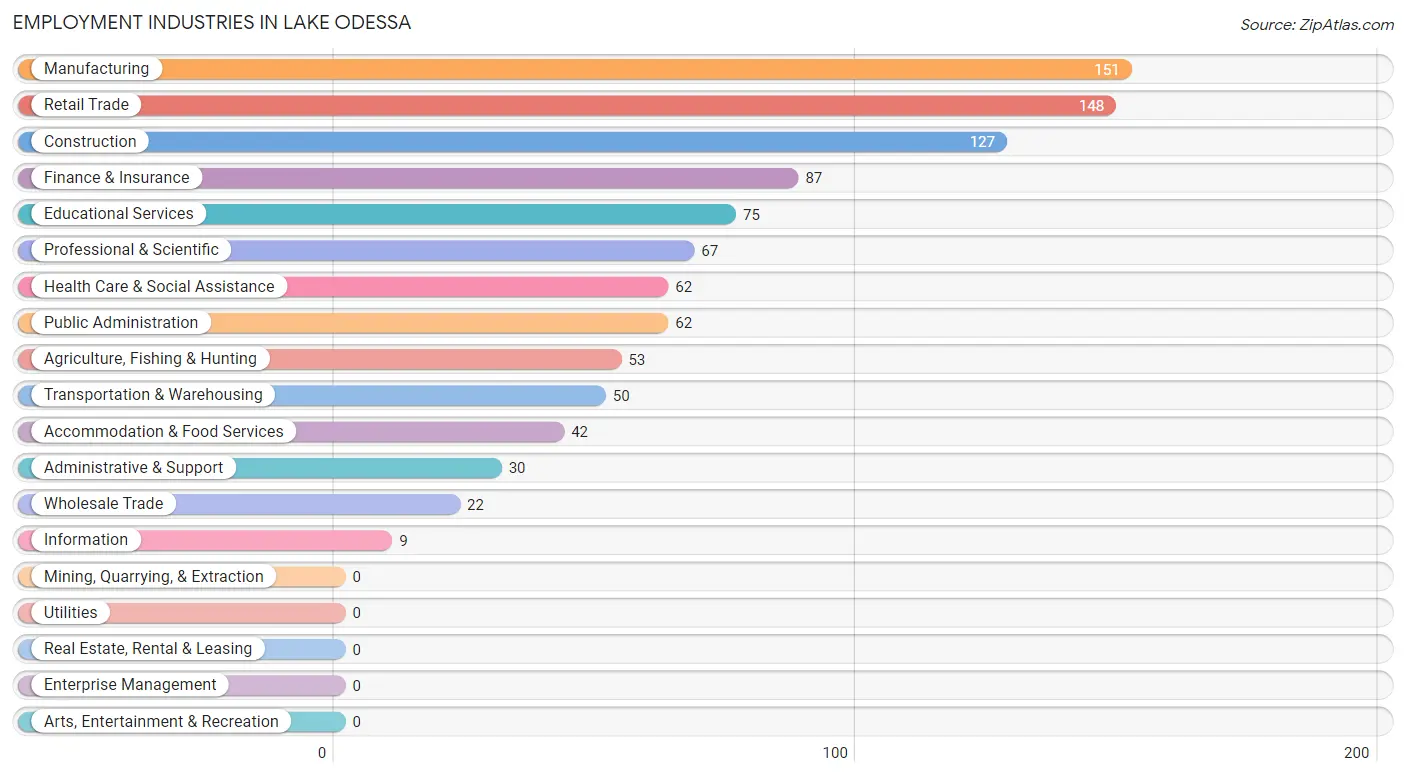
Employment Industries in Lake Odessa
The major employment industries in Lake Odessa include Manufacturing (151 | 14.8%), Retail Trade (148 | 14.5%), Construction (127 | 12.4%), Finance & Insurance (87 | 8.5%), and Educational Services (75 | 7.3%).
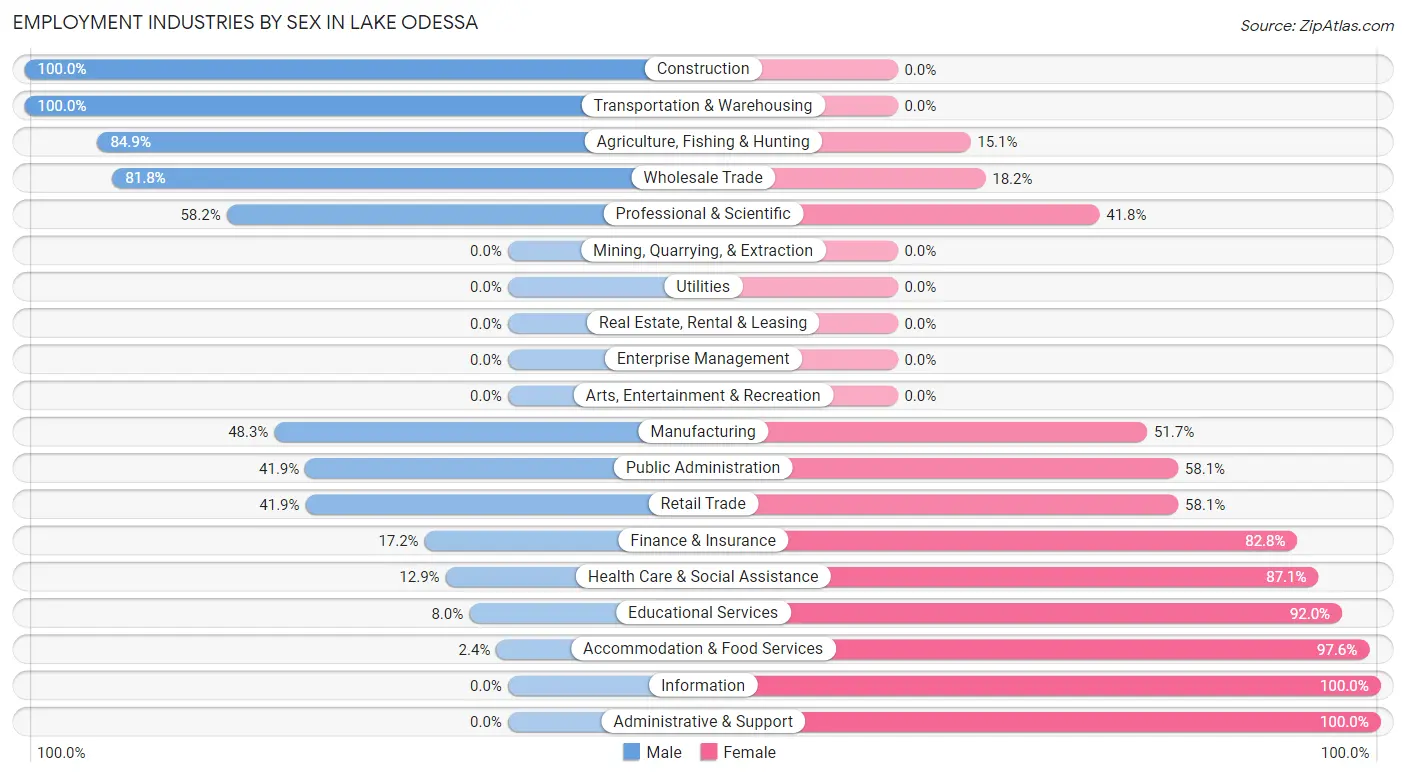
Employment Industries by Sex in Lake Odessa
The Lake Odessa industries that see more men than women are Construction (100.0%), Transportation & Warehousing (100.0%), and Agriculture, Fishing & Hunting (84.9%), whereas the industries that tend to have a higher number of women are Information (100.0%), Administrative & Support (100.0%), and Accommodation & Food Services (97.6%).
| Industry | Male | Female |
| Agriculture, Fishing & Hunting | 45 (84.9%) | 8 (15.1%) |
| Mining, Quarrying, & Extraction | 0 (0.0%) | 0 (0.0%) |
| Construction | 127 (100.0%) | 0 (0.0%) |
| Manufacturing | 73 (48.3%) | 78 (51.7%) |
| Wholesale Trade | 18 (81.8%) | 4 (18.2%) |
| Retail Trade | 62 (41.9%) | 86 (58.1%) |
| Transportation & Warehousing | 50 (100.0%) | 0 (0.0%) |
| Utilities | 0 (0.0%) | 0 (0.0%) |
| Information | 0 (0.0%) | 9 (100.0%) |
| Finance & Insurance | 15 (17.2%) | 72 (82.8%) |
| Real Estate, Rental & Leasing | 0 (0.0%) | 0 (0.0%) |
| Professional & Scientific | 39 (58.2%) | 28 (41.8%) |
| Enterprise Management | 0 (0.0%) | 0 (0.0%) |
| Administrative & Support | 0 (0.0%) | 30 (100.0%) |
| Educational Services | 6 (8.0%) | 69 (92.0%) |
| Health Care & Social Assistance | 8 (12.9%) | 54 (87.1%) |
| Arts, Entertainment & Recreation | 0 (0.0%) | 0 (0.0%) |
| Accommodation & Food Services | 1 (2.4%) | 41 (97.6%) |
| Public Administration | 26 (41.9%) | 36 (58.1%) |
| Total | 480 (46.9%) | 543 (53.1%) |
Education in Lake Odessa
School Enrollment in Lake Odessa
The most common levels of schooling among the 498 students in Lake Odessa are middle school (177 | 35.5%), high school (127 | 25.5%), and college / undergraduate (89 | 17.9%).
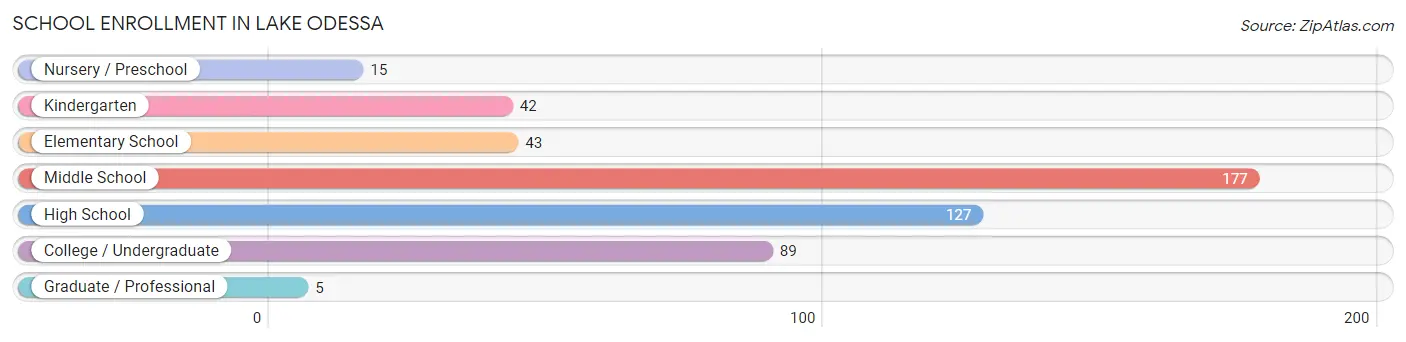
| School Level | # Students | % Students |
| Nursery / Preschool | 15 | 3.0% |
| Kindergarten | 42 | 8.4% |
| Elementary School | 43 | 8.6% |
| Middle School | 177 | 35.5% |
| High School | 127 | 25.5% |
| College / Undergraduate | 89 | 17.9% |
| Graduate / Professional | 5 | 1.0% |
| Total | 498 | 100.0% |
School Enrollment by Age by Funding Source in Lake Odessa
Out of a total of 498 students who are enrolled in schools in Lake Odessa, 45 (9.0%) attend a private institution, while the remaining 453 (91.0%) are enrolled in public schools. The age group of 25 to 34 year olds has the highest likelihood of being enrolled in private schools, with 19 (76.0% in the age bracket) enrolled. Conversely, the age group of 3 to 4 year olds has the lowest likelihood of being enrolled in a private school, with 5 (100.0% in the age bracket) attending a public institution.
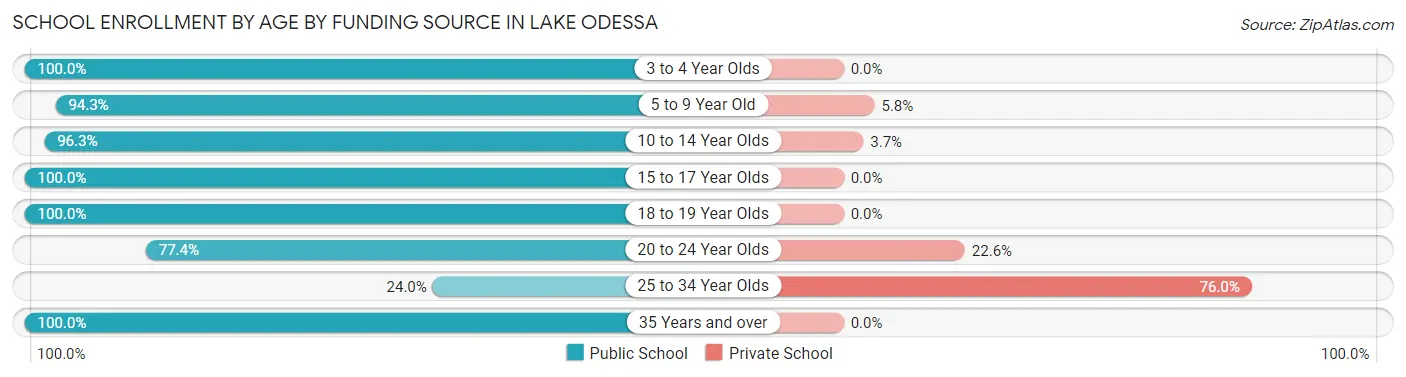
| Age Bracket | Public School | Private School |
| 3 to 4 Year Olds | 5 (100.0%) | 0 (0.0%) |
| 5 to 9 Year Old | 82 (94.3%) | 5 (5.8%) |
| 10 to 14 Year Olds | 184 (96.3%) | 7 (3.7%) |
| 15 to 17 Year Olds | 97 (100.0%) | 0 (0.0%) |
| 18 to 19 Year Olds | 5 (100.0%) | 0 (0.0%) |
| 20 to 24 Year Olds | 48 (77.4%) | 14 (22.6%) |
| 25 to 34 Year Olds | 6 (24.0%) | 19 (76.0%) |
| 35 Years and over | 26 (100.0%) | 0 (0.0%) |
| Total | 453 (91.0%) | 45 (9.0%) |
Educational Attainment by Field of Study in Lake Odessa
Business (57 | 25.7%), arts & humanities (49 | 22.1%), science & technology (25 | 11.3%), visual & performing arts (25 | 11.3%), and education (23 | 10.4%) are the most common fields of study among 222 individuals in Lake Odessa who have obtained a bachelor's degree or higher.
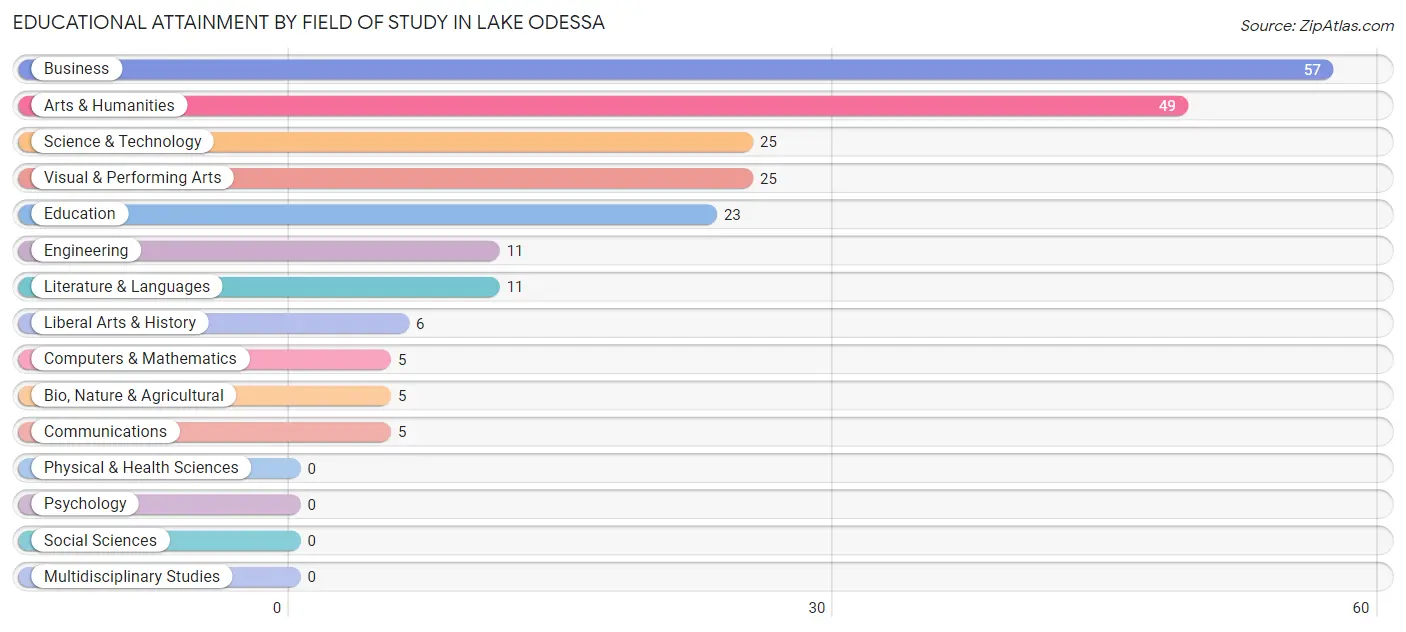
| Field of Study | # Graduates | % Graduates |
| Computers & Mathematics | 5 | 2.2% |
| Bio, Nature & Agricultural | 5 | 2.2% |
| Physical & Health Sciences | 0 | 0.0% |
| Psychology | 0 | 0.0% |
| Social Sciences | 0 | 0.0% |
| Engineering | 11 | 5.0% |
| Multidisciplinary Studies | 0 | 0.0% |
| Science & Technology | 25 | 11.3% |
| Business | 57 | 25.7% |
| Education | 23 | 10.4% |
| Literature & Languages | 11 | 5.0% |
| Liberal Arts & History | 6 | 2.7% |
| Visual & Performing Arts | 25 | 11.3% |
| Communications | 5 | 2.2% |
| Arts & Humanities | 49 | 22.1% |
| Total | 222 | 100.0% |
Transportation & Commute in Lake Odessa
Vehicle Availability by Sex in Lake Odessa
The most prevalent vehicle ownership categories in Lake Odessa are males with 2 vehicles (224, accounting for 46.8%) and females with 2 vehicles (301, making up 42.7%).
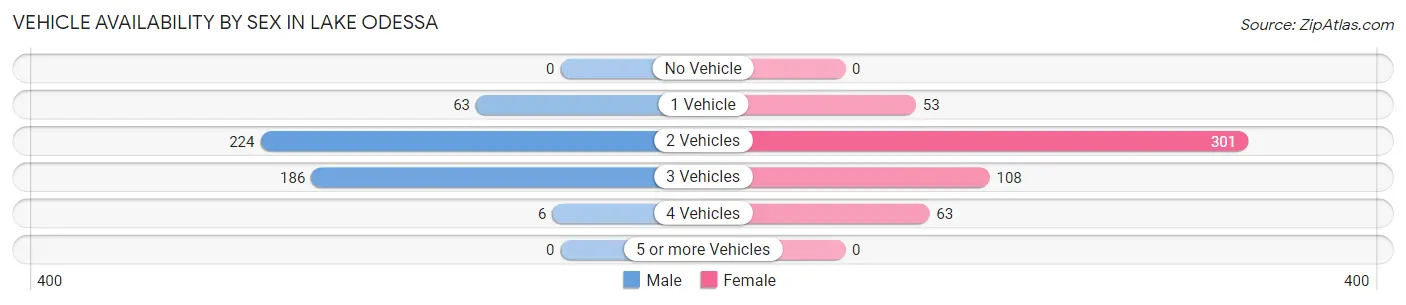
| Vehicles Available | Male | Female |
| No Vehicle | 0 (0.0%) | 0 (0.0%) |
| 1 Vehicle | 63 (13.2%) | 53 (10.1%) |
| 2 Vehicles | 224 (46.8%) | 301 (57.3%) |
| 3 Vehicles | 186 (38.8%) | 108 (20.6%) |
| 4 Vehicles | 6 (1.3%) | 63 (12.0%) |
| 5 or more Vehicles | 0 (0.0%) | 0 (0.0%) |
| Total | 479 (100.0%) | 525 (100.0%) |
Commute Time in Lake Odessa
The most frequently occuring commute durations in Lake Odessa are 40 to 44 minutes (181 commuters, 20.7%), 35 to 39 minutes (137 commuters, 15.7%), and 45 to 59 minutes (94 commuters, 10.8%).
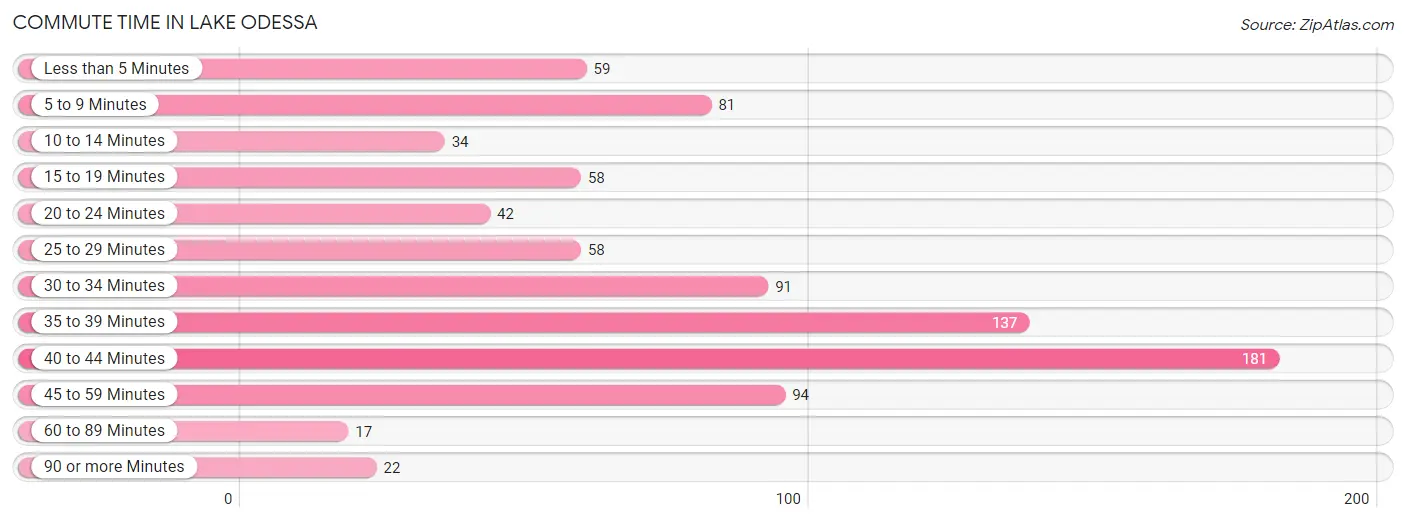
| Commute Time | # Commuters | % Commuters |
| Less than 5 Minutes | 59 | 6.8% |
| 5 to 9 Minutes | 81 | 9.3% |
| 10 to 14 Minutes | 34 | 3.9% |
| 15 to 19 Minutes | 58 | 6.6% |
| 20 to 24 Minutes | 42 | 4.8% |
| 25 to 29 Minutes | 58 | 6.6% |
| 30 to 34 Minutes | 91 | 10.4% |
| 35 to 39 Minutes | 137 | 15.7% |
| 40 to 44 Minutes | 181 | 20.7% |
| 45 to 59 Minutes | 94 | 10.8% |
| 60 to 89 Minutes | 17 | 1.9% |
| 90 or more Minutes | 22 | 2.5% |
Commute Time by Sex in Lake Odessa
The most common commute times in Lake Odessa are 40 to 44 minutes (86 commuters, 19.6%) for males and 40 to 44 minutes (95 commuters, 21.8%) for females.
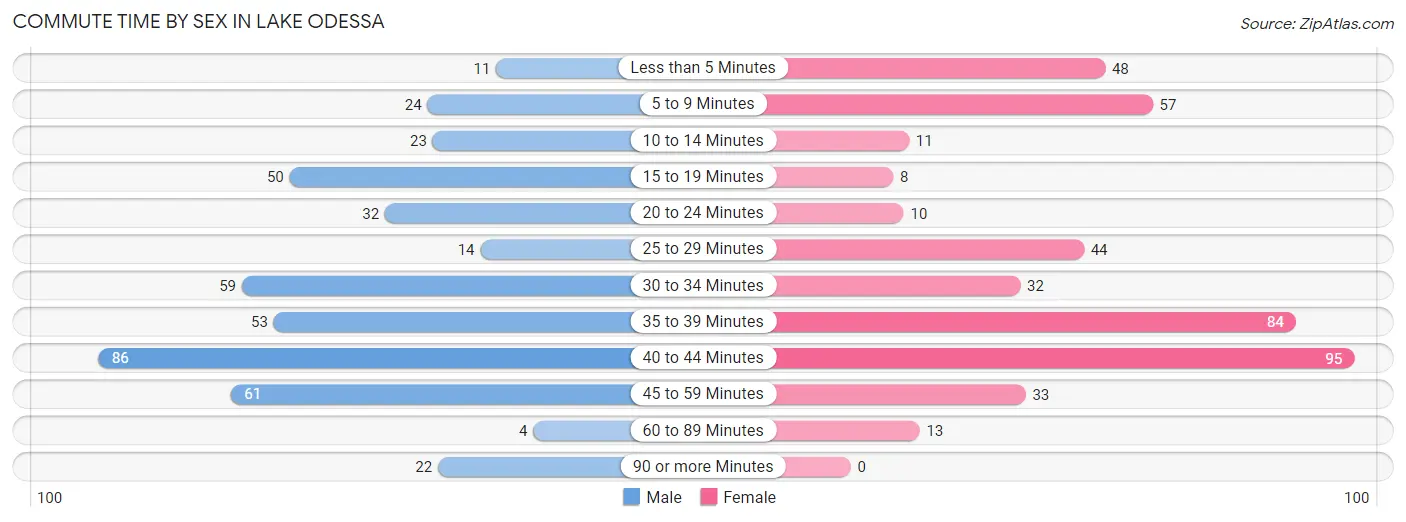
| Commute Time | Male | Female |
| Less than 5 Minutes | 11 (2.5%) | 48 (11.0%) |
| 5 to 9 Minutes | 24 (5.5%) | 57 (13.1%) |
| 10 to 14 Minutes | 23 (5.2%) | 11 (2.5%) |
| 15 to 19 Minutes | 50 (11.4%) | 8 (1.8%) |
| 20 to 24 Minutes | 32 (7.3%) | 10 (2.3%) |
| 25 to 29 Minutes | 14 (3.2%) | 44 (10.1%) |
| 30 to 34 Minutes | 59 (13.4%) | 32 (7.4%) |
| 35 to 39 Minutes | 53 (12.1%) | 84 (19.3%) |
| 40 to 44 Minutes | 86 (19.6%) | 95 (21.8%) |
| 45 to 59 Minutes | 61 (13.9%) | 33 (7.6%) |
| 60 to 89 Minutes | 4 (0.9%) | 13 (3.0%) |
| 90 or more Minutes | 22 (5.0%) | 0 (0.0%) |
Time of Departure to Work by Sex in Lake Odessa
The most frequent times of departure to work in Lake Odessa are 6:30 AM to 6:59 AM (91, 20.7%) for males and 6:00 AM to 6:29 AM (79, 18.2%) for females.
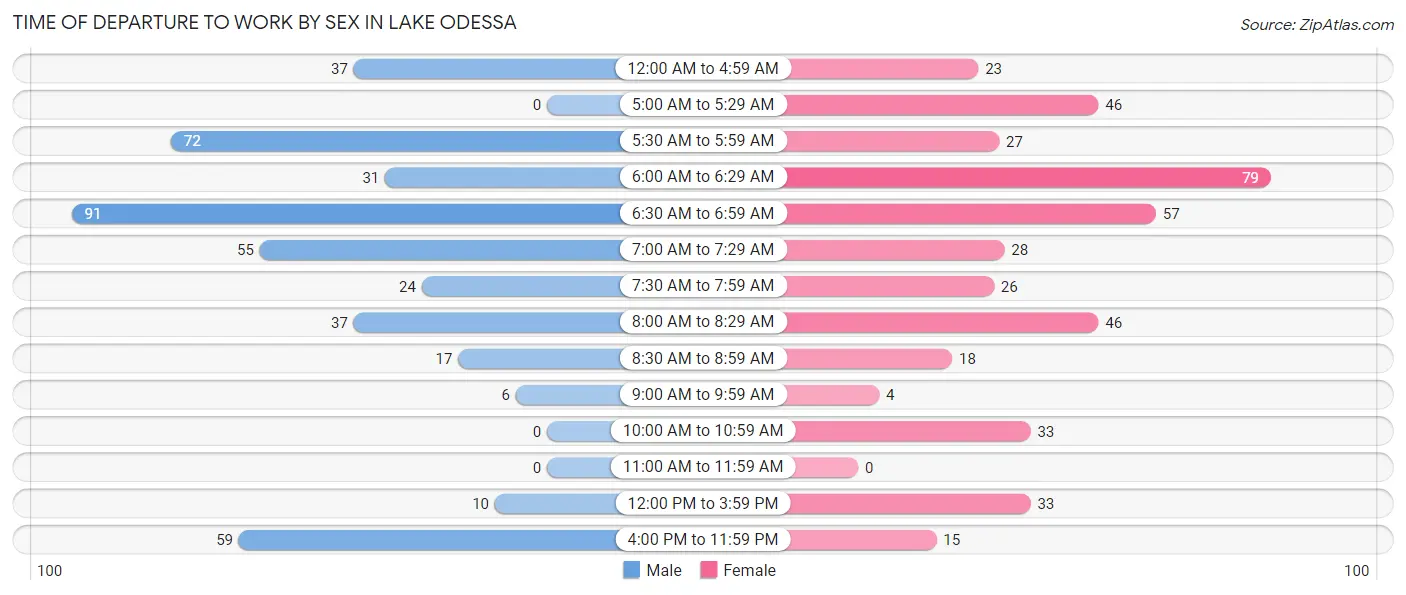
| Time of Departure | Male | Female |
| 12:00 AM to 4:59 AM | 37 (8.4%) | 23 (5.3%) |
| 5:00 AM to 5:29 AM | 0 (0.0%) | 46 (10.6%) |
| 5:30 AM to 5:59 AM | 72 (16.4%) | 27 (6.2%) |
| 6:00 AM to 6:29 AM | 31 (7.1%) | 79 (18.2%) |
| 6:30 AM to 6:59 AM | 91 (20.7%) | 57 (13.1%) |
| 7:00 AM to 7:29 AM | 55 (12.5%) | 28 (6.4%) |
| 7:30 AM to 7:59 AM | 24 (5.5%) | 26 (6.0%) |
| 8:00 AM to 8:29 AM | 37 (8.4%) | 46 (10.6%) |
| 8:30 AM to 8:59 AM | 17 (3.9%) | 18 (4.1%) |
| 9:00 AM to 9:59 AM | 6 (1.4%) | 4 (0.9%) |
| 10:00 AM to 10:59 AM | 0 (0.0%) | 33 (7.6%) |
| 11:00 AM to 11:59 AM | 0 (0.0%) | 0 (0.0%) |
| 12:00 PM to 3:59 PM | 10 (2.3%) | 33 (7.6%) |
| 4:00 PM to 11:59 PM | 59 (13.4%) | 15 (3.5%) |
| Total | 439 (100.0%) | 435 (100.0%) |
Housing Occupancy in Lake Odessa
Occupancy by Ownership in Lake Odessa
Of the total 757 dwellings in Lake Odessa, owner-occupied units account for 583 (77.0%), while renter-occupied units make up 174 (23.0%).
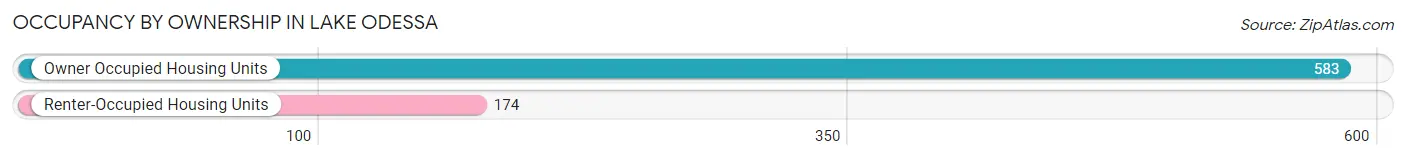
| Occupancy | # Housing Units | % Housing Units |
| Owner Occupied Housing Units | 583 | 77.0% |
| Renter-Occupied Housing Units | 174 | 23.0% |
| Total Occupied Housing Units | 757 | 100.0% |
Occupancy by Household Size in Lake Odessa
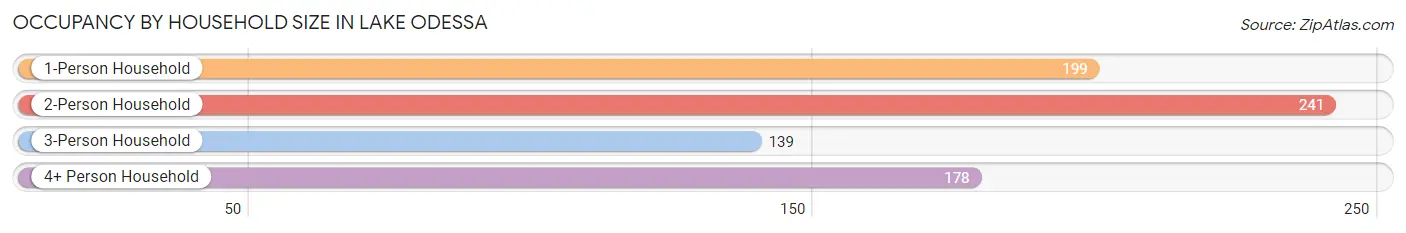
| Household Size | # Housing Units | % Housing Units |
| 1-Person Household | 199 | 26.3% |
| 2-Person Household | 241 | 31.8% |
| 3-Person Household | 139 | 18.4% |
| 4+ Person Household | 178 | 23.5% |
| Total Housing Units | 757 | 100.0% |
Occupancy by Ownership by Household Size in Lake Odessa
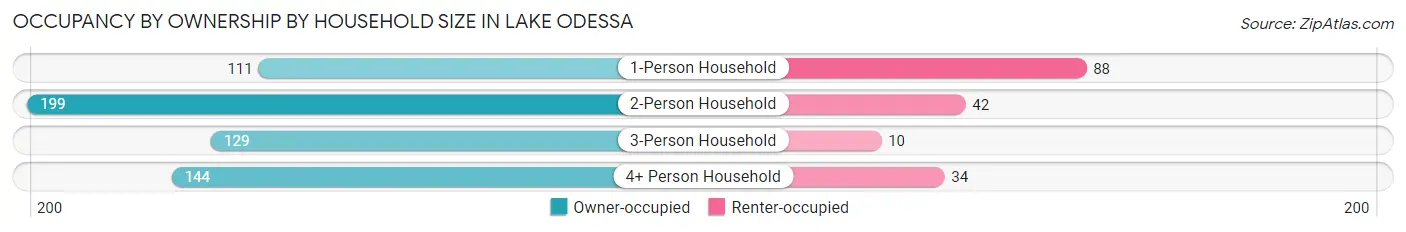
| Household Size | Owner-occupied | Renter-occupied |
| 1-Person Household | 111 (55.8%) | 88 (44.2%) |
| 2-Person Household | 199 (82.6%) | 42 (17.4%) |
| 3-Person Household | 129 (92.8%) | 10 (7.2%) |
| 4+ Person Household | 144 (80.9%) | 34 (19.1%) |
| Total Housing Units | 583 (77.0%) | 174 (23.0%) |
Occupancy by Educational Attainment in Lake Odessa
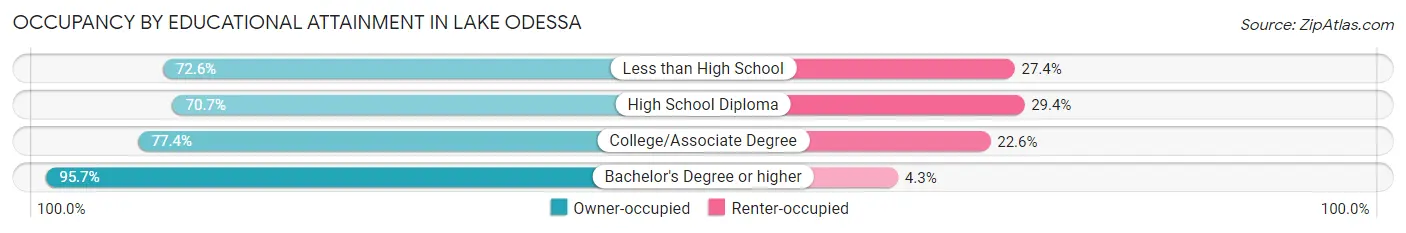
| Household Size | Owner-occupied | Renter-occupied |
| Less than High School | 82 (72.6%) | 31 (27.4%) |
| High School Diploma | 195 (70.7%) | 81 (29.3%) |
| College/Associate Degree | 195 (77.4%) | 57 (22.6%) |
| Bachelor's Degree or higher | 111 (95.7%) | 5 (4.3%) |
Occupancy by Age of Householder in Lake Odessa
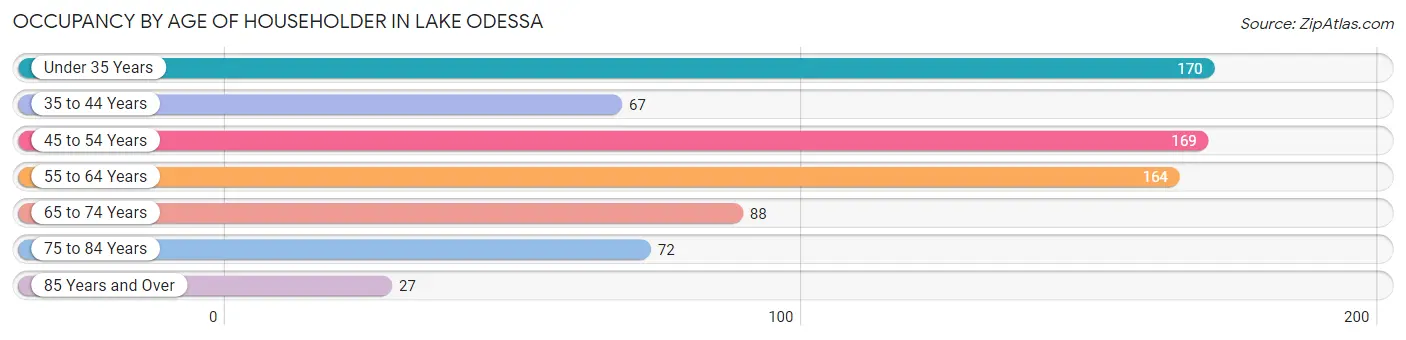
| Age Bracket | # Households | % Households |
| Under 35 Years | 170 | 22.5% |
| 35 to 44 Years | 67 | 8.8% |
| 45 to 54 Years | 169 | 22.3% |
| 55 to 64 Years | 164 | 21.7% |
| 65 to 74 Years | 88 | 11.6% |
| 75 to 84 Years | 72 | 9.5% |
| 85 Years and Over | 27 | 3.6% |
| Total | 757 | 100.0% |
Housing Finances in Lake Odessa
Median Income by Occupancy in Lake Odessa
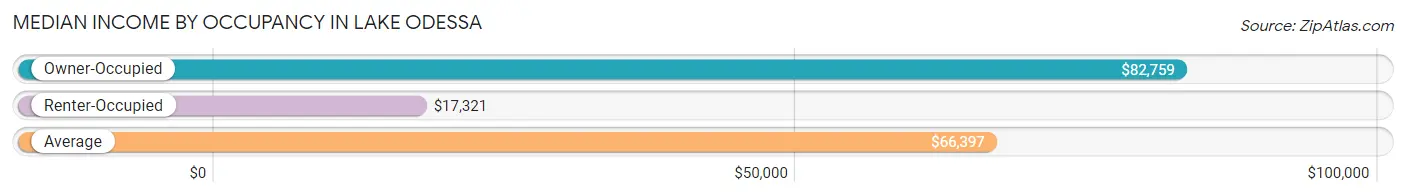
| Occupancy Type | # Households | Median Income |
| Owner-Occupied | 583 (77.0%) | $82,759 |
| Renter-Occupied | 174 (23.0%) | $17,321 |
| Average | 757 (100.0%) | $66,397 |
Occupancy by Householder Income Bracket in Lake Odessa
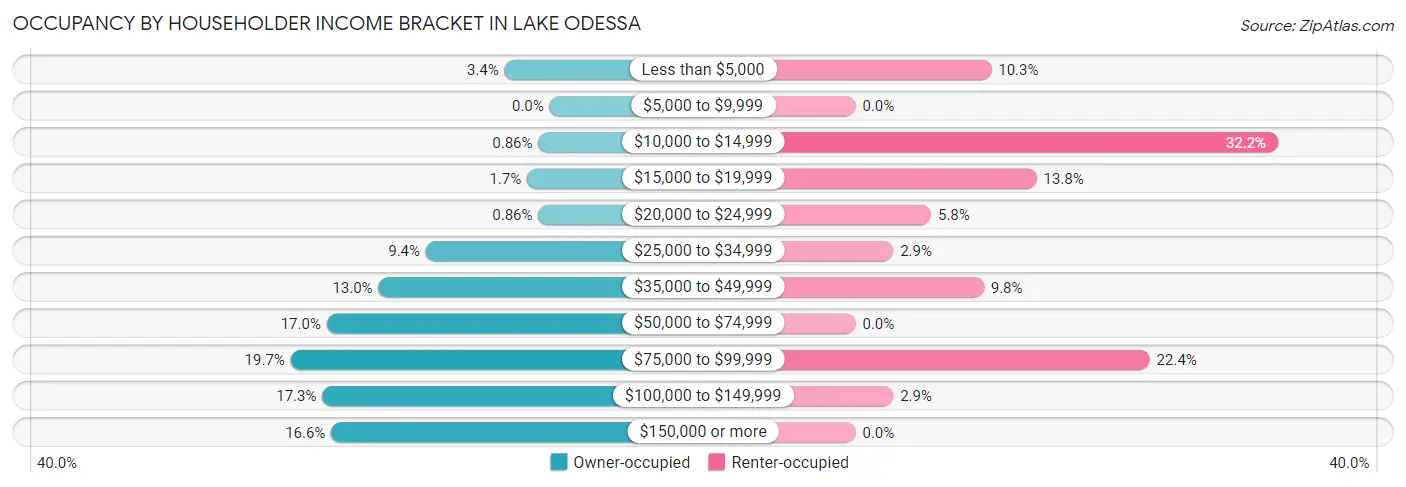
| Income Bracket | Owner-occupied | Renter-occupied |
| Less than $5,000 | 20 (3.4%) | 18 (10.3%) |
| $5,000 to $9,999 | 0 (0.0%) | 0 (0.0%) |
| $10,000 to $14,999 | 5 (0.9%) | 56 (32.2%) |
| $15,000 to $19,999 | 10 (1.7%) | 24 (13.8%) |
| $20,000 to $24,999 | 5 (0.9%) | 10 (5.8%) |
| $25,000 to $34,999 | 55 (9.4%) | 5 (2.9%) |
| $35,000 to $49,999 | 76 (13.0%) | 17 (9.8%) |
| $50,000 to $74,999 | 99 (17.0%) | 0 (0.0%) |
| $75,000 to $99,999 | 115 (19.7%) | 39 (22.4%) |
| $100,000 to $149,999 | 101 (17.3%) | 5 (2.9%) |
| $150,000 or more | 97 (16.6%) | 0 (0.0%) |
| Total | 583 (100.0%) | 174 (100.0%) |
Monthly Housing Cost Tiers in Lake Odessa
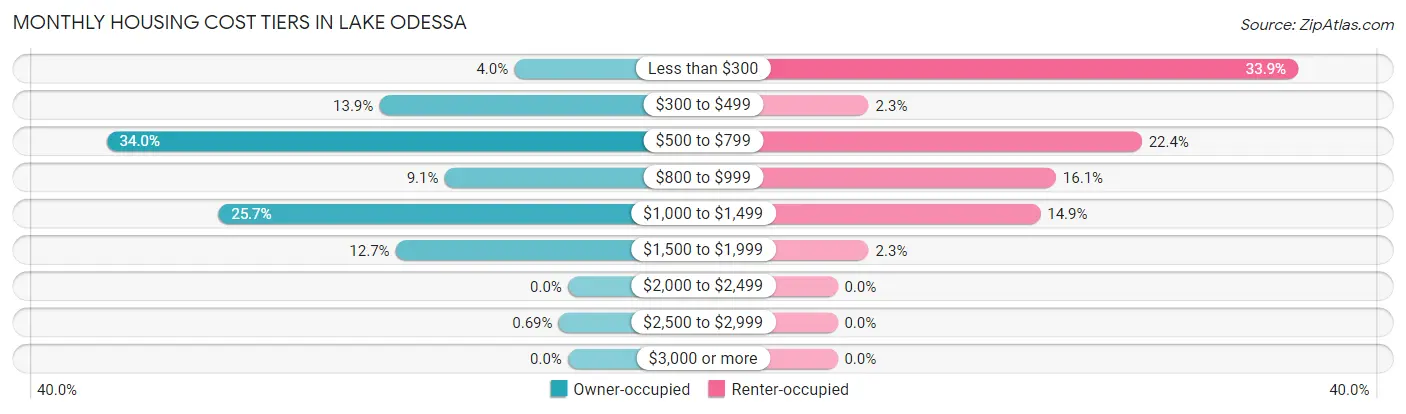
| Monthly Cost | Owner-occupied | Renter-occupied |
| Less than $300 | 23 (4.0%) | 59 (33.9%) |
| $300 to $499 | 81 (13.9%) | 4 (2.3%) |
| $500 to $799 | 198 (34.0%) | 39 (22.4%) |
| $800 to $999 | 53 (9.1%) | 28 (16.1%) |
| $1,000 to $1,499 | 150 (25.7%) | 26 (14.9%) |
| $1,500 to $1,999 | 74 (12.7%) | 4 (2.3%) |
| $2,000 to $2,499 | 0 (0.0%) | 0 (0.0%) |
| $2,500 to $2,999 | 4 (0.7%) | 0 (0.0%) |
| $3,000 or more | 0 (0.0%) | 0 (0.0%) |
| Total | 583 (100.0%) | 174 (100.0%) |
Physical Housing Characteristics in Lake Odessa
Housing Structures in Lake Odessa
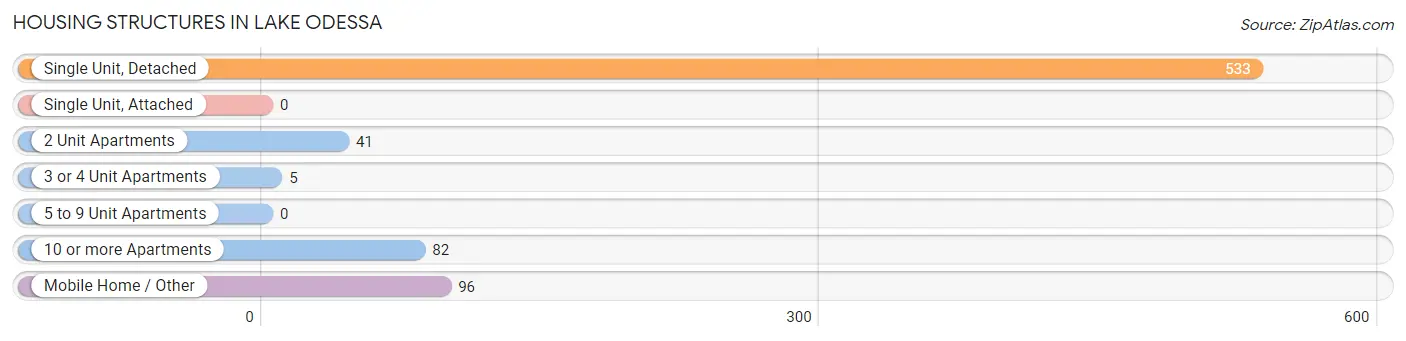
| Structure Type | # Housing Units | % Housing Units |
| Single Unit, Detached | 533 | 70.4% |
| Single Unit, Attached | 0 | 0.0% |
| 2 Unit Apartments | 41 | 5.4% |
| 3 or 4 Unit Apartments | 5 | 0.7% |
| 5 to 9 Unit Apartments | 0 | 0.0% |
| 10 or more Apartments | 82 | 10.8% |
| Mobile Home / Other | 96 | 12.7% |
| Total | 757 | 100.0% |
Housing Structures by Occupancy in Lake Odessa

| Structure Type | Owner-occupied | Renter-occupied |
| Single Unit, Detached | 487 (91.4%) | 46 (8.6%) |
| Single Unit, Attached | 0 (0.0%) | 0 (0.0%) |
| 2 Unit Apartments | 0 (0.0%) | 41 (100.0%) |
| 3 or 4 Unit Apartments | 0 (0.0%) | 5 (100.0%) |
| 5 to 9 Unit Apartments | 0 (0.0%) | 0 (0.0%) |
| 10 or more Apartments | 0 (0.0%) | 82 (100.0%) |
| Mobile Home / Other | 96 (100.0%) | 0 (0.0%) |
| Total | 583 (77.0%) | 174 (23.0%) |
Housing Structures by Number of Rooms in Lake Odessa
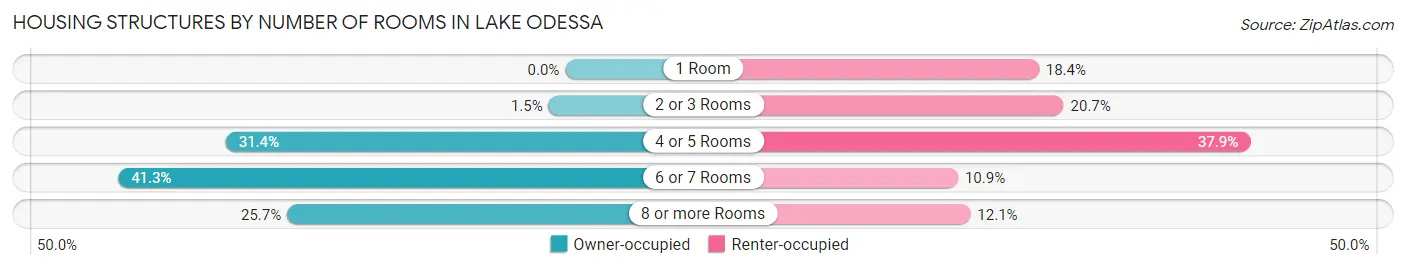
| Number of Rooms | Owner-occupied | Renter-occupied |
| 1 Room | 0 (0.0%) | 32 (18.4%) |
| 2 or 3 Rooms | 9 (1.5%) | 36 (20.7%) |
| 4 or 5 Rooms | 183 (31.4%) | 66 (37.9%) |
| 6 or 7 Rooms | 241 (41.3%) | 19 (10.9%) |
| 8 or more Rooms | 150 (25.7%) | 21 (12.1%) |
| Total | 583 (100.0%) | 174 (100.0%) |
Housing Structure by Heating Type in Lake Odessa
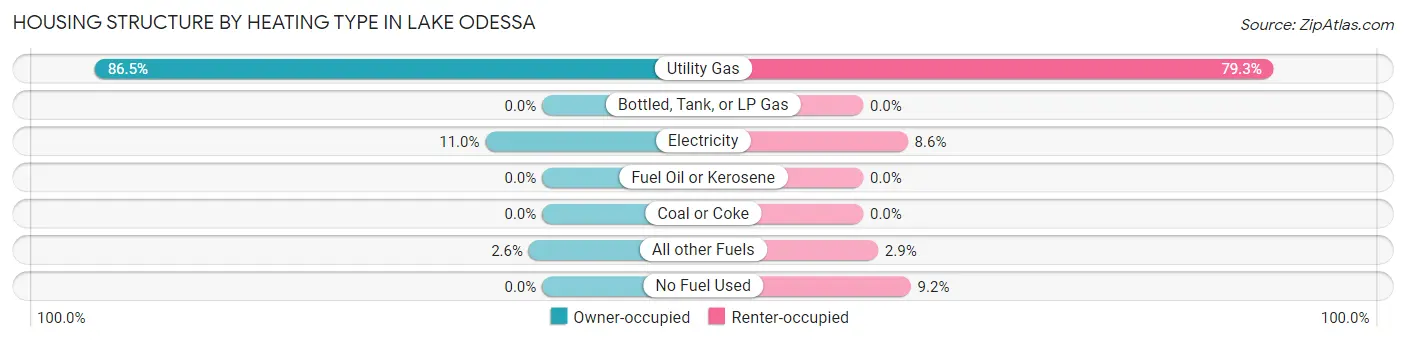
| Heating Type | Owner-occupied | Renter-occupied |
| Utility Gas | 504 (86.5%) | 138 (79.3%) |
| Bottled, Tank, or LP Gas | 0 (0.0%) | 0 (0.0%) |
| Electricity | 64 (11.0%) | 15 (8.6%) |
| Fuel Oil or Kerosene | 0 (0.0%) | 0 (0.0%) |
| Coal or Coke | 0 (0.0%) | 0 (0.0%) |
| All other Fuels | 15 (2.6%) | 5 (2.9%) |
| No Fuel Used | 0 (0.0%) | 16 (9.2%) |
| Total | 583 (100.0%) | 174 (100.0%) |
Household Vehicle Usage in Lake Odessa
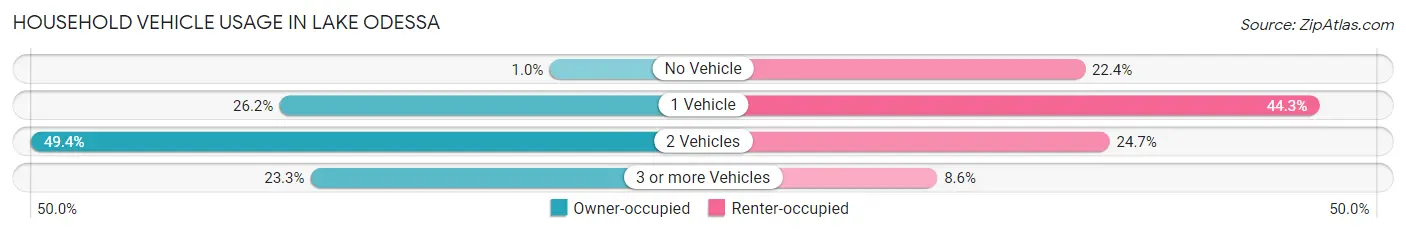
| Vehicles per Household | Owner-occupied | Renter-occupied |
| No Vehicle | 6 (1.0%) | 39 (22.4%) |
| 1 Vehicle | 153 (26.2%) | 77 (44.3%) |
| 2 Vehicles | 288 (49.4%) | 43 (24.7%) |
| 3 or more Vehicles | 136 (23.3%) | 15 (8.6%) |
| Total | 583 (100.0%) | 174 (100.0%) |
Real Estate & Mortgages in Lake Odessa
Real Estate and Mortgage Overview in Lake Odessa
| Characteristic | Without Mortgage | With Mortgage |
| Housing Units | 287 | 296 |
| Median Property Value | $138,900 | $139,000 |
| Median Household Income | $65,074 | $44 |
| Monthly Housing Costs | $566 | $0 |
| Real Estate Taxes | $2,603 | $6 |
Property Value by Mortgage Status in Lake Odessa
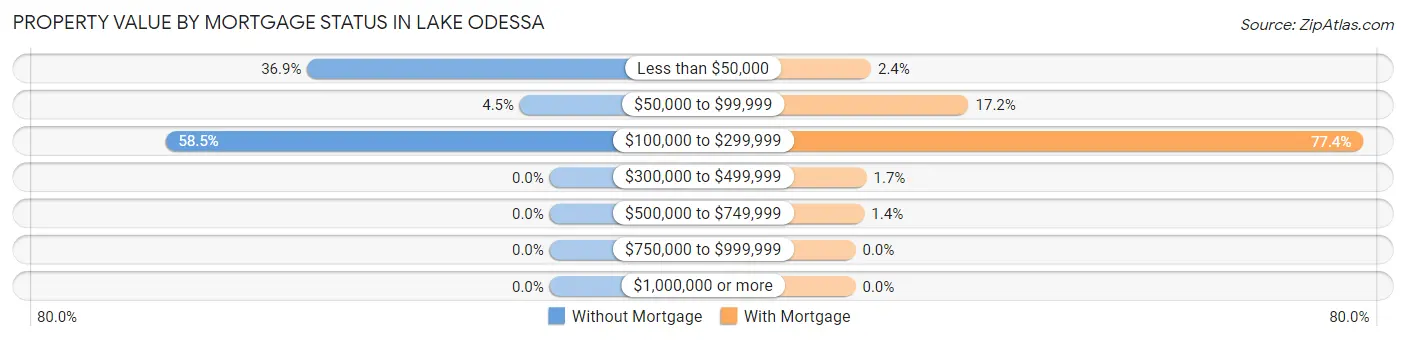
| Property Value | Without Mortgage | With Mortgage |
| Less than $50,000 | 106 (36.9%) | 7 (2.4%) |
| $50,000 to $99,999 | 13 (4.5%) | 51 (17.2%) |
| $100,000 to $299,999 | 168 (58.5%) | 229 (77.4%) |
| $300,000 to $499,999 | 0 (0.0%) | 5 (1.7%) |
| $500,000 to $749,999 | 0 (0.0%) | 4 (1.3%) |
| $750,000 to $999,999 | 0 (0.0%) | 0 (0.0%) |
| $1,000,000 or more | 0 (0.0%) | 0 (0.0%) |
| Total | 287 (100.0%) | 296 (100.0%) |
Household Income by Mortgage Status in Lake Odessa
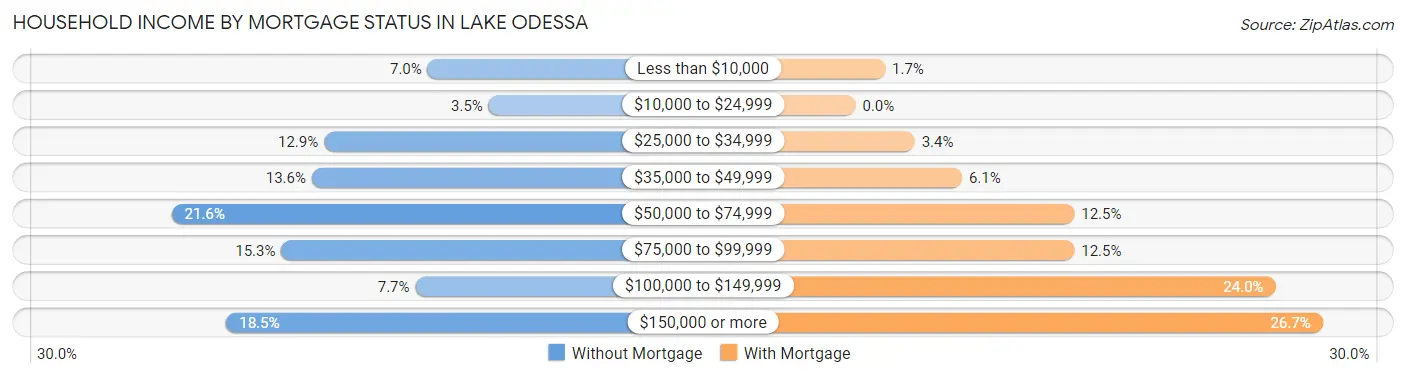
| Household Income | Without Mortgage | With Mortgage |
| Less than $10,000 | 20 (7.0%) | 5 (1.7%) |
| $10,000 to $24,999 | 10 (3.5%) | 0 (0.0%) |
| $25,000 to $34,999 | 37 (12.9%) | 10 (3.4%) |
| $35,000 to $49,999 | 39 (13.6%) | 18 (6.1%) |
| $50,000 to $74,999 | 62 (21.6%) | 37 (12.5%) |
| $75,000 to $99,999 | 44 (15.3%) | 37 (12.5%) |
| $100,000 to $149,999 | 22 (7.7%) | 71 (24.0%) |
| $150,000 or more | 53 (18.5%) | 79 (26.7%) |
| Total | 287 (100.0%) | 296 (100.0%) |
Property Value to Household Income Ratio in Lake Odessa
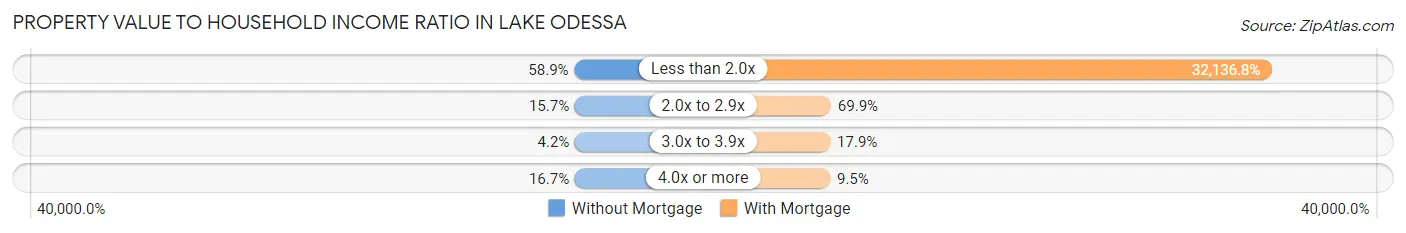
| Value-to-Income Ratio | Without Mortgage | With Mortgage |
| Less than 2.0x | 169 (58.9%) | 95,125 (32,136.8%) |
| 2.0x to 2.9x | 45 (15.7%) | 207 (69.9%) |
| 3.0x to 3.9x | 12 (4.2%) | 53 (17.9%) |
| 4.0x or more | 48 (16.7%) | 28 (9.5%) |
| Total | 287 (100.0%) | 296 (100.0%) |
Real Estate Taxes by Mortgage Status in Lake Odessa
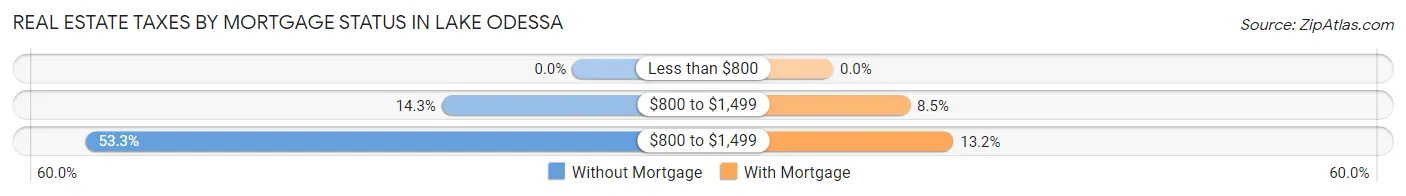
| Property Taxes | Without Mortgage | With Mortgage |
| Less than $800 | 0 (0.0%) | 0 (0.0%) |
| $800 to $1,499 | 41 (14.3%) | 25 (8.5%) |
| $800 to $1,499 | 153 (53.3%) | 39 (13.2%) |
| Total | 287 (100.0%) | 296 (100.0%) |
Health & Disability in Lake Odessa
Health Insurance Coverage by Age in Lake Odessa
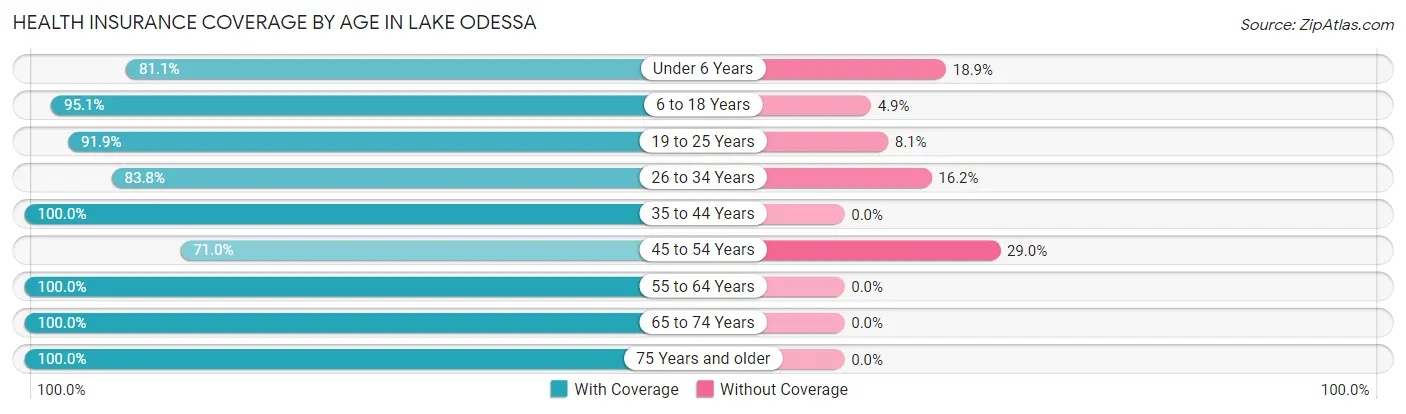
| Age Bracket | With Coverage | Without Coverage |
| Under 6 Years | 107 (81.1%) | 25 (18.9%) |
| 6 to 18 Years | 327 (95.1%) | 17 (4.9%) |
| 19 to 25 Years | 204 (91.9%) | 18 (8.1%) |
| 26 to 34 Years | 289 (83.8%) | 56 (16.2%) |
| 35 to 44 Years | 210 (100.0%) | 0 (0.0%) |
| 45 to 54 Years | 176 (71.0%) | 72 (29.0%) |
| 55 to 64 Years | 224 (100.0%) | 0 (0.0%) |
| 65 to 74 Years | 265 (100.0%) | 0 (0.0%) |
| 75 Years and older | 139 (100.0%) | 0 (0.0%) |
| Total | 1,941 (91.2%) | 188 (8.8%) |
Health Insurance Coverage by Citizenship Status in Lake Odessa
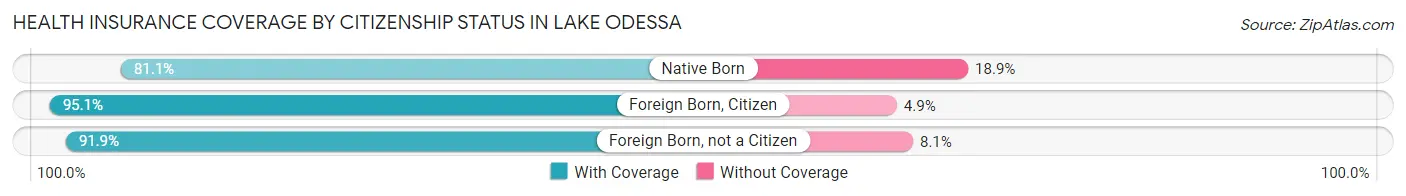
| Citizenship Status | With Coverage | Without Coverage |
| Native Born | 107 (81.1%) | 25 (18.9%) |
| Foreign Born, Citizen | 327 (95.1%) | 17 (4.9%) |
| Foreign Born, not a Citizen | 204 (91.9%) | 18 (8.1%) |
Health Insurance Coverage by Household Income in Lake Odessa
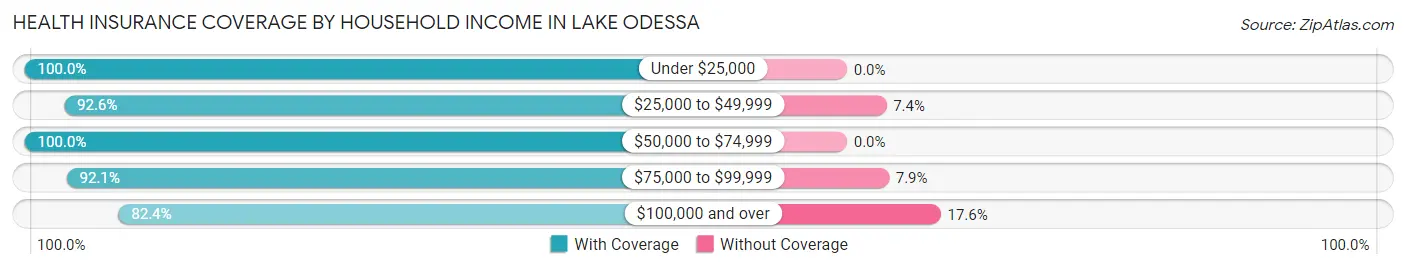
| Household Income | With Coverage | Without Coverage |
| Under $25,000 | 250 (100.0%) | 0 (0.0%) |
| $25,000 to $49,999 | 376 (92.6%) | 30 (7.4%) |
| $50,000 to $74,999 | 281 (100.0%) | 0 (0.0%) |
| $75,000 to $99,999 | 480 (92.1%) | 41 (7.9%) |
| $100,000 and over | 549 (82.4%) | 117 (17.6%) |
Public vs Private Health Insurance Coverage by Age in Lake Odessa
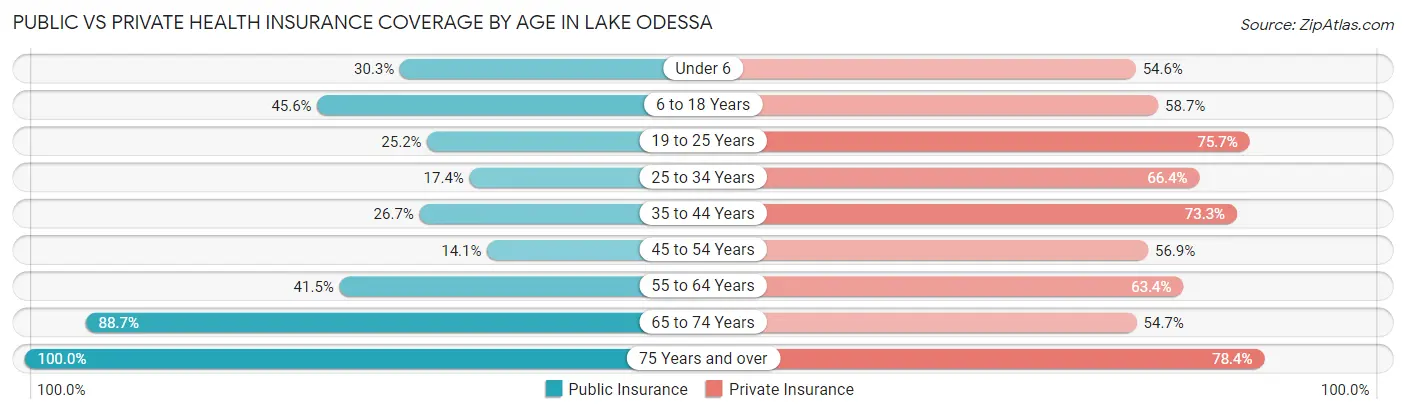
| Age Bracket | Public Insurance | Private Insurance |
| Under 6 | 40 (30.3%) | 72 (54.5%) |
| 6 to 18 Years | 157 (45.6%) | 202 (58.7%) |
| 19 to 25 Years | 56 (25.2%) | 168 (75.7%) |
| 25 to 34 Years | 60 (17.4%) | 229 (66.4%) |
| 35 to 44 Years | 56 (26.7%) | 154 (73.3%) |
| 45 to 54 Years | 35 (14.1%) | 141 (56.9%) |
| 55 to 64 Years | 93 (41.5%) | 142 (63.4%) |
| 65 to 74 Years | 235 (88.7%) | 145 (54.7%) |
| 75 Years and over | 139 (100.0%) | 109 (78.4%) |
| Total | 871 (40.9%) | 1,362 (64.0%) |
Disability Status by Sex by Age in Lake Odessa
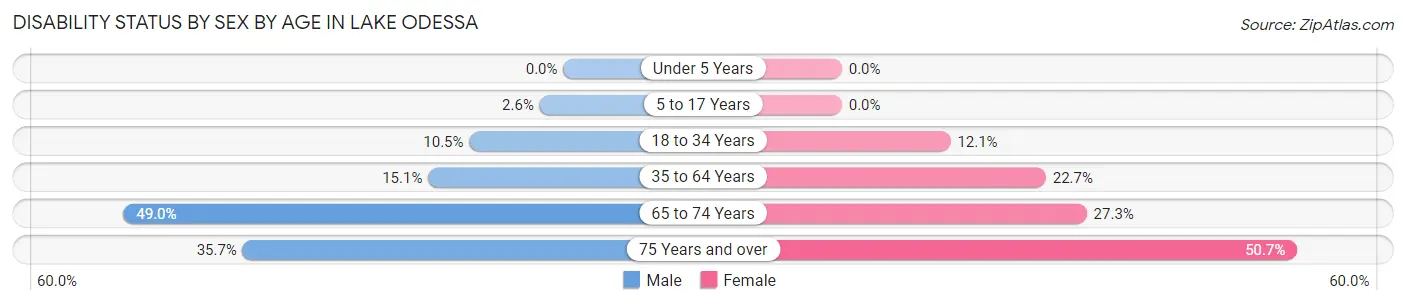
| Age Bracket | Male | Female |
| Under 5 Years | 0 (0.0%) | 0 (0.0%) |
| 5 to 17 Years | 6 (2.6%) | 0 (0.0%) |
| 18 to 34 Years | 27 (10.5%) | 38 (12.1%) |
| 35 to 64 Years | 45 (15.0%) | 87 (22.7%) |
| 65 to 74 Years | 49 (49.0%) | 45 (27.3%) |
| 75 Years and over | 25 (35.7%) | 35 (50.7%) |
Disability Class by Sex by Age in Lake Odessa
Disability Class: Hearing Difficulty
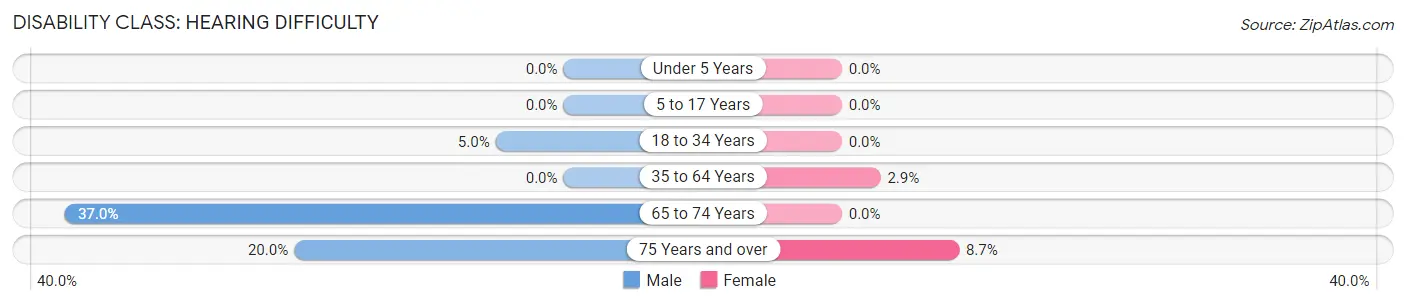
| Age Bracket | Male | Female |
| Under 5 Years | 0 (0.0%) | 0 (0.0%) |
| 5 to 17 Years | 0 (0.0%) | 0 (0.0%) |
| 18 to 34 Years | 13 (5.0%) | 0 (0.0%) |
| 35 to 64 Years | 0 (0.0%) | 11 (2.9%) |
| 65 to 74 Years | 37 (37.0%) | 0 (0.0%) |
| 75 Years and over | 14 (20.0%) | 6 (8.7%) |
Disability Class: Vision Difficulty
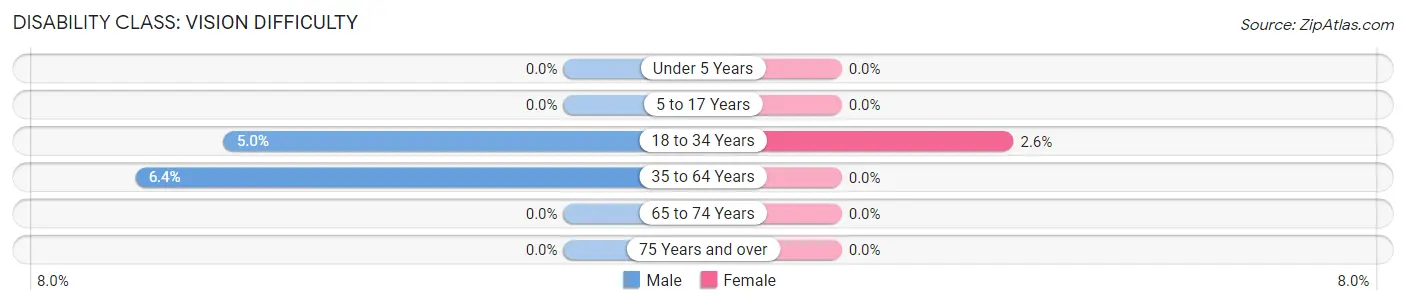
| Age Bracket | Male | Female |
| Under 5 Years | 0 (0.0%) | 0 (0.0%) |
| 5 to 17 Years | 0 (0.0%) | 0 (0.0%) |
| 18 to 34 Years | 13 (5.0%) | 8 (2.5%) |
| 35 to 64 Years | 19 (6.4%) | 0 (0.0%) |
| 65 to 74 Years | 0 (0.0%) | 0 (0.0%) |
| 75 Years and over | 0 (0.0%) | 0 (0.0%) |
Disability Class: Cognitive Difficulty
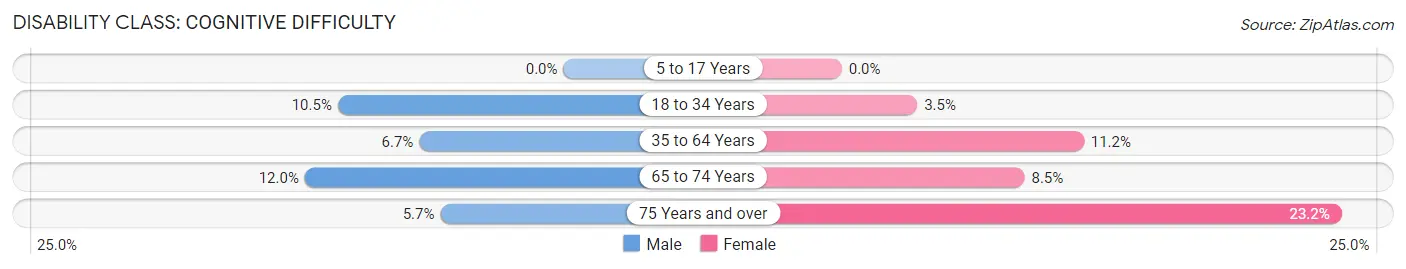
| Age Bracket | Male | Female |
| 5 to 17 Years | 0 (0.0%) | 0 (0.0%) |
| 18 to 34 Years | 27 (10.5%) | 11 (3.5%) |
| 35 to 64 Years | 20 (6.7%) | 43 (11.2%) |
| 65 to 74 Years | 12 (12.0%) | 14 (8.5%) |
| 75 Years and over | 4 (5.7%) | 16 (23.2%) |
Disability Class: Ambulatory Difficulty
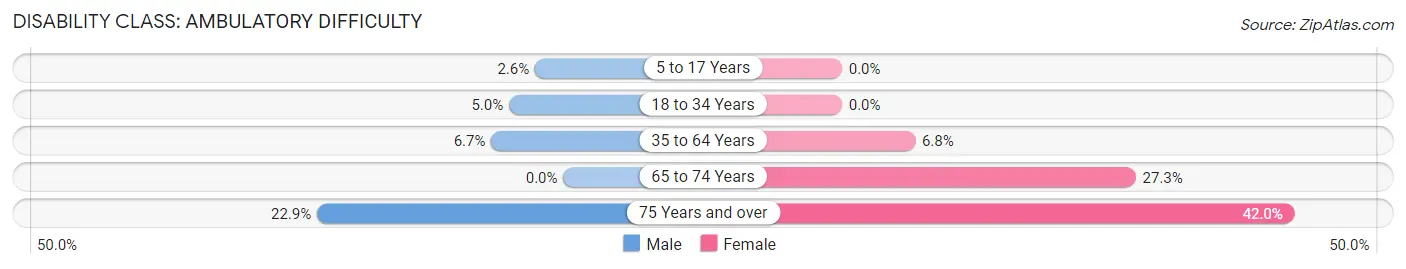
| Age Bracket | Male | Female |
| 5 to 17 Years | 6 (2.6%) | 0 (0.0%) |
| 18 to 34 Years | 13 (5.0%) | 0 (0.0%) |
| 35 to 64 Years | 20 (6.7%) | 26 (6.8%) |
| 65 to 74 Years | 0 (0.0%) | 45 (27.3%) |
| 75 Years and over | 16 (22.9%) | 29 (42.0%) |
Disability Class: Self-Care Difficulty
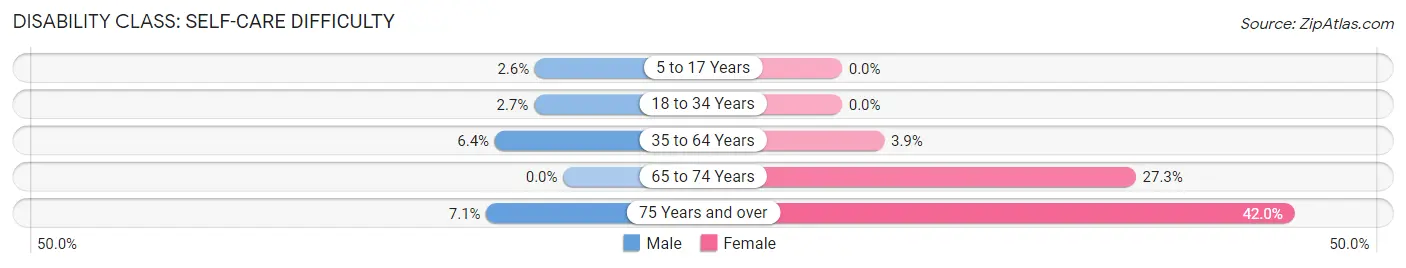
| Age Bracket | Male | Female |
| 5 to 17 Years | 6 (2.6%) | 0 (0.0%) |
| 18 to 34 Years | 7 (2.7%) | 0 (0.0%) |
| 35 to 64 Years | 19 (6.4%) | 15 (3.9%) |
| 65 to 74 Years | 0 (0.0%) | 45 (27.3%) |
| 75 Years and over | 5 (7.1%) | 29 (42.0%) |
Technology Access in Lake Odessa
Computing Device Access in Lake Odessa
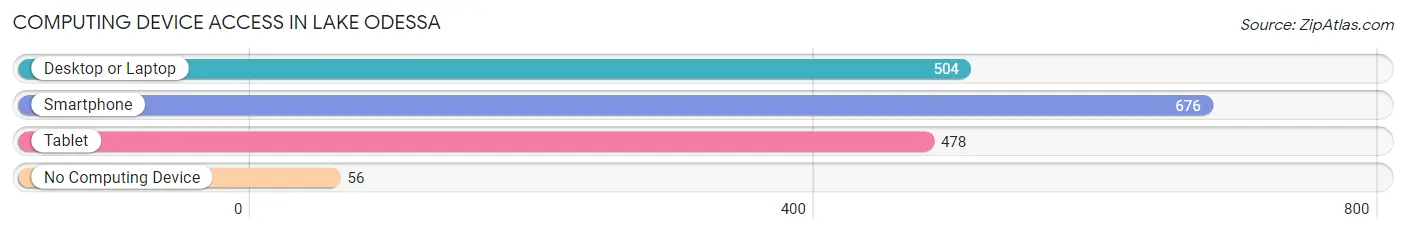
| Device Type | # Households | % Households |
| Desktop or Laptop | 504 | 66.6% |
| Smartphone | 676 | 89.3% |
| Tablet | 478 | 63.1% |
| No Computing Device | 56 | 7.4% |
| Total | 757 | 100.0% |
Internet Access in Lake Odessa
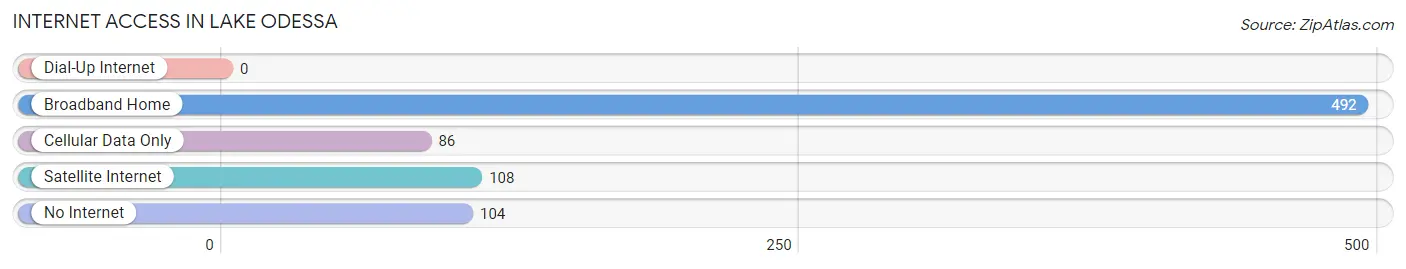
| Internet Type | # Households | % Households |
| Dial-Up Internet | 0 | 0.0% |
| Broadband Home | 492 | 65.0% |
| Cellular Data Only | 86 | 11.4% |
| Satellite Internet | 108 | 14.3% |
| No Internet | 104 | 13.7% |
| Total | 757 | 100.0% |
Lake Odessa Summary
History
The area now known as Lake Odessa, Michigan was first settled in 1837 by a group of pioneers from New York. The settlement was originally called “Odessa” after the city of Odessa in Ukraine. The name was changed to Lake Odessa in 1871 when a lake was created in the area.
The town was officially incorporated in 1887 and was primarily an agricultural community. The main crops grown in the area were wheat, corn, and oats. The town also had a number of small businesses, including a sawmill, a grist mill, and a blacksmith shop.
In the early 1900s, the town began to grow and develop. The first school was built in 1902 and the first bank opened in 1904. The town also had a number of churches, including the First Presbyterian Church, which was founded in 1906.
In the 1920s, the town began to expand and the population grew. The first paved road was built in 1923 and the first telephone service was established in 1924. The town also had a number of businesses, including a grocery store, a hardware store, and a movie theater.
In the 1950s, the town continued to grow and develop. The first hospital was built in 1952 and the first shopping center was built in 1956. The town also had a number of businesses, including a bowling alley, a drive-in theater, and a number of restaurants.
In the 1970s, the town began to decline as many of the businesses closed or moved away. The population also began to decline as people moved away to larger cities.
Geography
Lake Odessa is located in Ionia County, Michigan. It is situated on the eastern shore of Lake Odessa, which is a small lake that was created in 1871. The town is located about 25 miles east of Grand Rapids and about 50 miles west of Lansing.
The town has a total area of 1.3 square miles, all of which is land. The terrain is mostly flat with some rolling hills. The town is located in a rural area and is surrounded by farmland.
Economy
The economy of Lake Odessa is primarily based on agriculture. The main crops grown in the area are wheat, corn, and oats. The town also has a number of small businesses, including a grocery store, a hardware store, and a number of restaurants.
The town also has a number of manufacturing businesses, including a plastics factory and a metal fabrication plant. The town also has a number of service businesses, including a bank, a post office, and a number of medical offices.
Demographics
As of the 2010 census, the population of Lake Odessa was 1,845. The racial makeup of the town was 97.3% White, 0.7% African American, 0.2% Native American, 0.2% Asian, 0.1% from other races, and 1.5% from two or more races. Hispanic or Latino of any race were 1.2% of the population.
The median household income in the town was $41,250 and the median family income was $50,000. The per capita income in the town was $20,845. About 10.3% of the population was below the poverty line.
Common Questions
What is the Total Population of Lake Odessa?
Total Population of Lake Odessa is 2,129.
What is the Total Male Population of Lake Odessa?
Total Male Population of Lake Odessa is 1,008.
What is the Total Female Population of Lake Odessa?
Total Female Population of Lake Odessa is 1,121.
What is the Ratio of Males per 100 Females in Lake Odessa?
There are 89.92 Males per 100 Females in Lake Odessa.
What is the Ratio of Females per 100 Males in Lake Odessa?
There are 111.21 Females per 100 Males in Lake Odessa.
What is the Median Population Age in Lake Odessa?
Median Population Age in Lake Odessa is 36.0 Years.
What is the Average Family Size in Lake Odessa
Average Family Size in Lake Odessa is 3.4 People.
What is the Average Household Size in Lake Odessa
Average Household Size in Lake Odessa is 2.8 People.
What is Per Capita Income in Lake Odessa?
Per Capita income in Lake Odessa is $33,726.
What is the Median Family Income in Lake Odessa?
Median Family Income in Lake Odessa is $83,177.
What is the Median Household income in Lake Odessa?
Median Household Income in Lake Odessa is $66,397.
What is Income or Wage Gap in Lake Odessa?
Income or Wage Gap in Lake Odessa is 55.8%.
Women in Lake Odessa earn 44.2 cents for every dollar earned by a man.
What is Inequality or Gini Index in Lake Odessa?
Inequality or Gini Index in Lake Odessa is 0.47.
How Large is the Labor Force in Lake Odessa?
There are 1,084 People in the Labor Forcein in Lake Odessa.
What is the Percentage of People in the Labor Force in Lake Odessa?
63.8% of People are in the Labor Force in Lake Odessa.
What is the Unemployment Rate in Lake Odessa?
Unemployment Rate in Lake Odessa is 5.6%.