Cities with the Most Immigrants from Northern Europe in Michigan
RELATED REPORTS & OPTIONS
Northern Europe
Michigan
Compare Cities
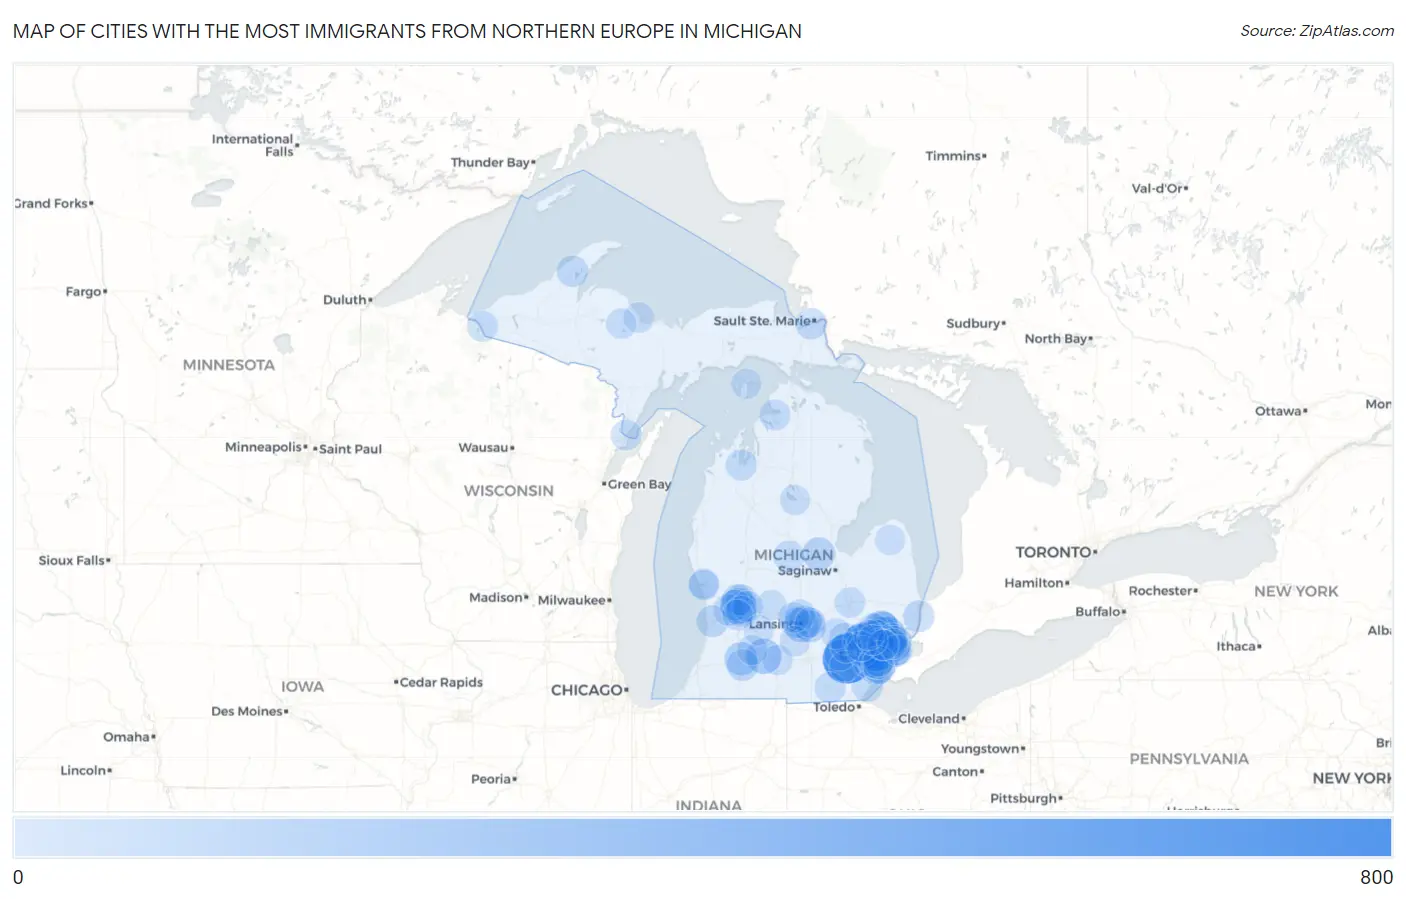
Map of Cities with the Most Immigrants from Northern Europe in Michigan
0
800
Cities with the Most Immigrants from Northern Europe in Michigan
| City | Northern Europe | vs State | vs National | |
| 1. | Ann Arbor | 734 | 16,611(4.42%)#1 | 944,917(0.08%)#130 |
| 2. | Farmington Hills | 378 | 16,611(2.28%)#2 | 944,917(0.04%)#311 |
| 3. | Novi | 275 | 16,611(1.66%)#3 | 944,917(0.03%)#461 |
| 4. | Livonia | 253 | 16,611(1.52%)#4 | 944,917(0.03%)#511 |
| 5. | Sterling Heights | 236 | 16,611(1.42%)#5 | 944,917(0.02%)#573 |
| 6. | Troy | 234 | 16,611(1.41%)#6 | 944,917(0.02%)#582 |
| 7. | Grand Rapids | 231 | 16,611(1.39%)#7 | 944,917(0.02%)#589 |
| 8. | Rochester Hills | 231 | 16,611(1.39%)#8 | 944,917(0.02%)#591 |
| 9. | Detroit | 203 | 16,611(1.22%)#9 | 944,917(0.02%)#689 |
| 10. | Battle Creek | 199 | 16,611(1.20%)#10 | 944,917(0.02%)#705 |
| 11. | Royal Oak | 187 | 16,611(1.13%)#11 | 944,917(0.02%)#751 |
| 12. | Southfield | 174 | 16,611(1.05%)#12 | 944,917(0.02%)#796 |
| 13. | Birmingham | 171 | 16,611(1.03%)#13 | 944,917(0.02%)#816 |
| 14. | Lansing | 165 | 16,611(0.99%)#14 | 944,917(0.02%)#845 |
| 15. | Warren | 148 | 16,611(0.89%)#15 | 944,917(0.02%)#968 |
| 16. | East Lansing | 131 | 16,611(0.79%)#16 | 944,917(0.01%)#1,101 |
| 17. | Kalamazoo | 129 | 16,611(0.78%)#17 | 944,917(0.01%)#1,120 |
| 18. | St Clair Shores | 118 | 16,611(0.71%)#18 | 944,917(0.01%)#1,217 |
| 19. | Midland | 114 | 16,611(0.69%)#19 | 944,917(0.01%)#1,259 |
| 20. | Okemos | 87 | 16,611(0.52%)#20 | 944,917(0.01%)#1,660 |
| 21. | Portage | 77 | 16,611(0.46%)#21 | 944,917(0.01%)#1,800 |
| 22. | Holland | 77 | 16,611(0.46%)#22 | 944,917(0.01%)#1,801 |
| 23. | East Grand Rapids | 76 | 16,611(0.46%)#23 | 944,917(0.01%)#1,828 |
| 24. | Beverly Hills | 76 | 16,611(0.46%)#24 | 944,917(0.01%)#1,829 |
| 25. | Rochester | 70 | 16,611(0.42%)#25 | 944,917(0.01%)#1,945 |
| 26. | Madison Heights | 69 | 16,611(0.42%)#26 | 944,917(0.01%)#1,964 |
| 27. | Brighton | 66 | 16,611(0.40%)#27 | 944,917(0.01%)#2,044 |
| 28. | Westland | 65 | 16,611(0.39%)#28 | 944,917(0.01%)#2,051 |
| 29. | Allen Park | 64 | 16,611(0.39%)#29 | 944,917(0.01%)#2,076 |
| 30. | Wyandotte | 63 | 16,611(0.38%)#30 | 944,917(0.01%)#2,100 |
| 31. | Grosse Pointe | 62 | 16,611(0.37%)#31 | 944,917(0.01%)#2,151 |
| 32. | Inkster | 61 | 16,611(0.37%)#32 | 944,917(0.01%)#2,167 |
| 33. | Houghton | 61 | 16,611(0.37%)#33 | 944,917(0.01%)#2,182 |
| 34. | Grosse Pointe Park | 60 | 16,611(0.36%)#34 | 944,917(0.01%)#2,204 |
| 35. | Northview | 59 | 16,611(0.36%)#35 | 944,917(0.01%)#2,234 |
| 36. | Garden City | 58 | 16,611(0.35%)#36 | 944,917(0.01%)#2,258 |
| 37. | Jenison | 58 | 16,611(0.35%)#37 | 944,917(0.01%)#2,266 |
| 38. | St Clair | 58 | 16,611(0.35%)#38 | 944,917(0.01%)#2,273 |
| 39. | Sault Ste Marie | 56 | 16,611(0.34%)#39 | 944,917(0.01%)#2,332 |
| 40. | Mount Pleasant | 54 | 16,611(0.33%)#40 | 944,917(0.01%)#2,386 |
| 41. | Monroe | 54 | 16,611(0.33%)#41 | 944,917(0.01%)#2,390 |
| 42. | Romulus | 53 | 16,611(0.32%)#42 | 944,917(0.01%)#2,427 |
| 43. | Clawson | 53 | 16,611(0.32%)#43 | 944,917(0.01%)#2,437 |
| 44. | Comstock Park | 52 | 16,611(0.31%)#44 | 944,917(0.01%)#2,473 |
| 45. | Bloomfield Hills | 52 | 16,611(0.31%)#45 | 944,917(0.01%)#2,484 |
| 46. | Waverly | 51 | 16,611(0.31%)#46 | 944,917(0.01%)#2,504 |
| 47. | Traverse City | 51 | 16,611(0.31%)#47 | 944,917(0.01%)#2,513 |
| 48. | Riverview | 51 | 16,611(0.31%)#48 | 944,917(0.01%)#2,514 |
| 49. | Dexter | 51 | 16,611(0.31%)#49 | 944,917(0.01%)#2,529 |
| 50. | Berkley | 50 | 16,611(0.30%)#50 | 944,917(0.01%)#2,547 |
| 51. | Adrian | 48 | 16,611(0.29%)#51 | 944,917(0.01%)#2,619 |
| 52. | Wixom | 48 | 16,611(0.29%)#52 | 944,917(0.01%)#2,621 |
| 53. | Woodhaven | 47 | 16,611(0.28%)#53 | 944,917(0.00%)#2,654 |
| 54. | Walker | 43 | 16,611(0.26%)#54 | 944,917(0.00%)#2,803 |
| 55. | Auburn Hills | 43 | 16,611(0.26%)#55 | 944,917(0.00%)#2,804 |
| 56. | Petoskey | 41 | 16,611(0.25%)#56 | 944,917(0.00%)#2,901 |
| 57. | Dewitt | 41 | 16,611(0.25%)#57 | 944,917(0.00%)#2,904 |
| 58. | Pleasant Ridge | 41 | 16,611(0.25%)#58 | 944,917(0.00%)#2,908 |
| 59. | Grosse Pointe Woods | 40 | 16,611(0.24%)#59 | 944,917(0.00%)#2,926 |
| 60. | Ironwood | 40 | 16,611(0.24%)#60 | 944,917(0.00%)#2,949 |
| 61. | Kentwood | 39 | 16,611(0.23%)#61 | 944,917(0.00%)#2,963 |
| 62. | Roseville | 39 | 16,611(0.23%)#62 | 944,917(0.00%)#2,964 |
| 63. | Menominee | 39 | 16,611(0.23%)#63 | 944,917(0.00%)#2,984 |
| 64. | Dearborn Heights | 38 | 16,611(0.23%)#64 | 944,917(0.00%)#3,010 |
| 65. | Saline | 38 | 16,611(0.23%)#65 | 944,917(0.00%)#3,042 |
| 66. | Fraser | 37 | 16,611(0.22%)#66 | 944,917(0.00%)#3,075 |
| 67. | Oak Park | 36 | 16,611(0.22%)#67 | 944,917(0.00%)#3,127 |
| 68. | Wolverine Lake | 35 | 16,611(0.21%)#68 | 944,917(0.00%)#3,198 |
| 69. | Dearborn | 34 | 16,611(0.20%)#69 | 944,917(0.00%)#3,211 |
| 70. | Forest Hills | 33 | 16,611(0.20%)#70 | 944,917(0.00%)#3,290 |
| 71. | Trenton | 33 | 16,611(0.20%)#71 | 944,917(0.00%)#3,299 |
| 72. | Plymouth | 33 | 16,611(0.20%)#72 | 944,917(0.00%)#3,318 |
| 73. | Flint | 32 | 16,611(0.19%)#73 | 944,917(0.00%)#3,350 |
| 74. | Taylor | 32 | 16,611(0.19%)#74 | 944,917(0.00%)#3,352 |
| 75. | Ferndale | 32 | 16,611(0.19%)#75 | 944,917(0.00%)#3,357 |
| 76. | Cutlerville | 31 | 16,611(0.19%)#76 | 944,917(0.00%)#3,422 |
| 77. | Howell | 31 | 16,611(0.19%)#77 | 944,917(0.00%)#3,437 |
| 78. | Southgate | 30 | 16,611(0.18%)#78 | 944,917(0.00%)#3,481 |
| 79. | Whitmore Lake | 30 | 16,611(0.18%)#79 | 944,917(0.00%)#3,504 |
| 80. | Wacousta | 29 | 16,611(0.17%)#80 | 944,917(0.00%)#3,599 |
| 81. | Lincoln Park | 28 | 16,611(0.17%)#81 | 944,917(0.00%)#3,610 |
| 82. | Marquette | 28 | 16,611(0.17%)#82 | 944,917(0.00%)#3,619 |
| 83. | Eaton Rapids | 28 | 16,611(0.17%)#83 | 944,917(0.00%)#3,642 |
| 84. | North Muskegon | 28 | 16,611(0.17%)#84 | 944,917(0.00%)#3,647 |
| 85. | Grosse Pointe Farms | 27 | 16,611(0.16%)#85 | 944,917(0.00%)#3,695 |
| 86. | Eastpointe | 26 | 16,611(0.16%)#86 | 944,917(0.00%)#3,743 |
| 87. | Muskegon | 25 | 16,611(0.15%)#87 | 944,917(0.00%)#3,812 |
| 88. | West Ishpeming | 25 | 16,611(0.15%)#88 | 944,917(0.00%)#3,875 |
| 89. | Hazel Park | 24 | 16,611(0.14%)#89 | 944,917(0.00%)#3,915 |
| 90. | Northville | 23 | 16,611(0.14%)#90 | 944,917(0.00%)#4,034 |
| 91. | Hastings | 22 | 16,611(0.13%)#91 | 944,917(0.00%)#4,124 |
| 92. | Ionia | 21 | 16,611(0.13%)#92 | 944,917(0.00%)#4,190 |
| 93. | Orchard Lake Village | 21 | 16,611(0.13%)#93 | 944,917(0.00%)#4,247 |
| 94. | Marshall | 20 | 16,611(0.12%)#94 | 944,917(0.00%)#4,314 |
| 95. | South Gull Lake | 20 | 16,611(0.12%)#95 | 944,917(0.00%)#4,366 |
| 96. | Prudenville | 19 | 16,611(0.11%)#96 | 944,917(0.00%)#4,470 |
| 97. | Haslett | 18 | 16,611(0.11%)#97 | 944,917(0.00%)#4,500 |
| 98. | Bad Axe | 18 | 16,611(0.11%)#98 | 944,917(0.00%)#4,575 |
| 99. | Franklin | 18 | 16,611(0.11%)#99 | 944,917(0.00%)#4,580 |
| 100. | St James | 18 | 16,611(0.11%)#100 | 944,917(0.00%)#4,614 |
Common Questions
What are the Top 10 Cities with the Most Immigrants from Northern Europe in Michigan?
Top 10 Cities with the Most Immigrants from Northern Europe in Michigan are:
#1
734
#2
378
#3
275
#4
253
#5
236
#6
234
#7
231
#8
231
#9
203
#10
199
What city has the Most Immigrants from Northern Europe in Michigan?
Ann Arbor has the Most Immigrants from Northern Europe in Michigan with 734.
What is the Total Immigrants from Northern Europe in the State of Michigan?
Total Immigrants from Northern Europe in Michigan is 16,611.
What is the Total Immigrants from Northern Europe in the United States?
Total Immigrants from Northern Europe in the United States is 944,917.