Cities with the Highest Percentage of Population Employed in Mining, Quarrying, & Extraction in Michigan
RELATED REPORTS & OPTIONS
Mining, Quarrying, & Extraction
Michigan
Compare Cities
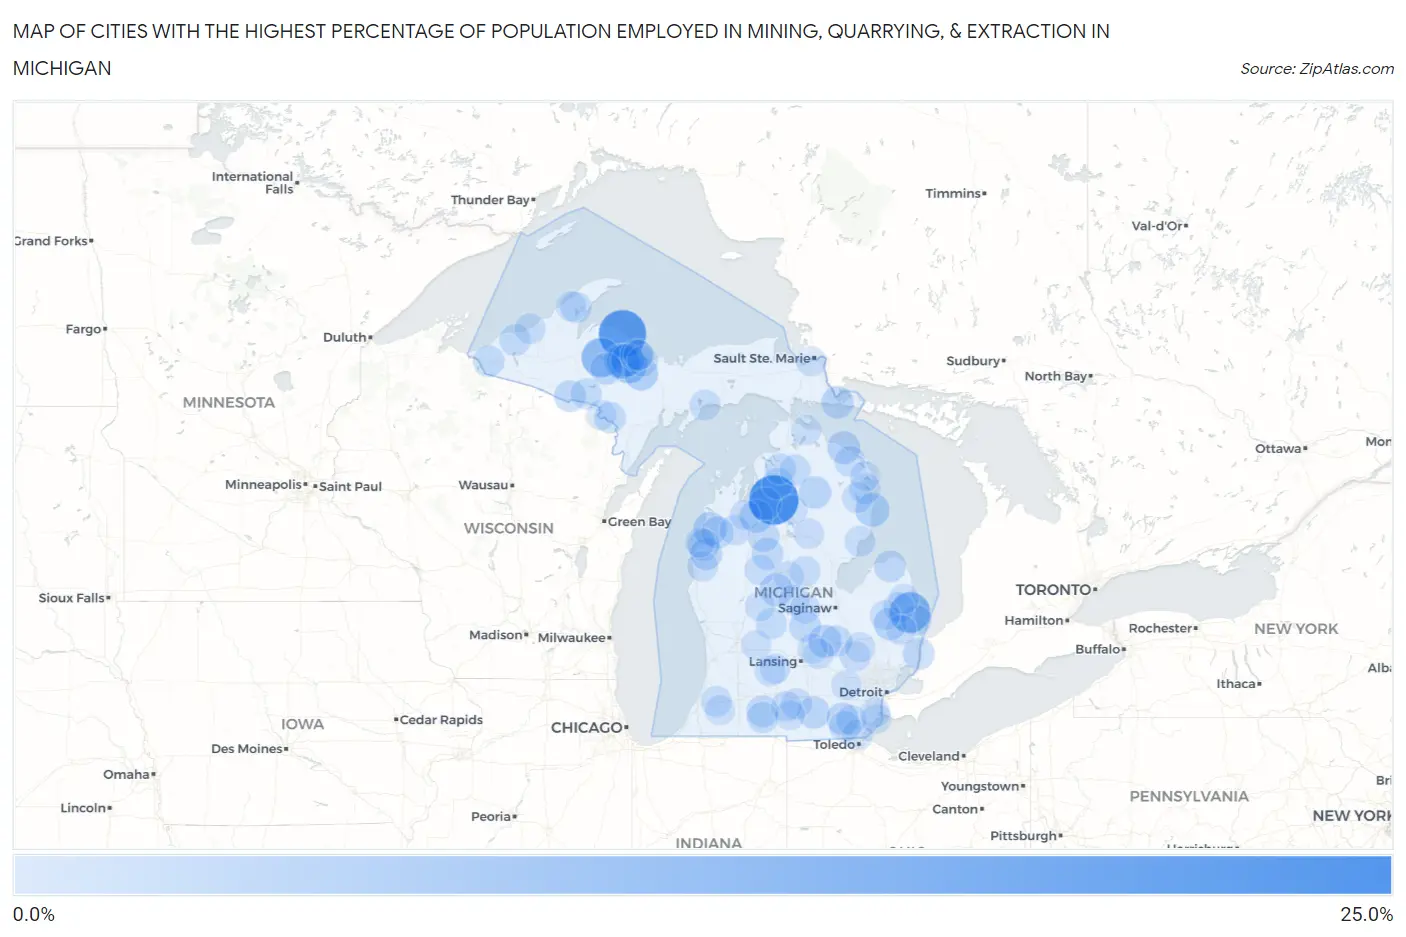
Map of Cities with the Highest Percentage of Population Employed in Mining, Quarrying, & Extraction in Michigan
0.0%
25.0%
Cities with the Highest Percentage of Population Employed in Mining, Quarrying, & Extraction in Michigan
| City | % Employed | vs State | vs National | |
| 1. | Three Lakes | 21.2% | 0.12%(+21.1)#1 | 0.44%(+20.8)#222 |
| 2. | Manistee Lake | 20.8% | 0.12%(+20.7)#2 | 0.44%(+20.3)#232 |
| 3. | Big Bay | 18.5% | 0.12%(+18.4)#3 | 0.44%(+18.0)#288 |
| 4. | Applegate | 11.3% | 0.12%(+11.2)#4 | 0.44%(+10.9)#650 |
| 5. | Michigamme | 9.9% | 0.12%(+9.74)#5 | 0.44%(+9.42)#770 |
| 6. | Palmer | 6.9% | 0.12%(+6.76)#6 | 0.44%(+6.44)#1,180 |
| 7. | Ewen | 6.5% | 0.12%(+6.38)#7 | 0.44%(+6.06)#1,248 |
| 8. | Crystal | 6.4% | 0.12%(+6.32)#8 | 0.44%(+6.00)#1,263 |
| 9. | Rockland | 6.1% | 0.12%(+5.94)#9 | 0.44%(+5.62)#1,345 |
| 10. | West Ishpeming | 5.5% | 0.12%(+5.35)#10 | 0.44%(+5.03)#1,480 |
| 11. | Trimountain | 5.0% | 0.12%(+4.88)#11 | 0.44%(+4.56)#1,604 |
| 12. | Ishpeming | 4.8% | 0.12%(+4.71)#12 | 0.44%(+4.39)#1,649 |
| 13. | Harrisville | 4.2% | 0.12%(+4.12)#13 | 0.44%(+3.80)#1,847 |
| 14. | K I Sawyer | 4.0% | 0.12%(+3.87)#14 | 0.44%(+3.55)#1,950 |
| 15. | Bear Lake | 3.8% | 0.12%(+3.65)#15 | 0.44%(+3.33)#2,044 |
| 16. | Fife Lake | 3.4% | 0.12%(+3.27)#16 | 0.44%(+2.95)#2,256 |
| 17. | Negaunee | 3.3% | 0.12%(+3.20)#17 | 0.44%(+2.88)#2,292 |
| 18. | Lake Isabella | 3.2% | 0.12%(+3.10)#18 | 0.44%(+2.78)#2,356 |
| 19. | Rogers City | 3.2% | 0.12%(+3.10)#19 | 0.44%(+2.77)#2,358 |
| 20. | Kalkaska | 3.2% | 0.12%(+3.07)#20 | 0.44%(+2.75)#2,376 |
| 21. | Middletown | 3.0% | 0.12%(+2.87)#21 | 0.44%(+2.55)#2,493 |
| 22. | Brown City | 3.0% | 0.12%(+2.86)#22 | 0.44%(+2.53)#2,504 |
| 23. | Lewiston | 2.8% | 0.12%(+2.65)#23 | 0.44%(+2.33)#2,633 |
| 24. | De Tour Village | 2.7% | 0.12%(+2.62)#24 | 0.44%(+2.30)#2,663 |
| 25. | Palo | 2.6% | 0.12%(+2.51)#25 | 0.44%(+2.19)#2,755 |
| 26. | Cement City | 2.5% | 0.12%(+2.39)#26 | 0.44%(+2.07)#2,848 |
| 27. | Britton | 2.4% | 0.12%(+2.27)#27 | 0.44%(+1.95)#2,941 |
| 28. | Free Soil | 2.4% | 0.12%(+2.26)#28 | 0.44%(+1.94)#2,956 |
| 29. | Trowbridge Park | 2.2% | 0.12%(+2.11)#29 | 0.44%(+1.79)#3,061 |
| 30. | Republic | 2.2% | 0.12%(+2.10)#30 | 0.44%(+1.78)#3,068 |
| 31. | Kaleva | 2.2% | 0.12%(+2.05)#31 | 0.44%(+1.73)#3,106 |
| 32. | Athens | 2.1% | 0.12%(+2.02)#32 | 0.44%(+1.69)#3,143 |
| 33. | Stronach | 2.1% | 0.12%(+1.96)#33 | 0.44%(+1.64)#3,185 |
| 34. | Marion | 2.0% | 0.12%(+1.89)#34 | 0.44%(+1.57)#3,257 |
| 35. | Gaastra | 1.9% | 0.12%(+1.80)#35 | 0.44%(+1.48)#3,335 |
| 36. | St Clair | 1.9% | 0.12%(+1.79)#36 | 0.44%(+1.47)#3,345 |
| 37. | Kinde | 1.9% | 0.12%(+1.78)#37 | 0.44%(+1.46)#3,364 |
| 38. | Ashley | 1.9% | 0.12%(+1.75)#38 | 0.44%(+1.43)#3,396 |
| 39. | Bessemer | 1.8% | 0.12%(+1.66)#39 | 0.44%(+1.34)#3,484 |
| 40. | Lennon | 1.8% | 0.12%(+1.64)#40 | 0.44%(+1.31)#3,505 |
| 41. | White Pine | 1.7% | 0.12%(+1.58)#41 | 0.44%(+1.25)#3,563 |
| 42. | Lake City | 1.6% | 0.12%(+1.47)#42 | 0.44%(+1.15)#3,706 |
| 43. | Alba | 1.6% | 0.12%(+1.45)#43 | 0.44%(+1.13)#3,735 |
| 44. | Norway | 1.5% | 0.12%(+1.41)#44 | 0.44%(+1.08)#3,792 |
| 45. | Sherwood | 1.5% | 0.12%(+1.36)#45 | 0.44%(+1.04)#3,848 |
| 46. | Dollar Bay | 1.5% | 0.12%(+1.35)#46 | 0.44%(+1.03)#3,859 |
| 47. | Deerfield | 1.4% | 0.12%(+1.31)#47 | 0.44%(+0.991)#3,904 |
| 48. | Ossineke | 1.4% | 0.12%(+1.25)#48 | 0.44%(+0.930)#3,988 |
| 49. | Boyne Falls | 1.3% | 0.12%(+1.19)#49 | 0.44%(+0.867)#4,078 |
| 50. | Crystal Falls | 1.3% | 0.12%(+1.14)#50 | 0.44%(+0.818)#4,139 |
| 51. | Vanderbilt | 1.3% | 0.12%(+1.14)#51 | 0.44%(+0.815)#4,148 |
| 52. | Sheridan | 1.2% | 0.12%(+1.12)#52 | 0.44%(+0.794)#4,181 |
| 53. | Posen | 1.2% | 0.12%(+1.06)#53 | 0.44%(+0.736)#4,290 |
| 54. | Concord | 1.1% | 0.12%(+1.02)#54 | 0.44%(+0.698)#4,333 |
| 55. | Temperance | 1.1% | 0.12%(+1.00)#55 | 0.44%(+0.683)#4,361 |
| 56. | Tawas City | 1.1% | 0.12%(+1.00)#56 | 0.44%(+0.680)#4,370 |
| 57. | Lexington | 1.0% | 0.12%(+0.910)#57 | 0.44%(+0.589)#4,510 |
| 58. | Manistique | 1.0% | 0.12%(+0.893)#58 | 0.44%(+0.571)#4,543 |
| 59. | Harvey | 1.0% | 0.12%(+0.890)#59 | 0.44%(+0.569)#4,549 |
| 60. | Hubbard Lake | 1.00% | 0.12%(+0.876)#60 | 0.44%(+0.555)#4,576 |
| 61. | Ontonagon | 0.95% | 0.12%(+0.836)#61 | 0.44%(+0.514)#4,660 |
| 62. | Lawrence | 0.94% | 0.12%(+0.822)#62 | 0.44%(+0.501)#4,676 |
| 63. | Beaverton | 0.92% | 0.12%(+0.796)#63 | 0.44%(+0.475)#4,714 |
| 64. | Sandusky | 0.88% | 0.12%(+0.764)#64 | 0.44%(+0.443)#4,775 |
| 65. | Scottville | 0.87% | 0.12%(+0.750)#65 | 0.44%(+0.429)#4,796 |
| 66. | Evart | 0.81% | 0.12%(+0.689)#66 | 0.44%(+0.367)#4,923 |
| 67. | Homer | 0.77% | 0.12%(+0.654)#67 | 0.44%(+0.333)#4,991 |
| 68. | Holly | 0.77% | 0.12%(+0.647)#68 | 0.44%(+0.326)#5,012 |
| 69. | Mesick | 0.75% | 0.12%(+0.633)#69 | 0.44%(+0.312)#5,041 |
| 70. | St Helen | 0.75% | 0.12%(+0.626)#70 | 0.44%(+0.305)#5,058 |
| 71. | Marquette | 0.73% | 0.12%(+0.609)#71 | 0.44%(+0.288)#5,112 |
| 72. | Nashville | 0.73% | 0.12%(+0.607)#72 | 0.44%(+0.285)#5,122 |
| 73. | Dundee | 0.71% | 0.12%(+0.592)#73 | 0.44%(+0.271)#5,163 |
| 74. | Shepherd | 0.71% | 0.12%(+0.586)#74 | 0.44%(+0.265)#5,188 |
| 75. | Trufant | 0.65% | 0.12%(+0.532)#75 | 0.44%(+0.211)#5,325 |
| 76. | Vermontville | 0.62% | 0.12%(+0.498)#76 | 0.44%(+0.177)#5,430 |
| 77. | Yale | 0.55% | 0.12%(+0.430)#77 | 0.44%(+0.108)#5,637 |
| 78. | Goodrich | 0.55% | 0.12%(+0.428)#78 | 0.44%(+0.107)#5,643 |
| 79. | Perry | 0.53% | 0.12%(+0.412)#79 | 0.44%(+0.091)#5,692 |
| 80. | Clare | 0.52% | 0.12%(+0.401)#80 | 0.44%(+0.080)#5,717 |
| 81. | Estral Beach | 0.51% | 0.12%(+0.386)#81 | 0.44%(+0.065)#5,757 |
| 82. | Breckenridge | 0.49% | 0.12%(+0.375)#82 | 0.44%(+0.054)#5,797 |
| 83. | Kingsley | 0.48% | 0.12%(+0.358)#83 | 0.44%(+0.037)#5,851 |
| 84. | Deckerville | 0.47% | 0.12%(+0.354)#84 | 0.44%(+0.033)#5,858 |
| 85. | Laingsburg | 0.46% | 0.12%(+0.343)#85 | 0.44%(+0.022)#5,894 |
| 86. | Hancock | 0.46% | 0.12%(+0.342)#86 | 0.44%(+0.021)#5,898 |
| 87. | Dorr | 0.44% | 0.12%(+0.324)#87 | 0.44%(+0.003)#5,959 |
| 88. | Marlette | 0.41% | 0.12%(+0.295)#88 | 0.44%(-0.026)#6,069 |
| 89. | Decatur | 0.40% | 0.12%(+0.280)#89 | 0.44%(-0.041)#6,121 |
| 90. | Cheboygan | 0.40% | 0.12%(+0.280)#90 | 0.44%(-0.041)#6,123 |
| 91. | Manistee | 0.40% | 0.12%(+0.277)#91 | 0.44%(-0.044)#6,138 |
| 92. | South Rockwood | 0.39% | 0.12%(+0.273)#92 | 0.44%(-0.048)#6,156 |
| 93. | Whitmore Lake | 0.38% | 0.12%(+0.264)#93 | 0.44%(-0.057)#6,193 |
| 94. | Grayling | 0.38% | 0.12%(+0.257)#94 | 0.44%(-0.064)#6,221 |
| 95. | Sault Ste Marie | 0.37% | 0.12%(+0.253)#95 | 0.44%(-0.068)#6,236 |
| 96. | Alpena | 0.34% | 0.12%(+0.221)#96 | 0.44%(-0.101)#6,351 |
| 97. | Iron Mountain | 0.33% | 0.12%(+0.208)#97 | 0.44%(-0.114)#6,393 |
| 98. | Lowell | 0.32% | 0.12%(+0.206)#98 | 0.44%(-0.115)#6,403 |
| 99. | Litchfield | 0.32% | 0.12%(+0.198)#99 | 0.44%(-0.123)#6,430 |
| 100. | Lakeview | 0.30% | 0.12%(+0.180)#100 | 0.44%(-0.141)#6,492 |
Common Questions
What are the Top 10 Cities with the Highest Percentage of Population Employed in Mining, Quarrying, & Extraction in Michigan?
Top 10 Cities with the Highest Percentage of Population Employed in Mining, Quarrying, & Extraction in Michigan are:
#1
20.8%
#2
18.5%
#3
11.3%
#4
9.9%
#5
6.9%
#6
5.5%
#7
4.8%
#8
4.2%
#9
4.0%
#10
3.8%
What city has the Highest Percentage of Population Employed in Mining, Quarrying, & Extraction in Michigan?
Manistee Lake has the Highest Percentage of Population Employed in Mining, Quarrying, & Extraction in Michigan with 20.8%.
What is the Percentage of Population Employed in Mining, Quarrying, & Extraction in the State of Michigan?
Percentage of Population Employed in Mining, Quarrying, & Extraction in Michigan is 0.12%.
What is the Percentage of Population Employed in Mining, Quarrying, & Extraction in the United States?
Percentage of Population Employed in Mining, Quarrying, & Extraction in the United States is 0.44%.