Cities with the Most Births per 1,000 Women Below Poverty Level in Michigan
RELATED REPORTS & OPTIONS
Highest Birth Rate | Below Poverty
Michigan
Compare Cities
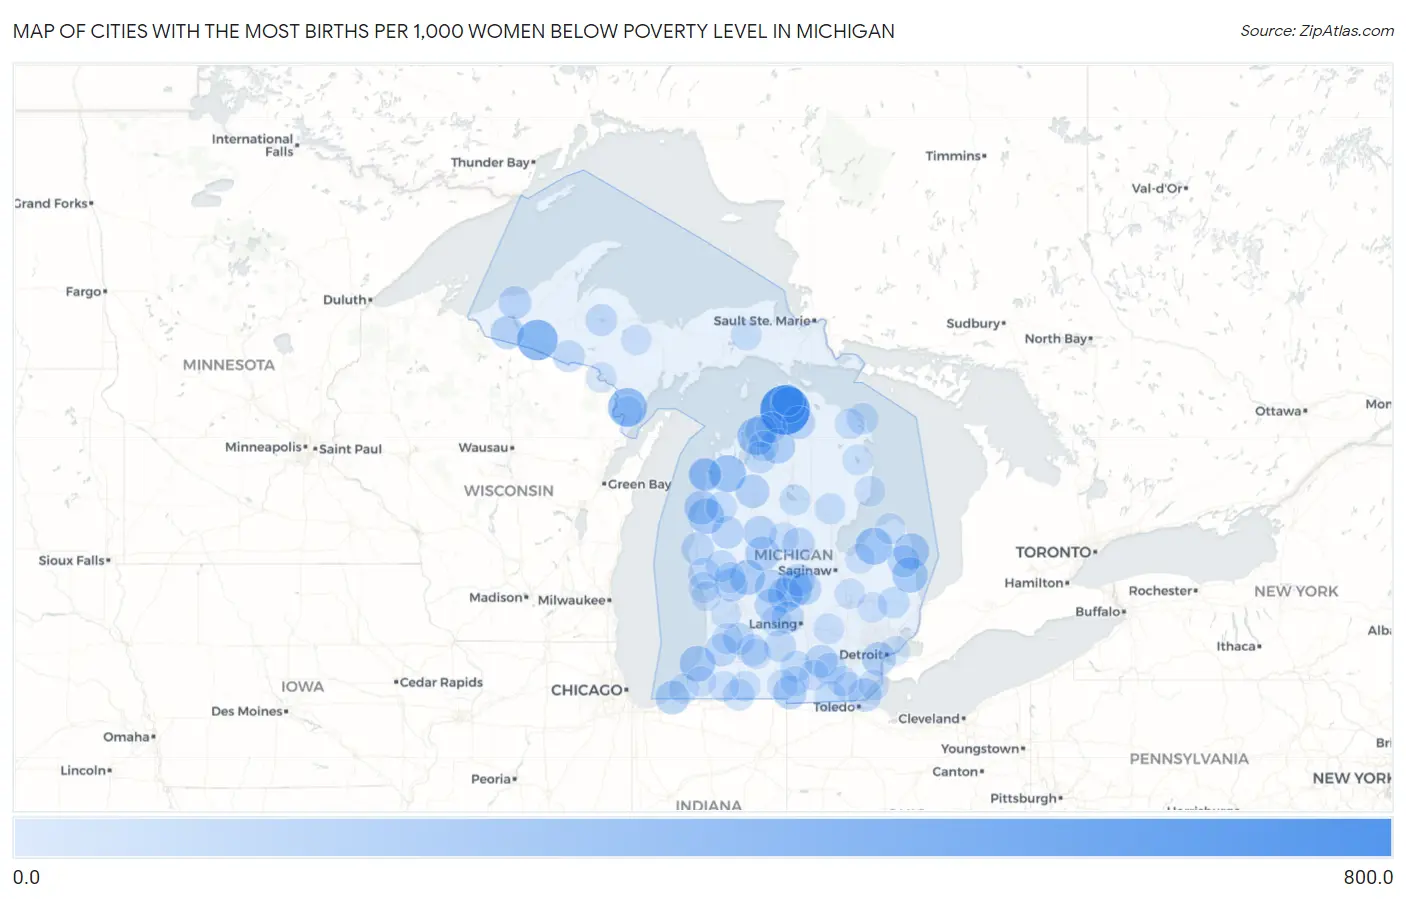
Map of Cities with the Most Births per 1,000 Women Below Poverty Level in Michigan
0.0
800.0
Cities with the Most Births per 1,000 Women Below Poverty Level in Michigan
| City | Births / 1,000 Women | vs State | vs National | |
| 1. | Winn | 632.0 | 53.0(+579)#1 | 53.0(+579)#154 |
| 2. | Oden | 615.0 | 53.0(+562)#2 | 53.0(+562)#165 |
| 3. | Watersmeet | 375.0 | 53.0(+322)#3 | 53.0(+322)#388 |
| 4. | Daggett | 333.0 | 53.0(+280)#4 | 53.0(+280)#488 |
| 5. | Eastport | 298.0 | 53.0(+245)#5 | 53.0(+245)#641 |
| 6. | Ramsay | 286.0 | 53.0(+233)#6 | 53.0(+233)#692 |
| 7. | Bendon | 284.0 | 53.0(+231)#7 | 53.0(+231)#713 |
| 8. | Owendale | 282.0 | 53.0(+229)#8 | 53.0(+229)#718 |
| 9. | Perrinton | 266.0 | 53.0(+213)#9 | 53.0(+213)#794 |
| 10. | Brutus | 255.0 | 53.0(+202)#10 | 53.0(+202)#857 |
| 11. | Forestville | 250.0 | 53.0(+197)#11 | 53.0(+197)#892 |
| 12. | Free Soil | 250.0 | 53.0(+197)#12 | 53.0(+197)#894 |
| 13. | Lake Michigan Beach | 247.0 | 53.0(+194)#13 | 53.0(+194)#918 |
| 14. | Applegate | 240.0 | 53.0(+187)#14 | 53.0(+187)#959 |
| 15. | Pierson | 231.0 | 53.0(+178)#15 | 53.0(+178)#1,032 |
| 16. | Greenland | 231.0 | 53.0(+178)#16 | 53.0(+178)#1,033 |
| 17. | Alba | 225.0 | 53.0(+172)#17 | 53.0(+172)#1,097 |
| 18. | Hubbardston | 224.0 | 53.0(+171)#18 | 53.0(+171)#1,102 |
| 19. | Mohawk | 219.0 | 53.0(+166)#19 | 53.0(+166)#1,151 |
| 20. | Oak Hill | 210.0 | 53.0(+157)#20 | 53.0(+157)#1,237 |
| 21. | Mecosta | 210.0 | 53.0(+157)#21 | 53.0(+157)#1,238 |
| 22. | Michiana | 200.0 | 53.0(+147)#22 | 53.0(+147)#1,331 |
| 23. | Reading | 195.0 | 53.0(+142)#23 | 53.0(+142)#1,396 |
| 24. | Manton | 193.0 | 53.0(+140)#24 | 53.0(+140)#1,426 |
| 25. | Melvindale | 192.0 | 53.0(+139)#25 | 53.0(+139)#1,430 |
| 26. | Marenisco | 192.0 | 53.0(+139)#26 | 53.0(+139)#1,444 |
| 27. | Luna Pier | 187.0 | 53.0(+134)#27 | 53.0(+134)#1,516 |
| 28. | Evart | 185.0 | 53.0(+132)#28 | 53.0(+132)#1,539 |
| 29. | Casnovia | 185.0 | 53.0(+132)#29 | 53.0(+132)#1,548 |
| 30. | Sheridan | 181.0 | 53.0(+128)#30 | 53.0(+128)#1,605 |
| 31. | Ionia | 179.0 | 53.0(+126)#31 | 53.0(+126)#1,627 |
| 32. | Wolverine | 179.0 | 53.0(+126)#32 | 53.0(+126)#1,647 |
| 33. | Grass Lake | 176.0 | 53.0(+123)#33 | 53.0(+123)#1,672 |
| 34. | White Pine | 174.0 | 53.0(+121)#34 | 53.0(+121)#1,717 |
| 35. | Ellsworth | 169.0 | 53.0(+116)#35 | 53.0(+116)#1,815 |
| 36. | Ithaca | 168.0 | 53.0(+115)#36 | 53.0(+115)#1,822 |
| 37. | Frankfort | 168.0 | 53.0(+115)#37 | 53.0(+115)#1,828 |
| 38. | Bloomingdale | 168.0 | 53.0(+115)#38 | 53.0(+115)#1,835 |
| 39. | Ashley | 168.0 | 53.0(+115)#39 | 53.0(+115)#1,836 |
| 40. | Hart | 167.0 | 53.0(+114)#40 | 53.0(+114)#1,840 |
| 41. | Coleman | 167.0 | 53.0(+114)#41 | 53.0(+114)#1,849 |
| 42. | Elberta | 167.0 | 53.0(+114)#42 | 53.0(+114)#1,862 |
| 43. | Baldwin | 165.0 | 53.0(+112)#43 | 53.0(+112)#1,901 |
| 44. | Eagle | 160.0 | 53.0(+107)#44 | 53.0(+107)#2,018 |
| 45. | Deckerville | 158.0 | 53.0(+105)#45 | 53.0(+105)#2,052 |
| 46. | Martin | 157.0 | 53.0(+104)#46 | 53.0(+104)#2,087 |
| 47. | Lakewood Club | 154.0 | 53.0(+101)#47 | 53.0(+101)#2,158 |
| 48. | Michigamme | 154.0 | 53.0(+101)#48 | 53.0(+101)#2,173 |
| 49. | Iron River | 152.0 | 53.0(+99.0)#49 | 53.0(+99.0)#2,218 |
| 50. | Manchester | 152.0 | 53.0(+99.0)#50 | 53.0(+99.0)#2,222 |
| 51. | Fremont | 148.0 | 53.0(+95.0)#51 | 53.0(+95.0)#2,329 |
| 52. | Olivet | 148.0 | 53.0(+95.0)#52 | 53.0(+95.0)#2,338 |
| 53. | South Gull Lake | 148.0 | 53.0(+95.0)#53 | 53.0(+95.0)#2,339 |
| 54. | Pellston | 146.0 | 53.0(+93.0)#54 | 53.0(+93.0)#2,410 |
| 55. | Presque Isle Harbor | 146.0 | 53.0(+93.0)#55 | 53.0(+93.0)#2,411 |
| 56. | Rapid City | 145.0 | 53.0(+92.0)#56 | 53.0(+92.0)#2,435 |
| 57. | Concord | 142.0 | 53.0(+89.0)#57 | 53.0(+89.0)#2,580 |
| 58. | White Pigeon | 141.0 | 53.0(+88.0)#58 | 53.0(+88.0)#2,602 |
| 59. | Capac | 140.0 | 53.0(+87.0)#59 | 53.0(+87.0)#2,624 |
| 60. | Dodgeville | 140.0 | 53.0(+87.0)#60 | 53.0(+87.0)#2,644 |
| 61. | Wellston | 137.0 | 53.0(+84.0)#61 | 53.0(+84.0)#2,742 |
| 62. | Jasper | 135.0 | 53.0(+82.0)#62 | 53.0(+82.0)#2,801 |
| 63. | Allegan | 133.0 | 53.0(+80.0)#63 | 53.0(+80.0)#2,846 |
| 64. | Grant | 133.0 | 53.0(+80.0)#64 | 53.0(+80.0)#2,863 |
| 65. | Prudenville | 131.0 | 53.0(+78.0)#65 | 53.0(+78.0)#2,969 |
| 66. | Skidway Lake | 130.0 | 53.0(+77.0)#66 | 53.0(+77.0)#2,997 |
| 67. | Sunfield | 130.0 | 53.0(+77.0)#67 | 53.0(+77.0)#3,010 |
| 68. | Quincy | 127.0 | 53.0(+74.0)#68 | 53.0(+74.0)#3,142 |
| 69. | Kinde | 127.0 | 53.0(+74.0)#69 | 53.0(+74.0)#3,155 |
| 70. | Roosevelt Park | 125.0 | 53.0(+72.0)#70 | 53.0(+72.0)#3,206 |
| 71. | Bellaire | 125.0 | 53.0(+72.0)#71 | 53.0(+72.0)#3,216 |
| 72. | Advance | 125.0 | 53.0(+72.0)#72 | 53.0(+72.0)#3,225 |
| 73. | Centreville | 124.0 | 53.0(+71.0)#73 | 53.0(+71.0)#3,277 |
| 74. | Petersburg | 124.0 | 53.0(+71.0)#74 | 53.0(+71.0)#3,281 |
| 75. | Newberry | 123.0 | 53.0(+70.0)#75 | 53.0(+70.0)#3,319 |
| 76. | Stephenson | 123.0 | 53.0(+70.0)#76 | 53.0(+70.0)#3,320 |
| 77. | Fowlerville | 122.0 | 53.0(+69.0)#77 | 53.0(+69.0)#3,352 |
| 78. | Stony Point | 122.0 | 53.0(+69.0)#78 | 53.0(+69.0)#3,361 |
| 79. | Posen | 122.0 | 53.0(+69.0)#79 | 53.0(+69.0)#3,388 |
| 80. | Vandalia | 121.0 | 53.0(+68.0)#80 | 53.0(+68.0)#3,429 |
| 81. | Mount Morris | 120.0 | 53.0(+67.0)#81 | 53.0(+67.0)#3,454 |
| 82. | Metamora | 120.0 | 53.0(+67.0)#82 | 53.0(+67.0)#3,479 |
| 83. | Iron Mountain | 119.0 | 53.0(+66.0)#83 | 53.0(+66.0)#3,506 |
| 84. | Hubbard Lake | 119.0 | 53.0(+66.0)#84 | 53.0(+66.0)#3,529 |
| 85. | Cement City | 119.0 | 53.0(+66.0)#85 | 53.0(+66.0)#3,540 |
| 86. | Augusta | 118.0 | 53.0(+65.0)#86 | 53.0(+65.0)#3,590 |
| 87. | Oscoda | 118.0 | 53.0(+65.0)#87 | 53.0(+65.0)#3,592 |
| 88. | Farwell | 117.0 | 53.0(+64.0)#88 | 53.0(+64.0)#3,654 |
| 89. | Lamont | 116.0 | 53.0(+63.0)#89 | 53.0(+63.0)#3,703 |
| 90. | Gwinn | 115.0 | 53.0(+62.0)#90 | 53.0(+62.0)#3,758 |
| 91. | Shorewood Tower Hills Harbert | 114.0 | 53.0(+61.0)#91 | 53.0(+61.0)#3,818 |
| 92. | Britton | 113.0 | 53.0(+60.0)#92 | 53.0(+60.0)#3,889 |
| 93. | Akron | 112.0 | 53.0(+59.0)#93 | 53.0(+59.0)#3,961 |
| 94. | Jonesville | 111.0 | 53.0(+58.0)#94 | 53.0(+58.0)#3,981 |
| 95. | Eau Claire | 111.0 | 53.0(+58.0)#95 | 53.0(+58.0)#4,007 |
| 96. | Shaftsburg | 111.0 | 53.0(+58.0)#96 | 53.0(+58.0)#4,014 |
| 97. | Painesdale | 111.0 | 53.0(+58.0)#97 | 53.0(+58.0)#4,020 |
| 98. | Grosse Pointe | 109.0 | 53.0(+56.0)#98 | 53.0(+56.0)#4,124 |
| 99. | Hudsonville | 108.0 | 53.0(+55.0)#99 | 53.0(+55.0)#4,175 |
| 100. | Ferrysburg | 108.0 | 53.0(+55.0)#100 | 53.0(+55.0)#4,184 |
Common Questions
What are the Top 10 Cities with the Most Births per 1,000 Women Below Poverty Level in Michigan?
Top 10 Cities with the Most Births per 1,000 Women Below Poverty Level in Michigan are:
#1
615.0
#2
375.0
#3
333.0
#4
298.0
#5
284.0
#6
282.0
#7
266.0
#8
255.0
#9
250.0
#10
250.0
What city has the Most Births per 1,000 Women Below Poverty Level in Michigan?
Oden has the Most Births per 1,000 Women Below Poverty Level in Michigan with 615.0.
What is the Number of Births per 1,000 Women Below Poverty Level in the State of Michigan?
Number of Births per 1,000 Women Below Poverty Level in Michigan is 53.0.
What is the Number of Births per 1,000 Women Below Poverty Level in the United States?
Number of Births per 1,000 Women Below Poverty Level in the United States is 53.0.