Cities with the Highest Percentage of Syrian Population in Michigan
RELATED REPORTS & OPTIONS
Syrian
Michigan
Compare Cities
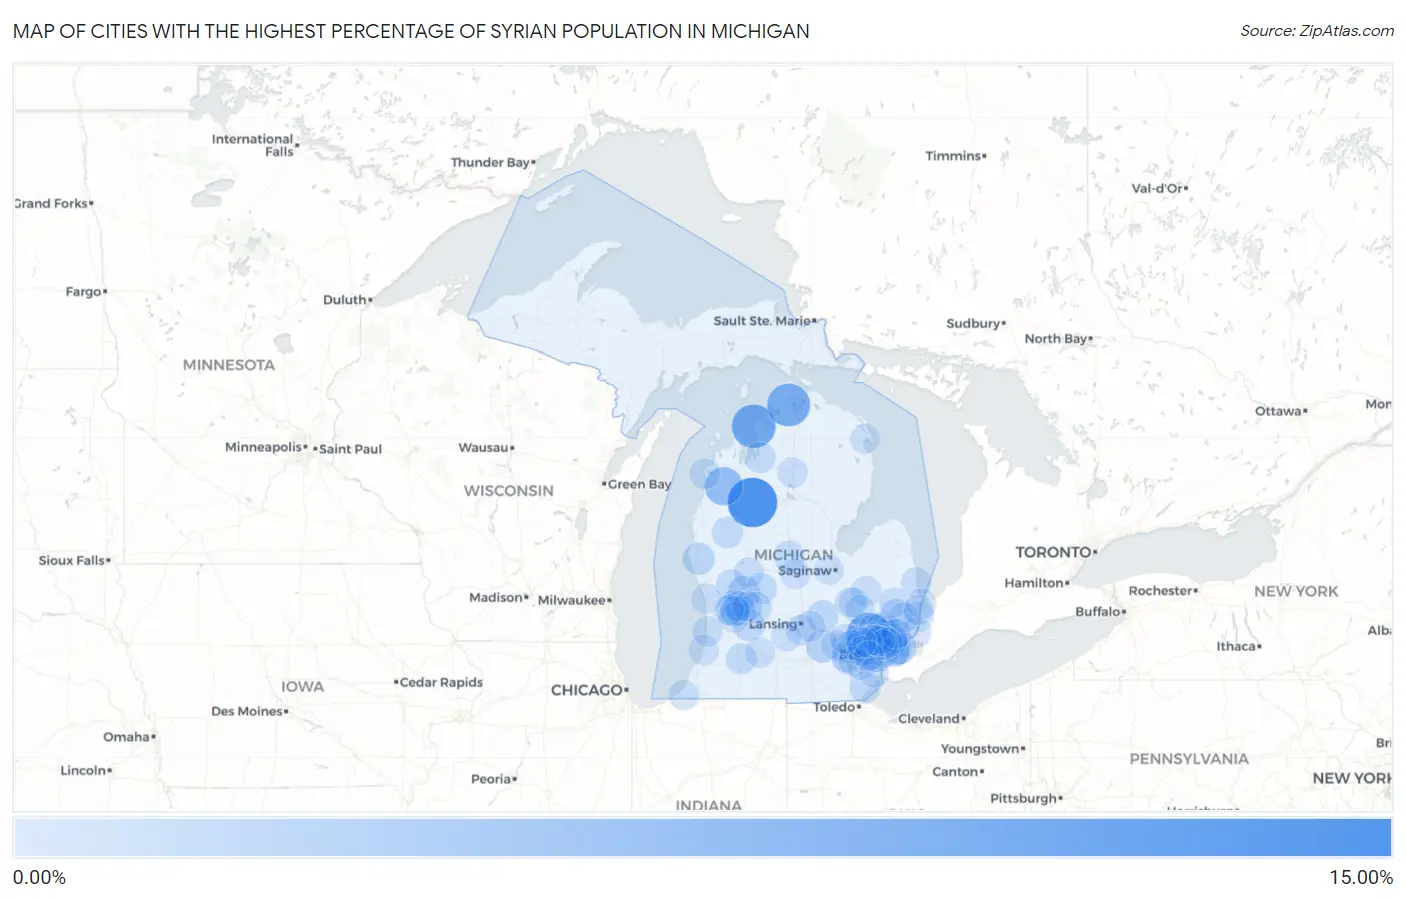
Map of Cities with the Highest Percentage of Syrian Population in Michigan
0.00%
15.00%
Cities with the Highest Percentage of Syrian Population in Michigan
| City | Syrian | vs State | vs National | |
| 1. | Haring | 10.15% | 0.12%(+10.0)#1 | 0.059%(+10.1)#6 |
| 2. | Orchard Lake Village | 7.34% | 0.12%(+7.22)#2 | 0.059%(+7.29)#14 |
| 3. | Norwood | 7.05% | 0.12%(+6.93)#3 | 0.059%(+6.99)#17 |
| 4. | Brutus | 6.64% | 0.12%(+6.51)#4 | 0.059%(+6.58)#20 |
| 5. | Copemish | 4.19% | 0.12%(+4.07)#5 | 0.059%(+4.13)#34 |
| 6. | Rockford | 1.45% | 0.12%(+1.33)#6 | 0.059%(+1.39)#139 |
| 7. | Village Of Grosse Pointe Shores | 1.42% | 0.12%(+1.30)#7 | 0.059%(+1.36)#141 |
| 8. | Stockbridge | 1.35% | 0.12%(+1.23)#8 | 0.059%(+1.29)#148 |
| 9. | Rochester | 1.14% | 0.12%(+1.02)#9 | 0.059%(+1.08)#180 |
| 10. | New Era | 1.13% | 0.12%(+1.01)#10 | 0.059%(+1.07)#183 |
| 11. | Grandville | 1.09% | 0.12%(+0.972)#11 | 0.059%(+1.03)#196 |
| 12. | Armada | 1.03% | 0.12%(+0.909)#12 | 0.059%(+0.971)#210 |
| 13. | Middleville | 0.94% | 0.12%(+0.818)#13 | 0.059%(+0.880)#242 |
| 14. | Morrice | 0.90% | 0.12%(+0.780)#14 | 0.059%(+0.842)#251 |
| 15. | South Monroe | 0.78% | 0.12%(+0.660)#15 | 0.059%(+0.722)#290 |
| 16. | Baldwin | 0.78% | 0.12%(+0.656)#16 | 0.059%(+0.718)#293 |
| 17. | Dearborn | 0.76% | 0.12%(+0.635)#17 | 0.059%(+0.697)#298 |
| 18. | Greenville | 0.69% | 0.12%(+0.567)#18 | 0.059%(+0.629)#329 |
| 19. | Mount Pleasant | 0.64% | 0.12%(+0.521)#19 | 0.059%(+0.582)#350 |
| 20. | Lowell | 0.63% | 0.12%(+0.509)#20 | 0.059%(+0.571)#364 |
| 21. | Troy | 0.61% | 0.12%(+0.492)#21 | 0.059%(+0.554)#377 |
| 22. | Grosse Pointe Park | 0.60% | 0.12%(+0.478)#22 | 0.059%(+0.540)#389 |
| 23. | Rapid City | 0.59% | 0.12%(+0.464)#23 | 0.059%(+0.526)#403 |
| 24. | Oak Park | 0.56% | 0.12%(+0.435)#24 | 0.059%(+0.497)#419 |
| 25. | Casnovia | 0.55% | 0.12%(+0.433)#25 | 0.059%(+0.495)#421 |
| 26. | Utica | 0.54% | 0.12%(+0.418)#26 | 0.059%(+0.480)#432 |
| 27. | Kalamazoo | 0.51% | 0.12%(+0.385)#27 | 0.059%(+0.447)#455 |
| 28. | Walker | 0.49% | 0.12%(+0.372)#28 | 0.059%(+0.434)#466 |
| 29. | Okemos | 0.47% | 0.12%(+0.349)#29 | 0.059%(+0.411)#488 |
| 30. | Holt | 0.47% | 0.12%(+0.344)#30 | 0.059%(+0.406)#496 |
| 31. | Dearborn Heights | 0.37% | 0.12%(+0.250)#31 | 0.059%(+0.312)#590 |
| 32. | Frankfort | 0.36% | 0.12%(+0.241)#32 | 0.059%(+0.303)#602 |
| 33. | Sterling Heights | 0.36% | 0.12%(+0.240)#33 | 0.059%(+0.302)#604 |
| 34. | Whitmore Lake | 0.34% | 0.12%(+0.220)#34 | 0.059%(+0.282)#633 |
| 35. | Pinckney | 0.31% | 0.12%(+0.187)#35 | 0.059%(+0.249)#700 |
| 36. | Lexington | 0.30% | 0.12%(+0.180)#36 | 0.059%(+0.242)#709 |
| 37. | Level Park Oak Park | 0.30% | 0.12%(+0.176)#37 | 0.059%(+0.238)#715 |
| 38. | St Clair | 0.29% | 0.12%(+0.170)#38 | 0.059%(+0.232)#728 |
| 39. | Grayling | 0.28% | 0.12%(+0.164)#39 | 0.059%(+0.225)#741 |
| 40. | Northville | 0.28% | 0.12%(+0.158)#40 | 0.059%(+0.220)#750 |
| 41. | Wixom | 0.27% | 0.12%(+0.150)#41 | 0.059%(+0.211)#770 |
| 42. | Livonia | 0.26% | 0.12%(+0.138)#42 | 0.059%(+0.200)#795 |
| 43. | Columbiaville | 0.26% | 0.12%(+0.138)#43 | 0.059%(+0.199)#796 |
| 44. | South Haven | 0.25% | 0.12%(+0.129)#44 | 0.059%(+0.191)#825 |
| 45. | St Clair Shores | 0.25% | 0.12%(+0.128)#45 | 0.059%(+0.190)#828 |
| 46. | Grosse Pointe Woods | 0.24% | 0.12%(+0.124)#46 | 0.059%(+0.186)#843 |
| 47. | Byron Center | 0.24% | 0.12%(+0.122)#47 | 0.059%(+0.184)#847 |
| 48. | Algonac | 0.24% | 0.12%(+0.119)#48 | 0.059%(+0.181)#859 |
| 49. | Birmingham | 0.23% | 0.12%(+0.109)#49 | 0.059%(+0.171)#890 |
| 50. | Rochester Hills | 0.23% | 0.12%(+0.105)#50 | 0.059%(+0.167)#910 |
| 51. | Barton Hills | 0.23% | 0.12%(+0.104)#51 | 0.059%(+0.166)#913 |
| 52. | Eastpointe | 0.22% | 0.12%(+0.102)#52 | 0.059%(+0.164)#918 |
| 53. | Hazel Park | 0.21% | 0.12%(+0.092)#53 | 0.059%(+0.153)#952 |
| 54. | Ann Arbor | 0.21% | 0.12%(+0.090)#54 | 0.059%(+0.152)#958 |
| 55. | Grosse Pointe Farms | 0.21% | 0.12%(+0.089)#55 | 0.059%(+0.151)#963 |
| 56. | Kentwood | 0.21% | 0.12%(+0.088)#56 | 0.059%(+0.150)#965 |
| 57. | Royal Oak | 0.21% | 0.12%(+0.086)#57 | 0.059%(+0.148)#976 |
| 58. | Grand Rapids | 0.21% | 0.12%(+0.086)#58 | 0.059%(+0.147)#977 |
| 59. | Alma | 0.19% | 0.12%(+0.070)#59 | 0.059%(+0.132)#1,032 |
| 60. | Franklin | 0.19% | 0.12%(+0.068)#60 | 0.059%(+0.129)#1,042 |
| 61. | Bingham Farms | 0.18% | 0.12%(+0.064)#61 | 0.059%(+0.126)#1,055 |
| 62. | Fraser | 0.18% | 0.12%(+0.063)#62 | 0.059%(+0.125)#1,056 |
| 63. | Douglas | 0.18% | 0.12%(+0.055)#63 | 0.059%(+0.117)#1,088 |
| 64. | Three Oaks | 0.17% | 0.12%(+0.045)#64 | 0.059%(+0.107)#1,143 |
| 65. | Forest Hills | 0.17% | 0.12%(+0.044)#65 | 0.059%(+0.106)#1,145 |
| 66. | Howard City | 0.16% | 0.12%(+0.043)#66 | 0.059%(+0.104)#1,154 |
| 67. | Flint | 0.16% | 0.12%(+0.042)#67 | 0.059%(+0.103)#1,158 |
| 68. | Ypsilanti | 0.16% | 0.12%(+0.038)#68 | 0.059%(+0.099)#1,176 |
| 69. | Capac | 0.16% | 0.12%(+0.035)#69 | 0.059%(+0.097)#1,186 |
| 70. | Goodrich | 0.15% | 0.12%(+0.030)#70 | 0.059%(+0.092)#1,214 |
| 71. | Grosse Pointe | 0.14% | 0.12%(+0.021)#71 | 0.059%(+0.083)#1,256 |
| 72. | Madison Heights | 0.14% | 0.12%(+0.019)#72 | 0.059%(+0.081)#1,267 |
| 73. | Roseville | 0.13% | 0.12%(+0.014)#73 | 0.059%(+0.076)#1,295 |
| 74. | Detroit | 0.13% | 0.12%(+0.014)#74 | 0.059%(+0.076)#1,297 |
| 75. | Brighton | 0.13% | 0.12%(+0.013)#75 | 0.059%(+0.075)#1,304 |
| 76. | Burton | 0.13% | 0.12%(+0.008)#76 | 0.059%(+0.070)#1,330 |
| 77. | Jenison | 0.13% | 0.12%(+0.006)#77 | 0.059%(+0.068)#1,340 |
| 78. | Belleville | 0.13% | 0.12%(+0.005)#78 | 0.059%(+0.067)#1,345 |
| 79. | Garden City | 0.12% | 0.12%(+0.000)#79 | 0.059%(+0.062)#1,367 |
| 80. | Richmond | 0.12% | 0.12%(-0.001)#80 | 0.059%(+0.061)#1,381 |
| 81. | Clawson | 0.11% | 0.12%(-0.007)#81 | 0.059%(+0.055)#1,422 |
| 82. | Ferndale | 0.11% | 0.12%(-0.012)#82 | 0.059%(+0.050)#1,460 |
| 83. | Port Huron | 0.10% | 0.12%(-0.017)#83 | 0.059%(+0.045)#1,484 |
| 84. | Auburn Hills | 0.10% | 0.12%(-0.019)#84 | 0.059%(+0.043)#1,495 |
| 85. | Beverly Hills | 0.095% | 0.12%(-0.026)#85 | 0.059%(+0.036)#1,534 |
| 86. | South Lyon | 0.093% | 0.12%(-0.028)#86 | 0.059%(+0.034)#1,545 |
| 87. | Mount Clemens | 0.089% | 0.12%(-0.032)#87 | 0.059%(+0.030)#1,576 |
| 88. | Farmington Hills | 0.087% | 0.12%(-0.034)#88 | 0.059%(+0.028)#1,595 |
| 89. | Charlotte | 0.086% | 0.12%(-0.035)#89 | 0.059%(+0.027)#1,603 |
| 90. | Plymouth | 0.086% | 0.12%(-0.035)#90 | 0.059%(+0.027)#1,606 |
| 91. | Berkley | 0.086% | 0.12%(-0.035)#91 | 0.059%(+0.027)#1,610 |
| 92. | Warren | 0.085% | 0.12%(-0.036)#92 | 0.059%(+0.026)#1,614 |
| 93. | Westland | 0.085% | 0.12%(-0.036)#93 | 0.059%(+0.026)#1,619 |
| 94. | Grand Haven | 0.082% | 0.12%(-0.039)#94 | 0.059%(+0.023)#1,636 |
| 95. | Wyoming | 0.078% | 0.12%(-0.043)#95 | 0.059%(+0.019)#1,666 |
| 96. | Marysville | 0.070% | 0.12%(-0.051)#96 | 0.059%(+0.011)#1,727 |
| 97. | Alpena | 0.069% | 0.12%(-0.052)#97 | 0.059%(+0.010)#1,739 |
| 98. | Novi | 0.068% | 0.12%(-0.053)#98 | 0.059%(+0.009)#1,743 |
| 99. | Shields | 0.067% | 0.12%(-0.054)#99 | 0.059%(+0.008)#1,756 |
| 100. | Flat Rock | 0.067% | 0.12%(-0.054)#100 | 0.059%(+0.008)#1,760 |
Common Questions
What are the Top 10 Cities with the Highest Percentage of Syrian Population in Michigan?
Top 10 Cities with the Highest Percentage of Syrian Population in Michigan are:
#1
10.15%
#2
7.34%
#3
7.05%
#4
6.64%
#5
4.19%
#6
1.45%
#7
1.42%
#8
1.35%
#9
1.14%
#10
1.13%
What city has the Highest Percentage of Syrian Population in Michigan?
Haring has the Highest Percentage of Syrian Population in Michigan with 10.15%.
What is the Percentage of Syrian Population in the State of Michigan?
Percentage of Syrian Population in Michigan is 0.12%.
What is the Percentage of Syrian Population in the United States?
Percentage of Syrian Population in the United States is 0.059%.